Activation of a Metabolic Gene Regulatory
Network Downstream of mTOR Complex 1
The MIT Faculty has made this article openly available.
Please share
how this access benefits you. Your story matters.
Citation
Düvel, Katrin, Jessica L. Yecies, Suchithra Menon, Pichai Raman,
Alex I. Lipovsky, Amanda L. Souza, Ellen Triantafellow, et al.
“Activation of a Metabolic Gene Regulatory Network Downstream of
mTOR Complex 1.” Molecular Cell 39, no. 2 (July 2010): 171–183.
As Published
http://dx.doi.org/10.1016/j.molcel.2010.06.022
Publisher
Elsevier BV
Version
Author's final manuscript
Citable link
http://hdl.handle.net/1721.1/116937
Terms of Use
Creative Commons Attribution-NonCommercial-NoDerivs License
Activation of a metabolic gene regulatory network downstream
of mTOR complex 1
Katrin Düvel1,7, Jessica L. Yecies1,7, Suchithra Menon1,8, Pichai Raman2,8, Alex I.
Lipovsky1,5, Amanda L. Souza3, Ellen Triantafellow2, Qicheng Ma2, Regina Gorski2,
Stephen Cleaver2, Matthew G. Vander Heiden4, Jeffrey P. MacKeigan2,6, Peter M. Finan2,
Clary B. Clish3, Leon O. Murphy2,*, and Brendan D. Manning1,*
1Department of Genetics and Complex Diseases, Harvard School of Public Health, Boston, MA
02115
2Developmental and Molecular Pathways, Novartis Institutes for BioMedical Research,
Cambridge, MA 02139
3Metabolite Profiling Initiative, Broad Institute of MIT and Harvard, Cambridge, MA 02142 4The David H. Koch Institute for Integrative Cancer Research at MIT, Cambridge, MA 02142
Abstract
Aberrant activation of the mammalian target of rapamycin complex 1 (mTORC1) is a common molecular event in a variety of pathological settings, including genetic tumor syndromes, cancer, and obesity. However, the cell intrinsic consequences of mTORC1 activation remain poorly defined. Through a combination of unbiased genomic, metabolomic, and bioinformatic
approaches, we demonstrate that mTORC1 activation is sufficient to stimulate specific metabolic pathways, including glycolysis, the oxidative arm of the pentose phosphate pathway, and de novo lipid biosynthesis. This is achieved through the activation of a transcriptional program affecting metabolic gene targets of hypoxia-inducible factor (HIF1α) and sterol regulatory element-binding protein (SREBP1 and SREBP2). We find that SREBP1 and 2 promote proliferation downstream of mTORC1, and the activation of these transcription factors is mediated by S6K1. Therefore, in addition to promoting protein synthesis, mTORC1 activates specific bioenergetic and anabolic cellular processes that are likely to contribute to human physiology and disease.
INTRODUCTION
The mammalian target of rapamycin (mTOR) is an evolutionarily conserved Ser/Thr kinase that has been implicated in a diverse array of physiological processes and pathological states. Aberrantly elevated mTOR activity is a common molecular defect detected in the majority of human cancers (Menon and Manning, 2009), under conditions of obesity (Dann et al., 2007), and in genetic syndromes with a high incidence of cognitive deficits and autism
© 2010 Elsevier Inc. All rights reserved
*Correspondence to: [email protected] [email protected].
5Current Address: Department of Genetics, Yale University School of Medicine, New Haven, CT 06520; 6Current Address: Laboratory of Systems Biology, Van Andel Research Institute;
7These authors contributed equally to this work 8These authors contributed equally to this work
Publisher's Disclaimer: This is a PDF file of an unedited manuscript that has been accepted for publication. As a service to our
customers we are providing this early version of the manuscript. The manuscript will undergo copyediting, typesetting, and review of
NIH Public Access
Author Manuscript
Mol Cell. Author manuscript; available in PMC 2011 July 30.
Published in final edited form as:
Mol Cell. 2010 July 30; 39(2): 171–183. doi:10.1016/j.molcel.2010.06.022.
NIH-PA Author Manuscript
NIH-PA Author Manuscript
spectrum disorders (Ehninger et al., 2009). While this increased activation of mTOR is believed to contribute to the development and progression of these diseases, the downstream consequences of mTOR activation at the molecular, cellular, and organismal levels are poorly understood.
The mTOR kinase exists within two physically and functionally distinct protein complexes, mTORC1 and mTORC2, which differ in their regulation, downstream targets, and
sensitivity to the allosteric mTOR inhibitor rapamycin (Guertin and Sabatini, 2009). mTORC1 consists of the core essential components mTOR, Raptor, and mLST8 and is acutely sensitive to rapamycin. Pharmacological and genetic studies have demonstrated that mTORC1 activation increases cell growth (i.e., an increase in cell mass) in diverse
organisms from yeast to human (Wullschleger et al., 2006). However, mTORC1 inhibition using rapamycin causes most mammalian cells to arrest in the G1 phase of the cell cycle, thereby demonstrating that mTORC1 activity also promotes cell proliferation. While the molecular mechanisms by which mTORC1 promotes anabolic cell growth and proliferation are not fully understood, two classes of direct downstream targets of mTORC1 have been well characterized. Specifically as part of mTORC1, mTOR directly phosphorylates the ribosomal protein S6 kinases (S6K1 and S6K2) and the eukaryotic initiation factor 4E (eIF4E)-binding proteins (4E-BP1 and 4E-BP2), both of which control specific steps in the initiation of cap-dependent translation (Ma and Blenis, 2009). Phosphorylation of the S6Ks downstream of mTORC1 leads to their activation, whereas phosphorylation of the 4E-BPs lead to their inhibition and release from eIF4E at the 5' cap of mRNAs. mTORC2 is
comprised of the core essential components mTOR, Rictor, mSIN1, and mLST8. Within this complex, mTOR is not directly inhibited by rapamycin, but mTORC2 assembly is blocked by prolonged exposure to this compound (Sarbassov et al., 2006). The known downstream targets of mTORC2 are all AGC family kinases, including Akt, SGK1, and PKCα (Guertin and Sabatini, 2009). The focus of this current study is on downstream events specific to mTORC1 signaling.
The aberrant increase in mTORC1 signaling detected in a variety of human disease states is due to genetic or environmental factors leading to frequent misregulation of upstream signaling pathways that, in large part, converge on a small G protein switch essential for the proper control of mTORC1 activation. In its GTP-bound state, the Ras-related GTPase Rheb is a potent and essential activator of mTORC1 (Avruch et al., 2006; Huang and Manning, 2008). Rheb is tightly regulated by a GTPase-activating protein (GAP) called TSC2 (or tuberin). Along with its binding partner TSC1 (or hamartin), TSC2 is encoded by a tumor suppressor gene mutated in the genetic tumor syndrome tuberous sclerosis complex (TSC; Crino et al., 2006). TSC2 has specific GAP activity toward Rheb, which is greatly enhanced by binding to TSC1, thereby inactivating Rheb and, in turn, mTORC1. As a key regulator of anabolic growth and proliferation, mTORC1 is exquisitely sensitive to cellular growth conditions, such as the presence or absence of growth factors, nutrients, energy, and stress. Many of the signaling pathways that relay the status of these conditions to mTORC1 do so, at least in part, through specific phosphorylation events on the TSC1–TSC2 complex that affect the ability of this complex to act as a GAP for Rheb (Huang and Manning, 2008). Reciprocal to its inhibitory effects on mTORC1, the TSC1–TSC2 complex promotes the activation of mTORC2 through an as yet unknown mechanism that can be separated from its effects on Rheb and mTORC1 (Huang et al., 2008; Huang et al., 2009).
Importantly, genetic loss of either TSC1 or TSC2 leads to constitutive activation of mTORC1 that is largely insensitive to perturbations in cellular growth conditions (Huang and Manning, 2008). This is most obvious under conditions of growth factor withdrawal, where mTORC1 signaling is attenuated in normal cells but remains fully stimulated in cells lacking a functional TSC1–TSC2 complex or overexpressing Rheb (e.g., Jaeschke et al.,
NIH-PA Author Manuscript
NIH-PA Author Manuscript
2002; Kwiatkowski et al., 2002; Tee et al., 2003; Zhang et al., 2003). Consistent with its role in the activation of mTORC2, TSC-deficient cells exhibit defects in mTORC2 activity, even in the presence of growth factors (Huang et al., 2008; Huang et al., 2009). In this study, we take advantage of these major differences in mTOR signaling between Tsc1 and Tsc2 null cells and their wild-type counterparts to isolate mTORC1 activity from mTORC2 and other growth factor-stimulated signaling pathways. By comparing TSC-deficient cells to wild-type cells in the absence of growth factors, we have an mTORC1 gain-of-function model that, when combined with rapamycin, can be used to reveal cellular processes that mTORC1 activation is sufficient to induce. Through a combination of genomic, metabolomic, and bioinformatic analyses, we find that mTORC1 activation on its own can stimulate a gene network that alters specific metabolic pathways.
RESULTS
A genomic approach to identify transcriptional targets downstream of mTORC1
Cells lacking TSC1 or TSC2 exhibit growth-factor independent activation of mTORC1 (Figure 1A). In order to identify mTORC1-dependent transcriptional changes, we compared wild-type MEFs to Tsc1−/− and Tsc2−/− MEFs following serum starvation, where mTORC1 signaling is off in wild-type cells and fully active in TSC-deficient cells (P-S6K1; Figure 1B). Importantly, under these conditions, mTORC2 targets are off in all of these cell lines, as Akt-S473 phosphorylation is lost and SGK1 protein levels are nearly undetectable. All cell lines were serum-starved for 24 h, and the Tsc1−/− and Tsc2−/− cells were treated with a time course of rapamycin prior to the isolation of mRNA for microarray analysis. The use of both Tsc1 and Tsc2 null cells provides an added degree of stringency and controls for non-specific differences in these independently derived lines (Kwiatkowski et al., 2002; Zhang et al., 2003). In order to be classified as an mTORC1-regulated transcript in this study, a gene probe must meet four independent criteria at a P-value<0.01: 1) different in Tsc1−/− versus wild-type; 2) different in Tsc2−/− versus wild-type; 3) reverted toward wild-type levels by rapamycin in Tsc1−/−; 4) reverted toward wild-type levels by rapamycin in Tsc2−/− (Figure 1C). Strikingly, only 239 of the 39,000 gene probes analyzed, representing 205 genes, met these conditions (Table S1). These are shown in the scatter plot in Figure 1D (blue dots) in relation to all others (gray dots). These 205 genes include those that are decreased in TSC1-and TSC2-deficient cells TSC1-and stimulated by rapamycin (75 mTORC1-repressed genes) TSC1-and those that are increased in these cells and inhibited by rapamycin (130 mTORC1-induced genes). The rapamycin time course revealed that the majority of these mTORC1-regulated genes were responsive to rapamycin at 6 to 12 h of treatment in both Tsc2−/− (Figure 1E) and Tsc1−/− (Figure S1) cells.
mTORC1 induces genes encoding the enzymes of specific metabolic pathways
To identify functional groups that are enriched amongst the mTORC1-regulated genes, a gene set enrichment analysis (GSEA) was performed on a larger set of genes meeting the above criteria for being induced or repressed by mTORC1 signaling at a P-value<0.05 (Table S2). Interestingly, within the top 20 mTORC1-induced gene sets are specific metabolic pathways, including the pentose phosphate pathway (P<7×10⁻⁸), fatty acid biosynthesis (P<5×10⁻⁶), glycolysis (P<0.0002), and cholesterol biosynthesis (P<0.0031). Indeed, a survey of mTORC1-induced genes found many encoding the enzymes of
glycolysis (Figure 2A), the pentose phosphate pathway (Figure 2B), and sterol and fatty acid biosynthesis (Figure 2C) to be elevated in both Tsc1−/− and Tsc2−/− cells and rapamycin sensitive (Table S3). The mTORC1-dependent induction of many of these genes was verified by qRT-PCR (representative genes shown in Figures 2D–F). In addition, the regulation of representative genes from these metabolic pathways was further confirmed in three independent genetic settings of mTORC1 activation, including Tsc2−/− MEFs
NIH-PA Author Manuscript
NIH-PA Author Manuscript
reconstituted with empty vector or human TSC2 (Figure S2A), HeLa cells with a stable shRNA-mediated knockdown of TSC2 (Figure S2B), and HEK-293 cells overexpressing Rheb (Figure S2C). In all three systems, activation of mTORC1 signaling led to increased expression of genes of glycolysis, the pentose phosphate pathway, and lipid/sterol biosynthesis and rapamycin reversed this effect. Finally, consistent with these genes being downstream of mTORC1, withdrawal of the essential amino acid leucine from Tsc2−/− cells led to a repression of these metabolic genes similar to that seen with rapamycin (Figure S2D).
Due to sustained mTORC1 signaling, cells lacking the TSC1–TSC2 complex can proliferate in the absence of growth factors (Zhang et al., 2006; see below). This raises the possibility that the differences in metabolic gene expression between wild-type and TSC-deficient cells are due to differences in proliferation. This was addressed by arresting the proliferation of
Tsc2−/− cells through a standard double thymidine block (DTB). The DTB had a more pronounced effect on proliferation than rapamycin in these cells, but did not inhibit mTORC1 signaling (Figure S2E). While the DTB-mediated arrest of Tsc2−/− cells led to a modest decrease in the expression of representative metabolic genes, their expression remained significantly higher than in wild-type cells and fully sensitive to rapamycin (Figure 2D–F). Therefore, the mTORC1-induced expression of these metabolic genes is independent of cell proliferation.
mTORC1 activation is sufficient to induce specific metabolic processes
As depicted in Figure 3A, mTORC1 signaling activates the expression of genes encoding nearly every step of glycolysis and the pentose phosphate pathway, as well as critical enzymes in the de novo synthesis of sterols, isoprenoids, and fatty acids. To investigate whether these transcriptional changes are also reflected by changes in cellular metabolism, we measured effects on both specific metabolic processes and global metabolites. Consistent with the gene expression profile, Tsc2−/− cells exhibit a rapamycin-sensitive increase in glucose uptake (Figure 3B), lactate secretion (Figure 3C), and de novo lipid biosynthesis (Figure 3D). To obtain a more global and unbiased analysis of mTORC1-mediated changes in intracellular metabolites, a liquid chromatography mass spectrometry (LC-MS)-based metabolomics approach was employed. As with our genomic study, we compared littermate-derived wild-type and Tsc2−/− MEFs under growth factor-free conditions, where mTORC1 signaling is off in wild-type cells but fully active and rapamycin sensitive in the Tsc2 null cells. Only 21 of the 119 metabolites measured showed a pattern consistent with mTORC1-induced changes (i.e., elevated in Tsc2−/− cells relative to Tsc2+/+ and decreased by rapamycin; Figure S3 and Table S4). Of these, only the intermediates of glycolysis and the pentose phosphate pathway showed a pathway-specific pattern of increase by mTORC1 signaling (Figure 3E).
To determine whether the steady state increase in these intermediates reflects an increase in flux through these pathways, we measured metabolite levels following a 15 min pulse of [1,2-13C]-glucose. Indeed, we found increased 13C-labeling of glycolytic and pentose phosphate pathway intermediates in Tsc2−/− cells, which was blocked by rapamycin treatment (Figure 3F and G). The use of doubly labeled [1,2-13C]-glucose allowed us to determine whether the increase in ribulose 5-phosphate and ribose 5-phosphate was the result of increased flux through the oxidative (glucose 6-phosphate dehydrogenase (G6PD)-mediated) or non-oxidative branches of the pentose phosphate pathway. If ribulose 5-phosphate and ribose 5-5-phosphate are singly labeled, they are produced through the oxidative arm, as phosphogluconate dehydrogenase (PGD) catalyzes decarboxylation and loss of the 1 carbon as CO2, whereas doubly labeled intermediates could only come from the
non-oxidative branch. Consistent with the mTORC1-dependent increase in expression of G6PD and PGD, there was a rapamycin-sensitive increase in singly labeled ribose and
NIH-PA Author Manuscript
NIH-PA Author Manuscript
ribulose in the Tsc2−/− cells, while there was no difference in levels of doubly labeled pentose phosphate pathway intermediates (Figure 3G). These data demonstrate that the mTORC1-induced expression of genes encoding the enzymes of glycolysis and the oxidative arm of the pentose phosphate pathway is accompanied by increased flux through these pathways.
Identification of enriched transcription factor-binding elements in mTORC1-regulated genes
To identify candidate transcription factors downstream of mTORC1, we used a previously described unbiased bioinformatic approach (MotifADE; Mootha et al., 2004; Ma et al., 2008) to detect transcription factor-binding motifs enriched in the promoters of mTORC1-regulated genes from the expression array study. This approach identifies over-represented
cis regulatory elements present in the promoters of specific gene sets. An analysis of all
genes sensitive to rapamycin at 24 h revealed that binding motifs for only four transcription factors are significantly enriched (q-value>0.01) in the data from both Tsc1−/− and Tsc2−/− cells (Table 1). Interestingly, two of these factors, sterol regulatory element-binding protein (SREBP) and c-Myc are well known to regulate specific aspects of cellular metabolism. C-Myc has been estimated to regulate up to 15% of all genes, including the genes of glycolysis (Dang et al., 2006). However, the c-Myc protein is very unstable and following 24 h of serum deprivation, as performed in our gene expression analysis, it is not detectable in the TSC-deficient cells (e.g., Figure S4A). Importantly, the transcription factor hypoxia-inducible factor (HIF1) stimulates the same genes of glycolysis and, like c-Myc, is a basic helix loop helix (bHLH) transcription factor that recognizes an overlapping promoter-binding element (Table 1; Gordan et al., 2007; Semenza, 2003).
HIF1α is responsible for the glycolytic response downstream of mTORC1
Given that known targets of HIF1 involved in glycolysis are elevated in an mTORC1-dependent manner in the TSC-deficient cells, we analyzed 26 previously characterized HIF1 targets in our expression array data. These genes all demonstrated a pattern of induction by mTORC1, as they were elevated in both Tsc1 and Tsc2 null cells and rapamycin sensitive (Figure 4A and Table S3). These genes included those encoding the enzymes of glycolysis as well as non-metabolic targets, several of which were in our most stringent dataset. The HIF1 transcription factor is a heterodimer comprised of the constitutively expressed HIF1β/ ARNT subunit complexed with either HIF1α or HIF2α/EPAS1 (Gordan et al., 2007; Semenza, 2003). The HIFα subunit appears to dictate the target specificity of the HIF1 heterodimer (Hu et al., 2003), and TSC-deficient cells display mTORC1-dependent transcriptional upregulation of targets specific to HIF1α(e.g., glycolysis genws), as well as those shared between HIF1α and HIF2α (e.g., VEGF).
As we are focused here on the metabolic genes, we examined the mechanism leading to upregulation of the HIF1αsubunit, which activates the genes of glycolysis (Hu et al., 2003; Semenza et al., 1994). Consistent with the global upregulation of HIF1α targets and the findings from a previous study (Brugarolas et al., 2003), both Tsc1−/− and Tsc2−/− cells have elevated levels of HIF1α protein relative to their wild-type counterparts (Figure 4B). Similar to its transcriptional targets, this increase is blocked following 2 to 6 h of rapamycin treatment. The upregulation of HIF1α is specific to mTORC1 and not affected by the status of mTORC2 in these cells. Unlike Tsc2−/− MEFs, Rictor−/− MEFs do not show elevated levels of HIF1α (Figure S4B), and the increased HIF1α in Tsc2−/− cells is sensitive to siRNAs targeting Raptor but not Rictor (Figure S4C). Through studies using rapamycin, mTORC1 signaling has been implicated in the activation of HIF1(e.g., Hudson et al., 2002; Zhong et al., 2000), in part through selective control of translation from the 5'-untranslated region (UTR) of the HIF1α mRNA (Laughner et al., 2001; Thomas et al., 2006). To test
NIH-PA Author Manuscript
NIH-PA Author Manuscript
whether mTORC1 activation alone was sufficient to stimulate translation from the HIF1α 5'-UTR, we utilized a bicistronic reporter in which the translation of Renilla luciferase is under control of the HIF1α 5'-UTR and firefly luciferase is translated from an internal ribosomal entry sequence (IRES; Figure 4C). Tsc2−/− MEFs showed enhanced translation from the HIF1α 5'-UTR, and this was rescued by expression of human TSC2 or rapamycin treatment. Expression of a dominantly active 4E-BP1 mutant lacking two mTORC1 inhibitory
phosphorylation sites (4E-BP1-T37A/T46A) blocked this selective translation (Figure 4C), whereas expression of wild-type 4E-BP1 resulted in a partial decrease (Figure S4D). We found no effect of siRNAs targeting S6K1 and S6K2 on translation from the HIF1α 5'-UTR (Figure S4E), but S6K1 knockdown led to a modest decrease in HIF1α protein levels (Figure S4F). These data suggest that mTORC1 activation is sufficient to stimulate an increase in HIF1α protein levels, at least in part, through mTORC1-mediated inhibition of 4E-BP1 and subsequent activation of 5'-cap-dependent translation. However, we cannot rule out further contributing effects from gene expression, as both Hif1α (Figure 4D) and Hif2α (data not shown) mRNA levels are increased in an mTORC1-dependent manner (i.e., sensitive to rapamycin or siRNAs targeting Raptor) in Tsc2-deficient cells.
To determine whether HIF1α is the transcription factor downstream of mTORC1 in the control of glycolytic genes, the expression of representative genes was analyzed following the introduction of siRNAs targeting either Raptor or HIF1α (Figure 4E). Indeed, HIF1α knockdown reduced the mRNA levels of Glut1, Pfkp, and Pdk1 in Tsc2−/− cells to wild-type levels, similar to Raptor siRNAs or rapamycin treatment. In this experiment and those described below, transient knockdown of Raptor generally elicits a weaker inhibitory effect than rapamycin, and this is reflected in an incomplete block of mTORC1 signaling by Raptor siRNAs in the Tsc2−/− cells (Figure S4G). Consistent with the increase in HIF1α and its targets being responsible for the mTORC1-dependent increase in glycolysis observed, siRNA-mediated knockdown of HIF1α in Tsc2−/− cells significantly blocked the increase in glucose uptake (Figure 4F).
SREBP is responsible for the increase in lipid biosynthesis, the pentose phosphate pathway, and cell proliferation downstream of mTORC1
The DNA-binding element recognized by SREBP was found to be the most highly enriched motif in the promoters of rapamcyin-sensitive genes in our expression array study (Table 1). Importantly, SREBP1 and SREBP2 are master transcriptional regulators of genes involved in de novo lipid and sterol biosynthesis genes (Espenshade and Hughes, 2007). Full-length SREBPs reside as inactive, transmembrane precursors in the endoplasmic reticulum and are activated by trafficking to the Golgi where they are processed by proteases. The active processed form then translocates to the nucleus to turn on its target genes. Interestingly, a recent study found that overexpression of an activated version of Akt leads to a rapamycin-sensitive increase in the processed form of SREBP1 (Porstmann et al., 2008). To gain insights into how mTORC1 activation might increase the transcription of a large number of known SREBP targets, we compared the protein levels of full length and processed SREBP1 in littermate-derived wild-type and either Tsc1−/− or Tsc2−/− cells. While modest increases in the levels of full length SREBP1 could be detected, larger differences were seen in the processed active form of SREBP1, which were elevated in the TSC-deficient lines relative to their wild-type counterparts (Figure 5A). This is reflected by an increase in the ratio of processed to full length SREBP1 in these cells that is sensitive to rapamycin. The increased levels of processed SREBP1 are specific to mTORC1 and not affected by the status of mTORC2 in these cells. Unlike Tsc2−/− MEFs, Rictor−/− MEFs do not show elevated levels of processed SREBP1 (Figure S4B), and the increase in Tsc2−/− cells is sensitive to siRNAs targeting Raptor but not Rictor (Figure 5B). However, as with Hif1α and Hif2α, rapamycin-sensitive increases in Srebp1 and Srebp2 transcript levels are detected in Tsc2-deficient cells
NIH-PA Author Manuscript
NIH-PA Author Manuscript
(Figures S5A and B) or HEK-293 cells overexpressing Rheb (Figures S5C and D). Interestingly, siRNAs specific to Srebp1 strongly down-regulate the transcript levels of
Srebp2. These data suggest that the mTORC1-dependent increase in Srebp1 and Srebp2
transcript levels are due to their transcriptional activation by processed SREBP1. In support of this idea, we found that overexpressing the processed form of SREBP1 in HEK-293 cells can increase the endogenous transcript levels of both SREBP1 and SREBP2 (Figure S5C and D). Furthermore, unlike Rheb overexpression, this effect is resistant to rapamycin, indicating that the processed form of SREBP1 acts downstream of mTORC1.
To confirm that the mTORC1-driven expression of fatty acid and sterol biosynthesis genes is dependent on the SREBP transcription factors, the expression of representative gene were analyzed following siRNA-mediated knockdown of Srebp1 and/or Srebp2. Similar to Raptor knockdown, siRNAs targeting one or both of these transcription factors blocked the
expression of genes encoding enzymes involved in de novo fatty acid biosynthesis (e.g.,
Scd1 and Acsl3, Figure 5C). Knockdown of either Srebp1 or Srebp2 also blocked the
expression of genes involved in sterol and isoprenoid biosynthesis (e.g., Mvk and Sc5d, Figure 5D), with SREBP2 playing a more dominant role in the regulation of these genes. Therefore, the SREBP1 and SREBP2 transcription factors are required for the mTORC1-induced expression of fatty acid and sterol biosynthesis genes.
The unbiased genomic and metabolomic profiling described above revealed that mTORC1 signaling stimulates the oxidative pentose phosphate pathway. To gain insight into the regulation of this pathway by mTORC1, we used siRNAs targeting a number of candidate transcription factors and measured effects on the mRNA levels of G6pd, encoding the rate-limiting enzyme in the oxidative phase of the pentose phosphate pathway. Interestingly, we found that siRNA-mediated knockdown of SREBP1 decreased the rapamycin-sensitive expression of G6pd in Tsc2-deficient cells (Figure 5E). Furthermore, overexpression of the processed form of SREBP1 could induce G6PD expression in HEK-293 cells (Figure 5F). Unlike Rheb overexpression, the effects of SREBP1 on G6PD transcript levels were largely resistant to rapamycin, suggesting that the processed form of SREBP1 is downstream of mTORC1 for the regulation of this gene.
We next determined the role of SREBP in mTORC1-dependent cellular processes. The transcriptional activation of SREBP targets encoding the key enzymes of fatty acid biosynthesis (FASN) and the pentose phosphate pathway (G6PD) leads to a rapamycin-sensitive increase in the level of these enzymes in Tsc2−/− cells (Figure S5E). Importantly, we found that the mTORC1-dependent increase in de novo lipid biosynthesis observed in
Tsc2−/− cells was dependent on SREBP, but not HIF1α, with Srebp1 knockdowns reducing the levels to that of wild-type cells and Srebp1/2 double knockdowns reducing it further (Figure 5G). Unlike rapamycin, knockdown of neither HIF1α nor SREBP1 and 2 affected mTORC1 signaling. Interestingly, the growth factor-independent, mTORC1-dependent proliferation of the Tsc2−/− cells was blocked by siRNAs targeting both Srebp1 and Srebp2, displaying similar effects to that of rapamycin (Figures 5H and S5F). Knocking down
Srebp1 alone decreased proliferation to a lesser extent, whereas knocking down Hif1α alone
or in combination with Hif2α had only marginal effects on this phenotype. These findings indicate that the SREBP-dependent activation of a lipogenic program is required for mTORC1-driven cell proliferation.
mTORC1 activates SREBP1 through S6K1
Once processed and released from the Golgi, the active form of SREBP1 is susceptible to proteasomal degradation (Espenshade and Hughes, 2007). To gain insight into how
mTORC1 signaling leads to elevated levels of processed SREBP1, we examined the stability of this active form. Following cyclohexamide treatment, the processed form of SREBP1 was
NIH-PA Author Manuscript
NIH-PA Author Manuscript
degraded with similar kinetics in the presence or absence of TSC2 (Figure S6). This suggests that the mTORC1-dependent accumulation of processed SREBP1 in Tsc1−/− and
Tsc2−/− cells is not due to increased protein stability. To further examine potential
differences in SREBP1 degradation, we tested the effects of a proteasome inhibitor (ALLN) on this regulation. While ALLN treatment substantially increased the overall levels of processed SREBP1, this active form remained higher in the Tsc2−/− cells and, compared to untreated cells, was equally sensitive to rapamycin (Figure 6A). Finally, as GSK3-mediated phosphorylation of SREBP1 has been found to target it for degradation (Sundqvist et al., 2005), we examined a potential role for GSK3. Efficient knockdown of GSK3α and β did not alter the levels or rapamycin sensitivity of processed SREBP1 in Tsc2−/− cells (Figure 6B). Collectively, these data suggest that mTORC1 signaling exerts a regulatory input into the processing step of SREBP1.
In order to identify the mTORC1-proximal signaling component responsible for the regulation of SREBP1 processing, we tested the effects of siRNAs targeting S6K1 and S6K2. Interestingly, knockdown of S6K1 or both S6K1 and 2 lead to a substantial decrease in the levels of processed SREBP1 in Tsc2−/− cells, even in the presence of the proteasome inhibitor (Figure 6B). The inhibitory effects of S6K1 knockdown on the levels of active SREBP1 is also reflected by a decrease in the expression levels of several of its
transcriptional targets, including both lipid biosynthesis and pentose phosphate pathway genes (6C). Finally, loss of S6K1 leads to a partial but significant attenuation of the enhanced lipid biosynthesis phenotype of Tsc2−/− cells (6D). Therefore, S6K1 is the major downstream target of mTORC1 stimulating the activation of SREBP1.
DISCUSSION
The cell lines and conditions chosen for this study were designed to isolate mTORC1 signaling from mTORC2, upstream branching pathways, parallel pathways, and feedback mechanisms that all accompany mTORC1 activation downstream of growth factors. While studies using rapamycin alone can reveal functions for which mTORC1 is necessary, combining rapamycin with an mTORC1 gain-of-function approach can identify those processes and pathways for which mTORC1 activity is both necessary and sufficient. Previous studies have profiled the effects of rapamycin on gene expression in lymphocytes (Grolleau et al., 2002; Peng et al., 2002), and these studies have identified individual genes of glycolysis and lipid biosynthesis that were also classified as mTORC1-regulated transcripts in our study. Our study demonstrates that the genes of glycolysis, the pentose phosphate pathway, and sterol and lipid biosynthesis are amongst the most prominently induced by mTORC1. Interestingly, the set of mTORC1-regulated transcripts indentified in this study has substantial overlap with gene sets from two independent studies that have profiled transcriptional changes induced by forced expression of membrane-targeted Akt (myr)-Akt, which is constitutively active and potently affects many downstream pathways, including the TSC-mTORC1 pathway (Majumder et al., 2004; Porstmann et al., 2005). One of these studies concluded that myr-Akt induces most of the genes of glycolysis through increased HIF1α (Majumder et al., 2004), while the other found that myr-Akt induces many genes involved in lipid and cholesterol biosynthesis through increased SREBP1 and SREBP2 (Porstmann et al., 2005). We find that mTORC1 signaling alone is sufficient to activate these transcription factors and their many downstream targets.
Perhaps the most striking finding from our unbiased analyses of mTORC1-regulated transcripts is the specificity of the effects of mTORC1 activation on HIF1 and SREBP, relative to other transcription factors. However, the mechanism by which mTORC1 activates these two sets of transcription factors appears to be quite different (see model in Figure 6E). Our data support previous studies using rapamycin alone, which have concluded that
NIH-PA Author Manuscript
NIH-PA Author Manuscript
mTORC1 signaling increases HIF1α protein levels by promoting mRNA translation from its 5'UTR (Laughner et al., 2001; Thomas et al., 2006), and we find that this induction requires the inhibitory phosphorylation of 4E-BP1. However, we also find an mTORC1-dependent increase in Hif1α and Hif2α/Epas1 transcript levels, indicating either autoregulation of Hifα transcripts or additional mTORC1-dependent inputs into their regulation. Our data regarding the mTORC1-driven activation of SREBP1, on the other hand, suggests that transcriptional and translational control have only minor effects and that the induction involves a specific increase in the processed active form of SREBP1. This finding is consistent with that of a recent study on cells overexpressing myr-Akt (Porstmann et al., 2008). While we find a modest, but reproducible, increase in the full-length inactive form of SREBP1 in TSC-deficient cells, this appears to reflect transcriptional autoregulation. Importantly, mTORC1 signaling does not alter the stability of active SREBP1, suggesting that this regulation is at the level of SREBP1 processing. This is also supported by our finding that exogenous expression of the processed form of SREBP1 renders its gene targets resistant to rapamycin. Our data indicate that S6K1 is required for the mTORC1-driven increase in processed SREBP1 and downstream activation of its transcriptional targets. Therefore, S6K1 promotes the processing of SREBP1 through an, as yet, unknown molecular mechanism.
In addition to enhancing the de novo synthesis of lipids through SREBP-dependent induction of the relevant enzymes, our studies demonstrate that mTORC1 activity is sufficient to increase metabolic flux through both glycolysis and the oxidative arm of the pentose phosphate pathway. Consistent with previous studies (Hu et al., 2003; Semenza et al., 1994), we find that HIF1α, but not HIF2α, regulates glucose uptake and glycolysis downstream of mTORC1. Interestingly, knockdown of SREBP1 led to an attenuation of the mTORC1-dependent increase in the expression of G6pd, which encodes the rate-limiting enzyme in the oxidative phase of the pentose phosphate pathway. The promoter regions of both the rodent and human genes encoding G6PD contain predicted sterol regulatory elements, and SREBP1 has been shown to be capable of driving transcription from the rat version of this promoter (Amemiya-Kudo et al., 2002). Furthermore, data from Srebp1 transgenic and knockout mice indicate that SREBP1c is involved in the induction of G6pd expression in liver (Liang et al., 2002; Shimano et al., 1999; Shimomura et al., 1998). Therefore, mTORC1 signaling increases flux through the oxidative pentose phosphate pathway, at least in part, through activation of SREBP1. A large amount of NADPH is needed for reducing power during de novo lipid biosynthesis, perhaps explaining the regulation of G6PD by SREBP1. In addition, it is likely that this connection between mTORC1 and the pentose phosphate pathway, leading to the production of NADPH needed for many biosynthetic processes and ribose needed for the synthesis of nucleotides,
contributes to the promotion of anabolic cell growth and proliferation downstream of mTORC1. To this end, knocking down the expression of SREBP1 and SREBP2 has the same effect as rapamycin for blocking the proliferation of Tsc2−/− cells, suggesting an essential role for lipid biosynthesis and, perhaps, the pentose phosphate pathway. mTORC1 activation rarely occurs in isolation, but rather cooperates with many other signaling events to alter cell physiology. There is a growing appreciation that cell intrinsic alterations in nutrient and energy metabolism underlie multiple disease states, including cancer, diabetes, and neurological disorders. mTORC1 has been implicated in all of these pathological conditions and is a key component in a signaling network that regulates metabolism. Together with recent genetic approaches to understand the role of mTORC1 in integrated physiology (Bentzinger et al., 2008; Polak et al., 2008), we are gaining important insights into the contributions of mTORC1 to the metabolic reprogramming of cells in response to the physiological or pathological activation of upstream signaling pathways.
NIH-PA Author Manuscript
NIH-PA Author Manuscript
MATERIALS AND METHODS
Cell culture, constructs, and RNAi
Cell lines were maintained in Dulbecco's Modified Eagle Medium (DMEM) with 4.5 g/L glucose containing 10% fetal bovine serum (FBS) prior to the described experiments in serum-free DMEM. Immortalized littermate-derived pairs of wild-type and null Tsc1 (3T3 immortalized) and Tsc2 (p53−/−) MEFs were provided by Dr. D.J. Kwiatkowski
(Kwiatkowski et al., 2002; Zhang et al., 2003). The stable pools of Tsc2−/− MEFs reconstituted with human TSC2 or empty vector were described previously (Zhang et al., 2006). Previously described pcDNA3-based constructs encoding FLAG-tagged versions of the processed nuclear form of SREBP1a (gift of Dr. T. Osborne (Toth et al., 2004)) and Rheb (Tee et al., 2003) were transfected into HEK293 cells using Lipofectamine 2000 (Invitrogen), according to the manufacturer's protocol. The HA-4E-BP1 constructs and HIF1α-5'UTR bicistronic reporter were gifts of Dr. J. Blenis, and the corresponding methods were described previously (Choo et al., 2008). HeLa cells stably expressing shRNAs targeting firefly luciferase or TSC2 were described elsewhere (Huang et al., 2008). All siRNA-mediated knockdown experiments were carried out with ON-TARGETplus or siGENOME SMARTpool siRNAs (40 nM; Dharmacon). Cells were transfected using Lipofectamine RNAiMAX (Invitrogen), according to the manufacturer's protocol for reverse transfection.
Gene expression array and bioinformatic analyses
MEFs were grown to 70% confluence in 10 cm plates and were serum starved for 24 h in the presence of vehicle (DMSO) for 24 h or rapamycin (20 nM) for 2, 6, 12, or 24 h. All vehicle-treated samples (0 h time points) were plated in triplicate and all rapamycin time course samples were plated in duplicate. For each replicate, expression analysis was
performed by hybridization to an Affymetrix Mouse 430_2 oligonucleotide microarray chip. The complete microarray data set is available at www.ncbi.nlm.nih.gov/geo (accession number GSE21755). Detailed protocols describing this analysis and the subsequent bioinformatic approaches, including GSEA and MotifAde, are provided with the supplemental materials.
Metabolic Assays and Metabolomic profiling
To measure the intracellular levels of metabolites, extracts were prepared and then analyzed using LC-MS. Triplicate 10-cm plates (~70% confluent) were incubated in serum-free medium for 16 h, with a medium change 2 h prior to extraction. For the flux studies, cells were washed once with glucose-free DMEM and then incubated in DMEM containing a 10-mM 1:1 mixture of D-[1,2-13C]-glucose and unlabeled D-glucose for 15 min. Metabolites were extracted on dry ice with 5-mL 80% methanol (−80°C). The extract was dried down under nitrogen and resuspended in 80 μL water just prior to the LC-MS run. Detailed protocols describing this analysis and the measurements glucose uptake, lactate production, and lipid biosynthesis are provided with the supplemental materials
Immunoblotting and mRNA expression analysis
Details provided with the supplemental materials.
Supplementary Material
Refer to Web version on PubMed Central for supplementary material.
NIH-PA Author Manuscript
NIH-PA Author Manuscript
Acknowledgments
We thank Drs. D.J. Kwiatkowski, J. Blenis, M.C. Simon, J. Rutter, and T. Osborne for providing critical reagents and B. Boback for technical assistance. This work was supported in part by a postdoctoral fellowship from the Tuberous Sclerosis Alliance (K.D.), NIH Roadmap training grant T90-DK070078 (J.L.Y.), and NIH grants R01-CA122617 and P01-CA120964 (B.D.M.).
REFERENCES
Amemiya-Kudo M, Shimano H, Hasty AH, Yahagi N, Yoshikawa T, Matsuzaka T, Okazaki H, Tamura Y, Iizuka Y, Ohashi K, et al. Transcriptional activities of nuclear SREBP-1a, -1c, and -2 to different target promoters of lipogenic and cholesterogenic genes. Journal of lipid research. 2002; 43:1220–1235. [PubMed: 12177166]
Avruch J, Hara K, Lin Y, Liu M, Long X, Ortiz-Vega S, Yonezawa K. Insulin and amino-acid regulation of mTOR signaling and kinase activity through the Rheb GTPase. Oncogene. 2006; 25:6361–6372. [PubMed: 17041622]
Bentzinger CF, Romanino K, Cloetta D, Lin S, Mascarenhas JB, Oliveri F, Xia J, Casanova E, Costa CF, Brink M, et al. Skeletal muscle-specific ablation of raptor, but not of rictor, causes metabolic changes and results in muscle dystrophy. Cell Metab. 2008; 8:411–424. [PubMed: 19046572] Brugarolas JB, Vazquez F, Reddy A, Sellers WR, Kaelin WG Jr. TSC2 regulates VEGF through
mTOR-dependent and -independent pathways. Cancer cell. 2003; 4:147–158. [PubMed: 12957289] Choo AY, Yoon SO, Kim SG, Roux PP, Blenis J. Rapamycin differentially inhibits S6Ks and 4E-BP1
to mediate cell-type-specific repression of mRNA translation. Proc Natl Acad Sci U S A. 2008; 105:17414–17419. [PubMed: 18955708]
Crino PB, Nathanson KL, Henske EP. The tuberous sclerosis complex. N Engl J Med. 2006; 355:1345–1356. [PubMed: 17005952]
Dang CV, O'Donnell KA, Zeller KI, Nguyen T, Osthus RC, Li F. The c-Myc target gene network. Seminars in cancer biology. 2006; 16:253–264. [PubMed: 16904903]
Dann SG, Selvaraj A, Thomas G. mTOR Complex1-S6K1 signaling: at the crossroads of obesity, diabetes and cancer. Trends in molecular medicine. 2007; 13:252–259. [PubMed: 17452018] Ehninger D, de Vries PJ, Silva AJ. From mTOR to cognition: molecular and cellular mechanisms of
cognitive impairments in tuberous sclerosis. J Intellect Disabil Res. 2009; 53:838–851. [PubMed: 19694899]
Espenshade PJ, Hughes AL. Regulation of sterol synthesis in eukaryotes. Annual review of genetics. 2007; 41:401–427.
Garcia-Martinez JM, Alessi DR. mTOR complex 2 (mTORC2) controls hydrophobic motif phosphorylation and activation of serum- and glucocorticoid-induced protein kinase 1 (SGK1). Biochem J. 2008; 416:375–385. [PubMed: 18925875]
Gordan JD, Thompson CB, Simon MC. HIF and c-Myc: sibling rivals for control of cancer cell metabolism and proliferation. Cancer cell. 2007; 12:108–113. [PubMed: 17692803]
Grolleau A, Bowman J, Pradet-Balade B, Puravs E, Hanash S, Garcia-Sanz JA, Beretta L. Global and specific translational control by rapamycin in T cells uncovered by microarrays and proteomics. J Biol Chem. 2002; 277:22175–22184. [PubMed: 11943782]
Guertin DA, Sabatini DM. The pharmacology of mTOR inhibition. Science signaling. 2009; 2:pe24. [PubMed: 19383975]
Harrington LS, Findlay GM, Gray A, Tolkacheva T, Wigfield S, Rebholz H, Barnett J, Leslie NR, Cheng S, Shepherd PR, et al. The TSC1–2 tumor suppressor controls insulin-PI3K signaling via regulation of IRS proteins. J Cell Biol. 2004; 166:213–223. [PubMed: 15249583]
Hu CJ, Wang LY, Chodosh LA, Keith B, Simon MC. Differential roles of hypoxia-inducible factor 1alpha (HIF-1alpha) and HIF-2alpha in hypoxic gene regulation. Mol Cell Biol. 2003; 23:9361– 9374. [PubMed: 14645546]
Huang J, Dibble CC, Matsuzaki M, Manning BD. The TSC1–TSC2 complex is required for proper activation of mTOR complex 2. Mol Cell Biol. 2008; 28
Huang J, Manning BD. The TSC1–TSC2 complex: a molecular switchboard controlling cell growth. Biochem J. 2008; 412
NIH-PA Author Manuscript
NIH-PA Author Manuscript
Huang J, Wu S, Wu CL, Manning BD. Signaling events downstream of mammalian target of rapamycin complex 2 are attenuated in cells and tumors deficient for the tuberous sclerosis complex tumor suppressors. Cancer Res. 2009; 69:6107–6114. [PubMed: 19602587] Hudson CC, Liu M, Chiang GG, Otterness DM, Loomis DC, Kaper F, Giaccia AJ, Abraham RT.
Regulation of hypoxia-inducible factor 1alpha expression and function by the mammalian target of rapamycin. Mol Cell Biol. 2002; 22:7004–7014. [PubMed: 12242281]
Jaeschke A, Hartkamp J, Saitoh M, Roworth W, Nobukuni T, Hodges A, Sampson J, Thomas G, Lamb R. Tuberous sclerosis complex tumor suppressor-mediated S6 kinase inhibition by
phosphatidylinositide-3-OH kinase is mTOR independent. J. Cell Biol. 2002; 159:217–224. [PubMed: 12403809]
Jiang X, Kenerson H, Aicher L, Miyaoka R, Eary J, Bissler J, Yeung RS. The tuberous sclerosis complex regulates trafficking of glucose transporters and glucose uptake. Am J Pathol. 2008; 172:1748–1756. [PubMed: 18511518]
Kwiatkowski DJ, Zhang H, Bandura JL, Heiberger KM, Glogauer M, el-Hashemite N, Onda H. A mouse model of TSC1 reveals sex-dependent lethality from liver hemangiomas, and up-regulation of p70S6 kinase activity in TSC1 null cells. Hum. Mol. Genet. 2002; 11:525–534. [PubMed: 11875047]
Laughner E, Taghavi P, Chiles K, Mahon PC, Semenza GL. HER2 (neu) signaling increases the rate of hypoxia-inducible factor 1alpha (HIF-1alpha) synthesis: novel mechanism for HIF-1-mediated vascular endothelial growth factor expression. Mol Cell Biol. 2001; 21:3995–4004. [PubMed: 11359907]
Liang G, Yang J, Horton JD, Hammer RE, Goldstein JL, Brown MS. Diminished hepatic response to fasting/refeeding and liver × receptor agonists in mice with selective deficiency of sterol
regulatory element-binding protein-1c. J Biol Chem. 2002; 277:9520–9528. [PubMed: 11782483] Ma Q, Chirn GW, Szustakowski JD, Bakhtiarova A, Kosinski PA, Kemp D, Nirmala N. Uncovering
mechanisms of transcriptional regulations by systematic mining of cis regulatory elements with gene expression profiles. BioData mining. 2008; 1:4. [PubMed: 18822150]
Ma XM, Blenis J. Molecular mechanisms of mTOR-mediated translational control. Nat Rev Mol Cell Biol. 2009; 10:307–318. [PubMed: 19339977]
Majumder PK, Febbo PG, Bikoff R, Berger R, Xue Q, McMahon LM, Manola J, Brugarolas J, McDonnell TJ, Golub TR, et al. mTOR inhibition reverses Akt-dependent prostate intraepithelial neoplasia through regulation of apoptotic and HIF-1-dependent pathways. Nat Med. 2004; 10:594–601. [PubMed: 15156201]
Manning BD, Tee AR, Logsdon MN, Blenis J, Cantley LC. Identification of the tuberous sclerosis complex-2 tumor suppressor gene product tuberin as a target of the phosphoinositide 3-kinase/Akt pathway. Mol. Cell. 2002; 10:151–162. [PubMed: 12150915]
Menon S, Manning BD. Common corruption of the mTOR signaling network in human tumors. Oncogene. 2009; 27:S43–S51. [PubMed: 19956179]
Mootha VK, Handschin C, Arlow D, Xie X, St Pierre J, Sihag S, Yang W, Altshuler D, Puigserver P, Patterson N, et al. Erralpha and Gabpa/b specify PGC-1alpha-dependent oxidative phosphorylation gene expression that is altered in diabetic muscle. Proc Natl Acad Sci U S A. 2004; 101:6570– 6575. [PubMed: 15100410]
Peng T, Golub TR, Sabatini DM. The immunosuppressant rapamycin mimics a starvation-like signal distinct from amino acid and glucose deprivation. Mol Cell Biol. 2002; 22:5575–5584. [PubMed: 12101249]
Polak P, Cybulski N, Feige JN, Auwerx J, Ruegg MA, Hall MN. Adipose-specific knockout of raptor results in lean mice with enhanced mitochondrial respiration. Cell Metab. 2008; 8:399–410. [PubMed: 19046571]
Porstmann T, Griffiths B, Chung YL, Delpuech O, Griffiths JR, Downward J, Schulze A. PKB/Akt induces transcription of enzymes involved in cholesterol and fatty acid biosynthesis via activation of SREBP. Oncogene. 2005; 24:6465–6481. [PubMed: 16007182]
Porstmann T, Santos CR, Griffiths B, Cully M, Wu M, Leevers S, Griffiths JR, Chung YL, Schulze A. SREBP activity is regulated by mTORC1 and contributes to Akt-dependent cell growth. Cell Metab. 2008; 8:224–236. [PubMed: 18762023]
NIH-PA Author Manuscript
NIH-PA Author Manuscript
Sarbassov DD, Ali SM, Sengupta S, Sheen JH, Hsu PP, Bagley AF, Markhard AL, Sabatini DM. Prolonged rapamycin treatment inhibits mTORC2 assembly and Akt/PKB. Mol Cell. 2006; 22:159–168. [PubMed: 16603397]
Sarbassov DD, Guertin DA, Ali SM, Sabatini DM. Phosphorylation and regulation of Akt/PKB by the rictor-mTOR complex. Science. 2005; 307:1098–1101. [PubMed: 15718470]
Semenza GL. Targeting HIF-1 for cancer therapy. Nature reviews. 2003; 3:721–732.
Semenza GL, Roth PH, Fang HM, Wang GL. Transcriptional regulation of genes encoding glycolytic enzymes by hypoxia-inducible factor 1. J Biol Chem. 1994; 269:23757–23763. [PubMed: 8089148]
Shah OJ, Wang Z, Hunter T. Inappropriate activation of the TSC/Rheb/mTOR/S6K cassette induces IRS1/2 depletion, insulin resistance, and cell survival defects. Curr Biol. 2004; 14:1650–1656. [PubMed: 15380067]
Shimano H, Yahagi N, Amemiya-Kudo M, Hasty AH, Osuga J, Tamura Y, Shionoiri F, Iizuka Y, Ohashi K, Harada K, et al. Sterol regulatory element-binding protein-1 as a key transcription factor for nutritional induction of lipogenic enzyme genes. J Biol Chem. 1999; 274:35832–35839. [PubMed: 10585467]
Shimomura I, Shimano H, Korn BS, Bashmakov Y, Horton JD. Nuclear sterol regulatory element-binding proteins activate genes responsible for the entire program of unsaturated fatty acid biosynthesis in transgenic mouse liver. J Biol Chem. 1998; 273:35299–35306. [PubMed: 9857071] Sundqvist A, Bengoechea-Alonso MT, Ye X, Lukiyanchuk V, Jin J, Harper JW, Ericsson J. Control of
lipid metabolism by phosphorylation-dependent degradation of the SREBP family of transcription factors by SCF(Fbw7). Cell Metab. 2005; 1:379–391. [PubMed: 16054087]
Tee AR, Manning BD, Roux PP, Cantely LC, Blenis J. Tuberous sclerosis complex gene products, tuberin and hamartin, control mTOR signaling by acting as a GTPase-activating protein complex toward Rheb. Curr. Biol. 2003; 13:1259–1268. [PubMed: 12906785]
Thomas GV, Tran C, Mellinghoff IK, Welsbie DS, Chan E, Fueger B, Czernin J, Sawyers CL. Hypoxia-inducible factor determines sensitivity to inhibitors of mTOR in kidney cancer. Nat Med. 2006; 12:122–127. [PubMed: 16341243]
Toth JI, Datta S, Athanikar JN, Freedman LP, Osborne TF. Selective coactivator interactions in gene activation by SREBP-1a and -1c. Mol Cell Biol. 2004; 24:8288–8300. [PubMed: 15340088] Wullschleger S, Loewith R, Hall MN. TOR signaling in growth and metabolism. Cell. 2006; 124:471–
484. [PubMed: 16469695]
Zhang H, Cicchetti G, Onda H, Koon HB, Asrican K, Bajraszewski N, Vazquez F, Carpenter CL, Kwiatkowski DJ. Loss of Tsc1/Tsc2 activates mTOR and disrupts PI3K-Akt signaling through downregulation of PDGFR. J Clin Invest. 2003; 112:1223–1233. [PubMed: 14561707]
Zhang HH, Lipovsky AI, Dibble CC, Sahin M, Manning BD. S6K1 regulates GSK3 under conditions of mTOR-dependent feedback inhibition of Akt. Mol Cell. 2006; 24:185–197. [PubMed: 17052453]
Zhong H, Chiles K, Feldser D, Laughner E, Hanrahan C, Georgescu MM, Simons JW, Semenza GL. Modulation of hypoxia-inducible factor 1alpha expression by the epidermal growth factor/ phosphatidylinositol 3-kinase/PTEN/AKT/FRAP pathway in human prostate cancer cells: implications for tumor angiogenesis and therapeutics. Cancer Res. 2000; 60:1541–1545. [PubMed: 10749120]
NIH-PA Author Manuscript
NIH-PA Author Manuscript
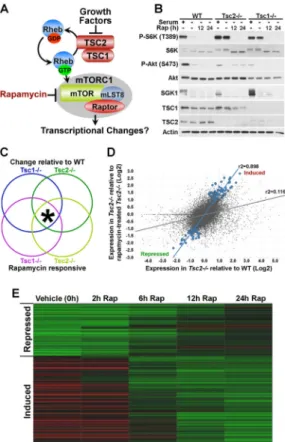
Figure 1. A genomics approach to identify mTORC1-regulated transcripts
A) Model of mTORC1 regulation downstream of growth factors.
B) Growth factor-independent mTOR signaling in Tsc1−/− and Tsc2−/− MEFs. MEF lines were serum starved for 24 h in the presence of vehicle (−) or 20-nM rapamycin (12 or 24 h) and, where indicated, were stimulated with 10% serum for the final 1 h.
C) Hypothetical Venn diagram of the four major changes in gene expression detected in this study. mTORC1-regulated transcripts were classified as those that met all four of these criteria at a statistical cut of p<0.01 (*).
D) Scatter plot of the expression levels (log2) of the 39,000 gene probes comparing
vehicle-treated Tsc2−/− cells to vehicle-treated wild-type controls (x-axis) and vehicle-treated
Tsc2−/− cells to rapamycin-treated (24 h) Tsc2−/− cells (y-axis). The larger blue dots depict the pattern of the 239 gene probes meeting the criteria described in (B). The gray dots depict the expression pattern of the whole dataset.
E) Heat map of the 239 probes found to be regulated by mTORC1 signaling in this study, showing their expression levels and response to a rapamycin time course in Tsc2−/− cells. Expression levels shown are representative of the log2 average obtained from independent
replicates per time point. The brightness of green and red represents the degree to which expression is respectively lower or higher in the Tsc2−/− cells relative to vehicle treated wild-type cells. The gene names and values are provided in supplemental Table S1. (See also heat map for the same genes in Tsc1−/− cells in Figure S1)
NIH-PA Author Manuscript
NIH-PA Author Manuscript
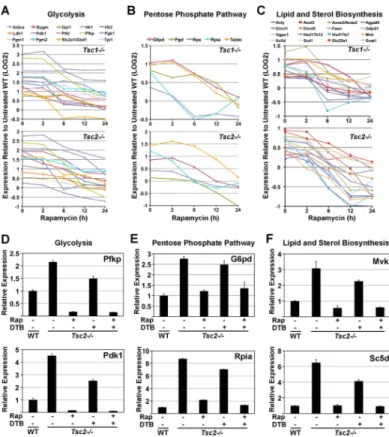
Figure 2. Transcriptional induction of metabolic genes downstream of mTORC1 activation
A–C) mTORC1 activation leads to the induction of genes encoding the enzymes of glycolysis (A), the pentose phosphate pathway (B), and lipid and sterol biosynthesis (C) in
Tsc1−/− (upper graphs) and Tsc2−/− (lower graphs) cells. The log2 expression levels shown
are the average obtained from independent replicates per time point of rapamycin treatment normalized to the expression levels in vehicle-treated wild-type cells. Values provided as supplemental Table S3.
D–F) Confirmation of mTORC1-induced metabolic genes. The expression levels of representative genes from (D) glycolysis, (E) the pentose phosphate pathway, and (F) lipid and sterol biosynthesis was measured by qRT-PCR. MEFs were serum starved for 18 h in the presence of vehicle (−) or 20-nM rapamycin (+) and, where indicated, were subjected to a proliferation arrest via double thymidine block (DTB). Expression levels are presented as mean±SD relative to vehicle-treated Tsc2+/+ cells and are representative of at least three independent experiments. (See supporting data in Figure S2)
NIH-PA Author Manuscript
NIH-PA Author Manuscript
Figure 3. Alterations in cellular metabolism induced by mTORC1 activation
A) Placement of the mTORC1-induced metabolic genes within their metabolic pathways. Genes found to be regulated by mTORC1 are shown in red, with those in the most stringent set indicated (*).
B) mTORC1 signaling stimulates glucose uptake. MEFs were serum starved for 16 hours in the presence of vehicle or rapamycin (20 nM). Glucose uptake was measured as the incorporation of 2-deoxy-D-[3H]-glucose over 4 minutes and normalized to cell number. Levels are presented as mean±SD relative to Tsc2+/+ cells from four independent experiments. *p<0.002 versus Tsc2+/+; **p<0.009 versus Tsc2−/−.
C) mTORC1 signaling increases lactate production. Cells were grown as in (B), and lactate secretion into the media was measured over the final hour. Lactate concentrations
normalized to cell number are presented as mean±SD relative to Tsc2+/+ cells from three independent experiments. *p<0.00001 versus Tsc2+/+; **p<0.006 versus Tsc2−/−.
D) mTORC1 signaling stimulates de novo lipid biosynthesis. MEFs were serum starved for 24 h in the presence of vehicle or rapamycin (20 nM) and were incubated with D-[6-14 C]-glucose for the final 4 h. 14C incorporation into the lipid fraction was measured and is presented as mean±SD relative to Tsc2+/+ cells. These data are representative of three independent experiments. *p<0.006 versus Tsc2+/+; **p<0.004 versus Tsc2−/−.
E) Metabolomic profiling demonstrates that mTORC1 activation increases metabolites of glycolysis and the pentose phosphate pathway. MEFs were grown as in (B) and metabolites were extracted and profiled by LC-MS. Relative levels of specific metabolites, normalized to cell number, from three independent samples for each cell line and treatment are shown in the heat map. Metabolites showing a pattern consistent with mTORC1 regulation are indicated (*). The complete metabolomic profile is provided as supplemental Figure S3 and Table S4.
F) mTORC1 signaling increases flux through glycolysis. MEFs were grown as in (B) and incubated with [1,2-13C]-glucose for 15 min prior to metabolite extraction and LC-MS
NIH-PA Author Manuscript
NIH-PA Author Manuscript
analysis. Levels of dually 13C-labeled glycolytic intermediates, normalized to cell number, are presented as mean±SD over three independent samples.
G) mTORC1 signaling increases flux through the oxidative branch of the pentose phosphate pathway. The ratio of singly (1×) and doubly (2×) 13C-labeled to unlabeled (12C) pentose phosphate pathway metabolites were measured by LC-MS in the samples from (F). P-values for pair-wise comparisons in (F) and (G) are listed in the accompanying table.
NIH-PA Author Manuscript
NIH-PA Author Manuscript
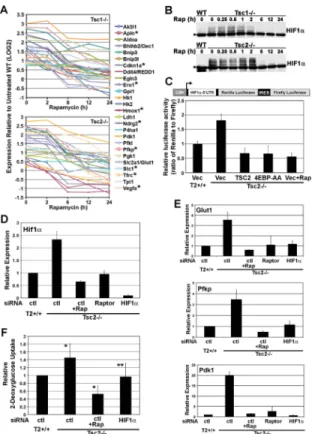
Figure 4. HIF1α and its target genes are upregulated by mTORC1 signaling
A) HIF1 target genes are elevated and rapamycin sensitive in Tsc1 (upper graph) and Tsc2 (lower graph) null cells. The log2 expression levels shown are the average obtained from
independent replicates per time point of rapamycin treatment normalized to the expression levels in vehicle-treated wild-type cells, with those in the most stringent set indicated (*). (Values provided in supplemental Table S3).
B) HIF1α protein levels are shown in wild-type and either Tsc1 or Tsc2 null MEFs grown in serum-free media and subjected to a time course of rapamycin (20 nM). *non-specific band. (See also Figures S4A–C)
C) Induction of translation from the 5'-UTR of HIF1α is regulated by 4E-BP1. The bicistronic reporter was cotransfected with empty vector (Vec), TSC2, or 4E-BP1-AA (T37A/T46A). 24 h post-transfection, cells were serum starved for 16 h in the presence or absence of rapamycin (Rap, 20 nM), and the ratio of Renilla to firefly luciferase was measured. The ratios are presented as mean±SD relative to Tsc2+/+ cells and are representative of three independent experiments. (See also Figures S4D–F)
D, E) mTORC1-dependent increase in the expression Hif1α (D) and its glycolytic gene targets (E). MEFs were transfected with siRNAs targeting the indicated transcripts or control non-targeting siRNAs (ctl). 32 h post-transfection, the cells were serum starved for 16 hours in the presence or absence of rapamycin (Rap, 20 nM). Transcript levels, measured by qRT-PCR, are presented as the mean±SD relative to levels in Tsc2+/+ (Ctl) cells over three independent experiments. (See also Figure S4G)
F) The stimulation of glucose uptake downstream of mTORC1 is dependent on HIF1α. MEFs were transfected with siRNAs and treated as in (D). Glucose uptake was measured as the incorporation of 2-deoxy-D-[3H]-glucose over 4 min and normalized to cell number. Levels are presented as mean±SD relative to Tsc2+/+ (Ctl) cells over six independent experiments. *p<0.003 for Tsc2+/+ versus Tsc2−/− and Tsc2−/− versus rapamycin-treated
Tsc2−/−; **p<0.03 for Tsc2−/− versus Tsc2−/− with Hif1α knockdown.
NIH-PA Author Manuscript
NIH-PA Author Manuscript
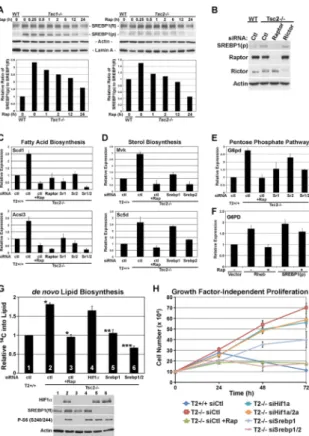
Figure 5. mTORC1 signaling activates SREBP1 to induce de novo lipid biosynthesis and growth factor-independent proliferation
A) Levels of full length (fl) and processed (p) SREBP1 are shown from littermate-derived pairs of wild-type and either Tsc1 or Tsc2 null MEFs grown in serum-free media and subjected to a time course of rapamycin (20 nM). (Below) The ratio of processed to full length SREBP1 at the indicated time points was quantified and plotted relative to untreated wild-type cells.
B) MEFs were transfected with control non-targeting siRNAs (ctl) or siRNAs targeting
Raptor or Rictor, and 48 h post-transfection, cells were serum starved for 24 hours.
C, D, E) The mTORC1-induced expression of genes involved in fatty acid (C) and sterol (D) biosynthesis and the pentose phosphate pathway (E) is dependent on SREBP. MEFs were transfected with control non-targeting siRNAs (ctl) or siRNAs targeting Raptor, Srebp1 (Sr1), Srebp2 (Sr2), or both (Sr1/2). 32 h post-transfection, cells were serum starved for 16 h in the presence or absence of rapamycin (Rap, 20 nM). The expression levels of
representative genes were measured by qRT-PCR and are presented as the mean±SD relative to levels in Tsc2+/+ cells over three independent experiments. (See also Figures S5A and B)
F) Overexpression of Rheb or the processed form of SREBP1a induces G6PD expression. HEK-293 cells were transiently transfected with empty vector (Vec), FLAG-RHEB, or FLAG-processed SREBP1a. 24 h post-transfection, cells were serum starved for 16 h in the presence of vehicle or rapamycin (20 nM). G6PD mRNA levels, measured by qRT-PCR, are presented as the mean±SD relative to levels in vector-transfected cells over three
independent experiments. (See also Figures S5C and D)
G) The stimulation of de novo lipid biosynthesis downstream of mTORC1 is dependent on SREBP. MEFs were transfected with siRNAs targeting the indicated transcripts or control non-targeting siRNAs (ctl). 24 h post-transfection, cells were serum starved for 24 h in the presence of vehicle or rapamycin (20 nM) and were incubated with D-[6-14C]-glucose for the final 4 h. 14C incorporation into the lipid fraction was measured and is presented as
NIH-PA Author Manuscript
NIH-PA Author Manuscript
mean±SD relative to Tsc2+/+ (Ctl) cells. These data are representative of three independent experiments. *p<0.004 for Tsc2+/+ versus Tsc2−/− and Tsc2−/− versus rapamycin-treated
Tsc2−/−; **p<0.008 versus Tsc2−/− (ctl); ***p<0.002 versus Tsc2−/− (ctl). A control immunoblot is provided with numbering matching the samples from the graph. (See also Figure S5E)
H) The mTORC1-driven proliferation of Tsc2 null cells in the absence of growth factors is dependent on SREBP. Tsc2+/+ (T2+/+) and Tsc2−/− (T2−/−) MEFs were transfected with siRNAs targeting indicated genes or non-targeting control siRNAs (siCtl). 24 h post-transfection, 1×10⁵ cells per well were re-seeded and grown in serum-free medium in the presence of vehicle or rapamycin (20 nM, Rap), with daily medium changes. Triplicate samples were counted every 24 h, and the mean cell numbers ±SD for a representative experiment are shown. (See also Figure S5F)
NIH-PA Author Manuscript
NIH-PA Author Manuscript
Figure 6. mTORC1 regulates SREBP1 through S6K1 but independent of GSK3 and effects on proteasomal degradation
A) The inhibitory effects of rapamycin on processed SREBP1 (SREBP1(p)) are independent of proteasomal degradation. MEFs were serum starved for 24 h in the presence of vehicle or 20-nM rapamcyin (12 or 24 h) and, where indicated, were treated with ALLN (25 μg/mL) for the final 1 h. Light and dark exposures of the same blot of SREBP1(p) are shown. B) Involvement of S6K1, but not GSK3, in the mTORC1-dependent effects on SREBP1. MEFs were transfected with siRNAs targeting the indicated transcripts or control non-targeting siRNAs (ctl). 24 h post-transfection, cells were treated as in (A) with ALLN. C) S6K1 regulates expression of SREBP1 target genes. MEFs were transfected with the indicated siRNAs, and 32 h post-transfection, cells were serum starved for 16 h in the presence or absence of rapamycin (Rap, 20 nM). Transcript levels were measured by qRT-PCR and are presented as the mean±SD relative to levels in Tsc2+/+ (Ctl) cells over three independent experiments.
D) S6K1 contributes to stimulation of de novo lipid biosynthesis downstream of mTORC1. Cells were transfected with the indicated siRNAs and serum starved for 24 h. For the final 4 h, cells were labeled with D-[6-14C]-glucose. 14C incorporation into the lipid fraction was measured and is presented as mean±SD relative to Tsc2+/+ (Ctl) cells. *p<0.003 versus WT; **p<0.03 versus Tsc2−/− (ctl).
E) Model of the control of specific metabolic pathways downstream of mTORC1. See text for details.
NIH-PA Author Manuscript
NIH-PA Author Manuscript
NIH-PA Author Manuscript
NIH-PA Author Manuscript
NIH-PA Author Manuscript
Table 1
Enrichment of transcription factor binding elements in the promoters of mTORC1-induced genes.a
Transcription Factor Binding Motif Rap-Sensitive Probes (Total)c p-valued q-valuee
SREBP VNNVTCACCCYA 33 (82) 2.41E-07 1.28E-05
c-Myc (HIF1)b RACCACGTGCTC 385 (1164) 4.52E-06 1.45E-04
HNF4alpha VTGAACTTTGMMB 853 (2084) 2.17E-05 4.34E-04
ATF4 CVTGACGYMABG 18 (30) 5.57E-04 6.36E-03
a
Over-represented transcription factor-binding motifs in all rapamycin-sensitive genes from both Tsc1−/− and Tsc2−/− MEFs identified using a modified version of the MotifADE method (Mootha et al. 2004; Ma et al. 2008). Only these 4 motifs were in enriched in both cell lines with a q-value<0.01. Numbers for the Tsc2 null cells are provided.
b
The HIF1-binding hypoxia response element (bold) overlaps with this motif.
c
Numbers are based on 39,000 gene probes analyzed in triplicate with Affymetrix microarrays, comparing vehicle-treated versus rapamycin-treated (24 h) Tsc2−/− MEFs.
d
Two-tailed Mann-Whitney rank sum p-value.
e