Achieving Sustainable Growth at Uber Freight By
Elizabeth Shree Raman Grubbs
Bachelor of Science, Business Administration, Georgia Institute of Technology, 2017
Sadia Rahman Shathi
Bachelor of Science, Industrial & Production Engineering, Bangladesh University of Engineering & Technology, 2009
SUBMITTED TO THE PROGRAM IN SUPPLY CHAIN MANAGEMENT IN PARTIAL FULFILLMENT OF THE REQUIREMENTS FOR THE DEGREE OF
MASTER OF APPLIED SCIENCE IN SUPPLY CHAIN MANAGEMENT AT THE
MASSACHUSETTS INSTITUTE OF TECHNOLOGY MAY 2020
© 2020 Elizabeth Raman Grubbs and Sadia Rahman Shathi. All rights reserved.
The authors hereby grant to MIT permission to reproduce and to distribute publicly paper and electronic copies of this capstone document in whole or in part in any medium now known or hereafter created.
Signature of Author………... Elizabeth Shree Raman Grubbs Department of Supply Chain Management May 8, 2020 Signature of Author………...…
Sadia Rahman Shathi
Department of Supply Chain Management
May 8, 2020 Certified by... Dr. Josué C. Velázquez-Martínez Executive Director, Master of Supply Chain Management Capstone Advisor Certified by...
Suzanne Greene Program Manager, Sustainable Supply Chains
Capstone Co-Advisor Accepted by...
Dr. Yossi Sheffi Director, Center for Transportation and Logistics Elisha Gray II Professor of Engineering Systems Professor, Civil and Environmental Engineering
2
Achieving Sustainable Growth for Uber Freight
by
Elizabeth Shree Raman Grubbs and
Sadia Rahman Shathi
Submitted to the Program in Supply Chain Management on May 8, 2020 in Partial Fulfillment of the Requirements for the Degree of Master of Applied Science in Supply Chain Management
ABSTRACT
The freight industry creates 8% of the world’s greenhouse gas emissions through shipping. If companies measure precisely, they can begin the benchmarking process toward improvement. The Global Logistics Emission Council (GLEC) provides a current consolidated Framework for calculating carbon emissions for freight transportation. Uber Freight, a third party software platform based trucking logistics service provider, requested a process to calculate and reduce their carbon emissions. After creating a calculation and forecast for carbon emissions, we complete an in-depth analysis of key lanes and activities to target for improvement. For long-term reduction, we present a projection of emissions through 2050 based on current activities, along with a Science Based Target that Uber Freight can use to set a climate goal. We provide Uber Freight with a strategy and method for measuring, tracking, and reducing their overall company environmental footprint along with the tools to enhance the environmental footprints of their shipper and carrier partners. For future accuracy improvement, Uber Freight can collect data on carriers’ specific CO2e per tkm and equipment type to avoid using general factors.
Capstone Advisor: Dr. Josué C. Velázquez Martínez Executive Director, Master of Supply Chain Management
Capstone Co- Advisor: Suzanne Greene Program Manager, Sustainable Supply Chains
3
Acknowledgements
We would like to thank our capstone advisor and mentor, Dr. Josué C. Velázquez Martínez, for his guidance and support throughout this capstone project. We would also like to thank our co-advisor and the founder of the GLEC Framework, Suzanne Greene, for her direction and recommendations during this capstone. Both Josué and Suzanne taught us so much about the best practices in sustainable supply chains. We would like to thank Pamela Siska and Toby Gooley, who were very helpful in proof reading, structuring, and editing our writing.
We would like to thank our sponsor company, Uber Freight, for their support in providing data and information about the company’s partnership with carriers and shippers as a third-party logistics service provider. Thank you Harris Ligon, Mita Hendra Mukti, and Sabrina Lin for your partnership and guidance from Uber Freight.
Special thanks to SCM class of 2020- who were always there for us.
Finally, we would like to thank our spouses, parents, and families for their support and encouragement throughout the completion of our master’s program. Thank you.
4
Table of Contents
List of Equations ... 5
List of Figures ... 6
List of Tables ... 7
1. Introduction ... 8
1.1 Motivation ... 8
1.2 United States Transportation Industry ... 9
1.3 Uber Freight’s Business ...10
2. Literature Review ...13
2.1 Estimation of Transport Greenhouse Gases ...13
2.2 Step 1: CO
2e Emission Calculation Model ...15
2.3 Step 2: Forecasting Methods ...22
2.4 Step 3: Science-Based Target ...23
2.5 Summary ...24
3. Methodology ...25
3.1 Calculating Emissions ...26
3.2 Forecasting Emissions ...28
3.3 Science-Based Target Calculation ...28
3.4 Methodology Summary ...31
4. Results and Discussion ...32
4.1 2018-2019 Emissions and 2020 Forecast ...32
4.2 Uber Freight’s Science-Based Emissions Target ...35
4.3 Uber Freight Location Insights ...37
4.4 Uber Freight Lane Insights ...38
5.0 Conclusion ...42
References ...44
5
List of Equations
Equation 1 : Freight transport activity calculation …………...……… 19
Equation 2 : Emissions calculation for Scope 3 .……….. 19
6
List of Figures
Figure 1: Uber Freight’s Mobile Application Illustration ………. 11
Figure 2: Overview of GHGs emissions in 2018 ..……… 14
Figure 3: Total US GHG emissions by economic sector in 2018 ……… 14
Figure 4: Full fuel life cycle for carbon accounting ……….. 16
Figure 5: Scopes for emissions calculation ………... 17
Figure 6: Brief illustration of methodology ………25
Figure 7: Decision tree for selecting emissions intensity factor ……… 28
Figure 8: Required data to use SBT model ……… 30
Figure 9: Uber Freight’s 2018-2019 and 2020 Forecasted Tonnes CO
2…………
33
Figure 10: Average emissions intensity factor for UF: 2018-2019 ……… 34
Figure 11 : Uber Freight’s Emission Forecast 2020-2050 ………. 34
Figure 12: Science Based Emissions Target ……….. 36
Figure 13: Uber Freight’s 2018-2019 Kg CO
2e by Origin ……… 37
Figure 14: Uber Freight’s 2018-2019 Kg CO
2e by Destination ……… 38
Figure 15: Uber Freight’s Top 5 Lanes by Emissions (Ton CO
2e) ……… 39
Figure 16: Emissions Reduction from Top Lanes with Low Utilization ………… 40
7
List of Tables
Table 1: EPA CO
2factor based on different Vehicle Types ………. 20
Table 2: DEFRA emission factors ...………... 21
Table 3 GLEC CO
2Emissions Calculation Factors ……… 27
Table 4: Transport pathways for SBT ………... 29
8
1. Introduction
In this capstone, we illustrate the importance of calculating, forecasting, and tracking greenhouse gas (GHG) emissions in the private sector to mitigate the effect of global climate change. We develop a thorough methodology for Uber Freight (UF), a third-party logistics service provider, and complete an analysis of the levers driving their growth in emissions. We provide UF with tools and methods to track and decrease their emissions.
1.1 Motivation
Although stringent government restrictions for GHG emissions have been rolling out slowly, the private sector has begun to take action to reduce their emissions. Companies across diverse industries, including consumer goods, oil and gas, electronics, and automotive sectors, are prioritizing emission reduction to prevent climate change (Claire Underwood, 2019). For instance, 35 companies joined the Center for Climate and Energy Solutions’ Business Environmental Leadership Council to establish GHG reduction strategies in their businesses to mitigate climate change (Business Environmental Leadership Council, 2019). By taking these steps, companies can proactively prepare for government regulations and act responsibly towards driving environmental sustainability.
These companies will be the leaders in their industries when the economy shifts to prioritizing emission mitigation. Additionally, consumers’ inclination to support companies with initiatives that better the world is growing. For example, Patagonia, the immensely popular consumer clothing brand, hosts a mission statement of “We’re in the business to save our home planet” (Patagonia Outdoor Clothing & Gear, 2020). The company actively demonstrates this mission; in 2016, Patagonia pledged to donate Black Friday sales to smaller environmental
9 organizations. Consumer demand increased immediately. The company added 24,000 new customers and completed $10M in sales that day ((Beer & Beer, 2018). Being associated with the mission of saving the planet creates a meaningful brand association and delights consumers. The example cited for Patagonia above hence shows that sustainable business agenda results in greater demand for the company’s products.
With increasing globalization and customer demand, there is a need to transport goods to customers quickly. The trucking logistics industry has grown to meet the increased consumer demand. As a consequence, transportation is the third largest source of GHG emissions at 8% (International Transport Forum, 2019). According to the United States Environmental Protection Agency, “In 2015, the U.S. logistics industry moved more than 49.5 million tons of goods worth nearly $52.7 billion every day, which is more than 56 tons of freight per person per year (US EPA, 2016b).” Being a third party freight service provider, UF is concerned about calculating and forecasting its GHG emissions to limit environmental impact.
1.2 United States Transportation Industry
Increased growth in the global economy creates a greater need for the transportation of goods to consumers, including movement of product by air, rail, sea, and road. The U.S. economy is growing at a rapid pace, resulting in a quickly expanding logistics industry, working to deliver large volumes of both brick- and- mortar and ecommerce consumer orders. According to the Council of Supply Chain Management Professionals’ Annual State of Logistics Report’s comparison between 2018 and 2019, “The United States Business Logistics Cost (USBLC) rose 11.4 percent to reach $1.64 trillion, or 8.0 percent of 2018’s $20.5 trillion GDP” (Ward, Zimmerman, Oca, Sonthalia, Acar, Sun, 2019).
10 With a market size of $800B, the trucking logistics industry is capturing additional profits each year by transporting more goods to fulfill orders across the United States (Ward et al., 2019).With additional trucks delivering loads across the country, carbon emissions are rapidly increasing and negatively impacting the environment. Logistics emissions are on track to double by 2050 at the current rate; therefore, huge environmental footprint savings can be captured from managing the trucking industry efficiently (International Transport Forum, 2019).
1.3 Uber Freight’s Business
Though three-quarters of freight is shipped by sea, road is by far the dominant source of global logistics emissions, with over 1,700 million tons of CO2 emitted in 2015, which creates 62% of the total freight emissions (International Transport Forum, 2019). Reducing trucking emissions will result in a large decrease in the carbon footprint and set an example for the rest of the freight industry.
Uber Freight is a third party freight logistics firm with a software platform that connects carriers and shippers for load movement across the United States and parts of Europe. Figure 1.0 illustrates the application that connects drivers with available loads, sourced by UF’s connection to shippers (Uber Freight, 2019). As consumers’ demand for both a cleaner environment and faster delivery increase, shippers are looking for freight service providers to partner with in meeting these end-customer needs. Calculating emissions through a standardized process is the first step in tracking and reducing emissions. Decreasing environmental impact not only drives sustainability agenda for companies but also offers value for the consumers and enhances supply chain efficiency through delivery optimization.
11 Figure 1: Uber Freight’s Mobile Application Illustration Reprinted from
https://www.uber.com/us/en/freight/. Retrieved April 20, 2020. Reprinted with permission. Uber Freight currently does not have a science- based system to calculate or track its emissions at an aggregate level. The company does work with SmartWay currently. SmartWay, founded by the United States Environmental Protection Agency, is a neutral third-party between shippers and their freight partners (US EPA, 2016a). It allows freight providers to anonymously report and track fuel usage without giving up proprietary data. Because of the unique focus on small to medium carriers, around 90% of UF’s carriers are not SmartWay partners, resulting in less specific data for emission intensity factors. Emission intensity factors can be defined as “the amount of fuel or CO2e used to move a certain amount of cargo for a certain distance typically calculated over a period of one year” (Greene & Lewis, 2019).
Taking advantage of these levers will enable Uber Freight to act as a model in the freight industry. By tracking emissions each year, UF can manage and mitigate their carbon footprint with scientifically well-defined vision. The company can also pass on learnings and provide tools to enhance the environmental footprint of their shippers, carriers, and the shippers’ end-customers.
12 Growth in the logistics sector does not automatically result in a growth in GHG emissions. Innovation in maximizing shipping efficiency can mitigate growth in emissions (Yossi Sheffi, 2018). Understanding the factors that can incrementally increase emissions will allow UF to actively reduce emissions. We use Science- Based Target guidance built by the Sector Decarbonization Approach to set a climate goal for UF based on its growth forecast for 30 years to help keep the global temperature rise below 2 degree Celsius.
1.4 Summary
In this capstone, we present a need for Uber Freight to understand their emissions amount as well as the drivers of their emissions. The remainder of the capstone is organized as follows: In Chapter 2, we discuss the different methodologies that can be used to calculate emissions. In Chapter 3, we explain our methodology used to develop a model to calculate and predict CO2 emissions, using UF’s demand forecast and available infrastructure. Chapter 4 explores the results of the emission calculation and forecast for 2020. We explore an in-depth analysis of key lanes to illustrate reduction methodologies and a Science- Based Target to prevent the 2020 forecast projections from occurring. Chapter 5 concludes the capstone with a project summary and recommendations for UF to track and reduce its carbon footprint.
13
2. Literature Review
As the project scope depicts in section 1.3, the first objective was to estimate emissions for Uber Freight. In order to identify and develop the right model for this third-party logistics company, we evaluated different emissions protocols to define emission particles and the most relevant guidance for the calculation. The next task was to decide on the right forecasting method which was aligned with UF’s growth agenda and business model. Finally, to provide visions for emissions control while the business grows, we looked for different global guidance to set a scientific transport related emissions target for the company.
2.1 Estimation of Transport Greenhouse Gases
All fuel-based vehicles burn fossil fuels, such as gasoline or diesel, which release different types of green- house gases (GHG) in the atmosphere. While the biggest GHG emission is carbon dioxide (CO2)gas, fossil fuel combustion also produces methane (CH4) and nitrous oxide (N2O). Also there are emissions of fluorinated gases, i.e., hydrofluorocarbon (HFC), sulfur hexafluoride (SF6) and other refrigerant gases from temperature- controlled vehicles. However, to avoid confusion over different particles and having multiple measures, globally one standard unit for GHG emission is used, which is the ‘CO2 equivalent (CO2e)’ unit of measure. Figure 2 shows contribution of different GHG:
14 Figure 2: Overview of GHG emissions in 2018 Reprinted from National Emissions in
Greenhouse Gas Emissions, n.d., Retrieved April 20, 2020 from
https://guides.himmelfarb.gwu.edu/c.php?g=27779&p=170358. Reprinted with permission. The largest contribution to CO2 and GHGs in the US is from transport sector. As of 2018, the EPA about 33.6% of total CO2 emissions and 27.3% of total GHGs emissions of USA was from the combustion of fossil fuels by the transport industry; this includes passenger and commercial vehicles, air, ocean and rail transportation. Figure 3 depicts the sources of contributions to CO2 emissions of USA in 2018:
Figure 3: US GHG emissions by economic sector, 2018. Reprinted from National Emissions in Greenhouse Gas Emissions, n.d., Retrieved April 20, 2020 from
https://guides.himmelfarb.gwu.edu/c.php?g=27779&p=170358. Reprinted with permission. Corbon Dioxide, 81% Methane, 10% Nitrous
Oxide, 7% Fluorinated gases, 3%
Transportatio n, 34% Electricity, 32% Industry , 15% Residential & Commercial, 11%
Other (non-fossil fuel combustion), 8%
15 The Environmental Protection Agency (EPA) provides further clarification for selecting CO2e as the standard unit of measure. The effect of each GHG on the environment depends on the amount or concentration in the environment, how long it can remain in the environment and the relative impact on global warming. CO2e measures how much global warming a GHG may cause using the equivalent concentration of CO2 (Bisshop, Andrew, Rickards, Lauren, 2015), thus CO2e is used as the standard unit of measure for GHG emissions.
Our research focuses on a model to calculate GHG emission from freight movements in Kg (or Tonnes) CO2 equivalent units for UF. Henceforth all the emissions mentioned in this paper refers to CO2e, unless stated otherwise.
2.2 Step 1: CO
2e Emission Calculation Model
Different organizations across several countries conducted research to develop carbon accounting methods; some of these focus on the CO2e emission factor while others emphasize fuel efficiency. Depending on the available information, mode of transportation, geographical impact, and data accuracy, a model can be used to derive total CO2 emission. From the available dataset of UF, we built an activity-based model to estimate emissions. An activity-based model calculates emissions by measuring distance travelled and load carried by the vehicle and using vehicle- specific carbon intensity factor.
We hypothesized that the Global Logistics Emissions Council (GLEC) Framework would best serve UF's challenge to calculate emissions since this is globally the most widely accepted activity-based model. However, we reviewed some other frameworks to further strengthen our hypothesis. Other frameworks that we reviewed include the U.S. Environmental Protection Agency (EPA), Network for Transport Measures (NTM), and Department for Environment Food & Rural Affairs (DEFRA).
16
2.2.1 Activity- Based Calculation
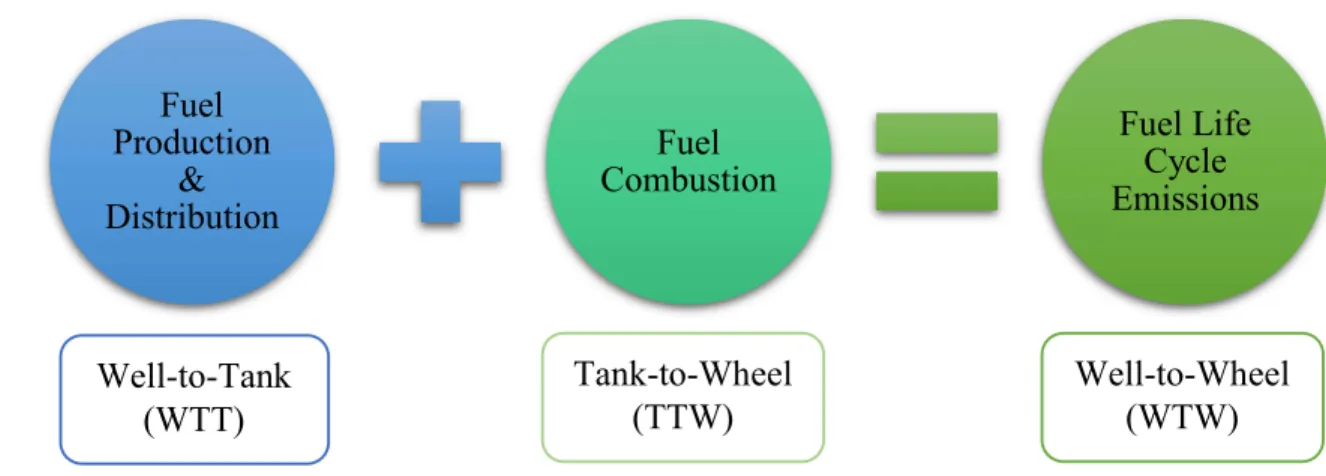
The GHG Protocol establishes a comprehensive, standardized framework for measuring emissions from different operations across the value chain, products and cities. The GHG Protocol mandates the inclusion of emissions from the entire fuel life cycle in order to capture the full impact of GHG on the environment. Emissions from the full fuel life cycle, termed Well to Wheel (WTW), comprise two processes : Well to Tank (WTT) and Tank to Wheel (TTW). The GLEC Framework has defined the steps as: “WTT emissions consist of all processes between the source of the energy (the well) through the energy extraction, processing, storage and delivery phases up until the point of use (the tank)…TTW are the emissions from fuels combusted to power Scope 1 activities (the wheel)” (Greene & Lewis, 2019). WTW is equivalent to the sum of WTT and TTW emissions.
Figure 4 shows the full fuel life cycle:
Figure 4 : Full fuel life cycle for carbon accounting
As we have defined fuel life cycle analysis above, in the following sections of this chapter we have focused on different activity-based models for emissions estimation and the impact of fuel life cycle on various activities.
Fuel Production & Distribution Fuel Combustion Fuel Life Cycle Emissions Well-to-Tank (WTT) Tank-to-Wheel (TTW) Well-to-Wheel (WTW)
17 Global Logistics Emissions Council (GLEC) Framework
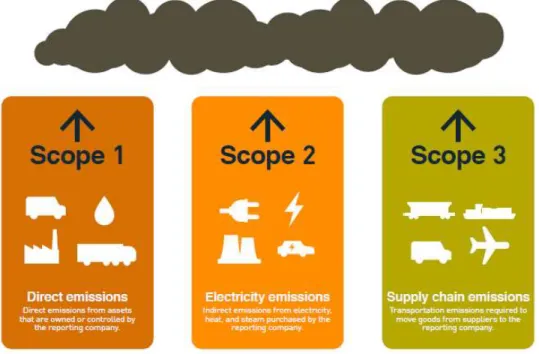
The Smart Freight Centre, created in 2013, works with the goal of unifying organizations in meeting the Paris Climate Agreement targets. The Smart Freight Centre created the Global Logistics Emissions Council Framework, “the only globally recognized methodology for harmonized calculation and reporting of the logistics GHG footprint across the multi-modal supply chain” (Greene & Lewis, 2016). GLEC Framework hosts three Scopes for calculating emissions including:
Scope 1: direct emissions from assets owned or controlled by the reporting company Scope 2: indirect emissions from the production and distribution of electricity Scope 3: indirect emissions from the reporting company’s supply chain
Figure 5 shows different Scopes of carbon accounting established by the GHG Protocol.
Figure 5: Scopes for emissions calculation. Reprinted from Global Logistics Emissions Council Framework for Logistics Emissions Accounting and Reporting Version 2.0 (p. 16) by S.
18 For fuel emissions accounting, TTW emissions from direct assets and operations are reported under Scope 1 and associated WTT emissions are reported under Scope 3. However emissions from fuel burned in subcontracting operation are reported as WTW under Scope 3. Based on UF’s operating model as a third- party logistics service provider, its emissions from freight transportation fall under Scope 3 and therefore it should use WTW emissions.
Scope 3 emissions are the most difficult to capture due to difficulty with data accuracy and accessibility from multiple third party sources, and consistency of information. The GLEC Framework suggests using the weight of the shipment and the distance it was transported to calculate emissions. For weight, the weight of the product including the packaging should be considered. Since this approach always measures emissions based on weight and distance, for high volume-low weight shipments it becomes difficult to evaluate improvement opportunities based on only load utilization (total weight of shipment vs the capacity of the vehicle). In case of distance measurement, the challenge lies in correlating distance with fuel consumption, since sometimes the route can be multi pick-up / multi drop-off, or the route may be changed due to traffic or weather conditions. It is even more complicated to allocate emissions in case of LTL shipments. Hence, the GLEC Framework suggests using the actual distance travelled from odometer reading, or in cases where data unavailability, distance from GPS or planned route can be used.
To streamline and standardize data usage, the GLEC Framework uses tonne-kilometer (tkm) as the metric for freight transport activity. Since emissions are reported annually, freight activity is also measured on an annual basis for all the shipments throughout the year. Equation 1 shows the tonne- kilometer calculation:
19 𝒕𝒌𝒎 𝒏 𝒕𝒓𝒊𝒑 𝟏 = 𝒕𝒐𝒏𝒏𝒆𝒕𝒓𝒊𝒑𝟏∗ 𝒌𝒊𝒍𝒐𝒎𝒆𝒕𝒆𝒓𝒕𝒓𝒊𝒑𝟏+ 𝒕𝒐𝒏𝒏𝒆𝒕𝒓𝒊𝒑𝟐∗ 𝒌𝒊𝒍𝒐𝒎𝒆𝒕𝒆𝒓𝒕𝒓𝒊𝒑𝟐 + ⋯ … … … . . + 𝒕𝒐𝒏𝒏𝒆𝒕𝒓𝒊𝒑𝒏∗ 𝒌𝒊𝒍𝒐𝒎𝒆𝒕𝒆𝒓𝒕𝒓𝒊𝒑𝒏
Equation 1 : Freight transport activity calculation
In cases where shipment-specific weight or distance information is unavailable, average weight or average distance should be used for the closest approximation. For Scope 3 emissions calculation, the GLEC Framework multiplies the freight transportation activity (tkm) by CO2 intensity factor to derive total Kg CO2e (kilogram carbon dioxide equivalent) (Greene & Lewis, 2019). Equation 2 shows the Scope 3 emissions calculation by the GLEC Framework.
𝑲𝒈 𝑪𝑶𝟐𝒆 𝒆𝒎𝒊𝒔𝒔𝒊𝒐𝒏𝒔 = ∑ (𝒘𝒆𝒊𝒈𝒉𝒕 ∗ 𝒅𝒊𝒔𝒕𝒂𝒏𝒄𝒆 (𝒕𝒌𝒎)𝒏𝟏 ∗ 𝑪𝑶𝟐𝒆 𝒊𝒏𝒕𝒆𝒏𝒔𝒊𝒕𝒚 𝒇𝒂𝒄𝒕𝒐𝒓 (𝒌𝒈 𝑪𝑶𝟐𝒆/ 𝒕𝒐𝒏𝒏𝒆 − 𝒌𝒎))
Equation 2 : Emissions calculation for Scope 3
Here, fuel is converted to CO2e and WTW carbon intensity factor is used for all GHGs to align with CO2e unit of measure.
Other Emissions Accounting Framework
Other frameworks for emissions estimations also emphasize on using weight and distance as the metric for freight transport activity.
In 1992, 154 nations including the United States signed and ratified the United Nations Framework Convention on Climate Change. Participating countries in the convention agreed to “develop, periodically update, publish and make available…national inventories of anthropogenic emissions by sources and removals by sinks of all GHGs not controlled by the Montreal Protocol,
20 using comparable methodologies” (US EPA, 2017). The United States uses this report to monitor GHG emissions for home energy, transportation, and waste.
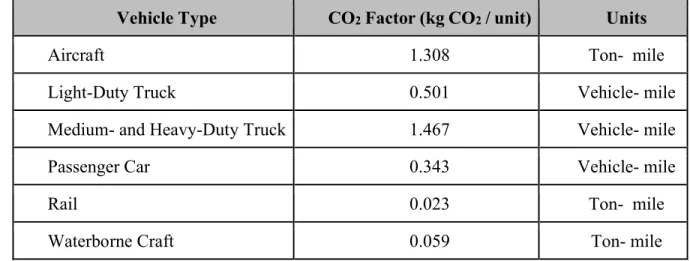
In order to calculate CO2 emissions from transportation, the EPA uses total distance travelled in miles multiplied by total weight carried in tonnes and the CO2 emission factor depends on the vehicle type and load type (full truck load -TL or less than truckload - LTL) (US EPA, 2017).
Table 1 shows CO2 factor used for different vehicle types used by US EPA (Emission-Factors_mar_2018_0.Pdf, March 9, 2018). Vehicle- mile factors are used when the entire vehicle is dedicated to transport the reporting company’s product. Ton- mile is used for shared vehicle.
Table 1: EPA CO2 factor based on different Vehicle Types
Vehicle Type CO2 Factor (kg CO2 / unit) Units
Aircraft 1.308 Ton- mile
Light-Duty Truck 0.501 Vehicle- mile
Medium- and Heavy-Duty Truck 1.467 Vehicle- mile
Passenger Car 0.343 Vehicle- mile
Rail 0.023 Ton- mile
Waterborne Craft 0.059 Ton- mile
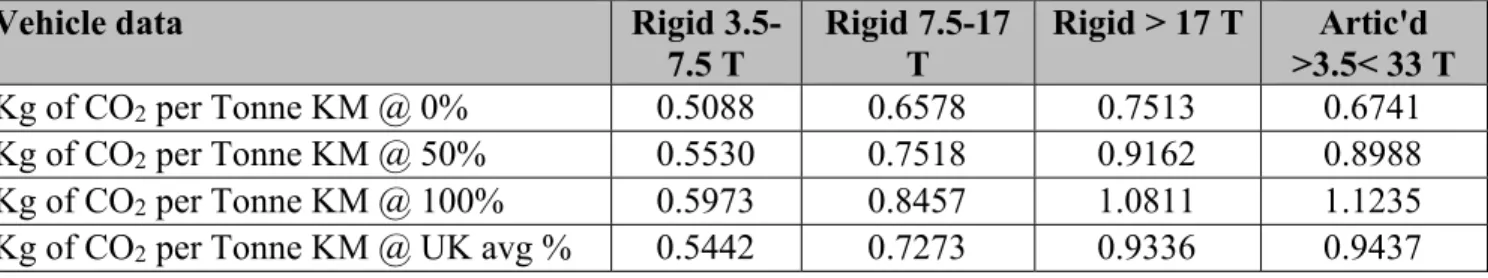
By contrast, the UK-based organization DEFRA (Department for Environment, Food, and Rural Affairs), developed the methodology for calculating GHG emissions from different Scopes of emission, including transportation, manufacturing, passenger vehicles, waste treatment, and energy supply. It uses fuel consumption and effect of load utilization on fuel efficiency to derive CO2 factor based on GHG protocol (Hill, Bramwell, Harris, 2017). In absence of fuel consumption
21 information, it suggests using the distance-specific emission factor for specific vehicle types; distance is multiplied by emission factor for average load utilization if actual load utilization is unknown (Ghg-freight-guide.pdf, 2019.). Table 2 shows different emission factors based on DEFRA guidance for rigid body (straight) trucks and articulated (semi- trailer) trucks.
Table 2: DEFRA emission factors
Vehicle data Rigid
3.5-7.5 T Rigid 7.5-17 T Rigid > 17 T Artic'd >3.5< 33 T Kg of CO2 per Tonne KM @ 0% 0.5088 0.6578 0.7513 0.6741 Kg of CO2 per Tonne KM @ 50% 0.5530 0.7518 0.9162 0.8988 Kg of CO2 per Tonne KM @ 100% 0.5973 0.8457 1.0811 1.1235
Kg of CO2 per Tonne KM @ UK avg % 0.5442 0.7273 0.9336 0.9437
2.2.2 Calculation Summary
Uber Freight’s transportation activities fall under Scope 3 emissions category because it does not own assets like a carrier. As we analyzed different frameworks explained above for emissions calculation, we found that we could not use fuel-based model; rather an activity-based model would be the best fit.
In order to use a fuel-based model, it is important to know the fuel consumption for each load. Since UF is a third-party logistics company which doesn’t own any vehicles, they would need to collect detailed fuel data from their carriers, which was not available for this study. So, we concentrated on activity-based calculation model only.
On the other hand, with Scope 3, all we needed were distance and weight, and suitable CO2 intensity factor. We decided the GLEC Framework would be the best fit, since this is the current global standard for activity-based calculation and advantageous for UF, as all the required information for the model was readily available in the dataset. Moreover, GLEC adopted the
22 Scopes and basic guidelines from US EPA and SmartWay, and further enhanced that with standard emission factors for different vehicle types. Further, the GLEC Framework converts SmartWay and other similar groups. emissions factors to be globally compliant. The GLEC Framework is the method that brings these regional methods together in a harmonized way and will form the basis of the forthcoming ISO 14083 which quantifies and reports GHG emissions from transport operations. Since this is a global method, it can be used for UF’s Europe business and beyond.
2.3 Step 2: Forecasting Methods
To predict CO2 emissions in 2020, UF preferred a straight-line growth forecasting method for overall business at an aggregate level. However, to ensure all the alternate options were explored and the best-fit forecasting model was used, we explored different forecasting methods, including a simple moving average, a simple exponential smoothing, or a seasonality model.
2.3.1 Alternate Forecasting Methods
To provide emissions prediction to UF for 2020 based on the 2019 result, we had to choose forecasting methods depending on the available data and the expected usage of forecast.
Simple Moving Average
Simple moving average forecasting method uses data recent three- or four-month periods information. This would not account for total past information and hence would not serve the purpose to predict 2020 emissions.
Simple Exponential Smoothing
Simple exponential smoothing can be a good approach for stationary demand and decision making with relevant information. In case of UF, the demand is fluctuating and follows a seasonality pattern and hence the method was also not suitable for 2020 prediction.
23 Seasonality Model
Seasonality model considers both flat demand and impacts of seasonality with trend analysis. However, this model requires a minimum of two seasons but preferably four or more. Though this could be an appropriate approach for UF’s emission prediction, due to data limitation, deriving a seasonality factor would be misleading.
Since the prediction is required for CO2 emission, not UF’s business growth, a simple line growth model provides a more relevant approach.
2.4 Step 3: Science-Based Target
Once Uber Freight calculates emissions and identifies levers for carbon footprint for Scope 3 emissions, the next task is to set a vision for emissions pathway. A guideline for setting carbon footprint target with short-term and long-term vision can be developed with Sectoral Decarbonization Approach (SDA) (Luna & Villasana, 2017). SDA is a scientifically informed method for setting corporate emissions reduction target in line with climate science. Under SDA, transport Science-Based Target (SBT) setting guideline provides insights on setting transport emission goals for all three Scopes for different industries. The aim is to align with the climate actions by Paris Agreement and keep the temperature below the 2-degree scenario (B2DS).
SBT suggests setting a goal of minimum five years and maximum until 2050 (Luna & Villasana, 2017). The decarbonization pathway derived from the SBT model is a global tool and hence requires that emissions are calculated using the GLEC Framework. Thus UF’s emissions set the right base for defining short-term and long-term climate targets.
SBT recommends that the industries evaluate their trajectories against the set targets annually or at least every five years (Luna & Villasana, 2017). Corrective measures or re-assessments should be carried out based on the findings.
24
2.5 Summary
Calculating UF’s emissions and providing a forecast for 2020 will provide the first step in their plan to offer insights into carbon tracking for their carriers and shippers. Also, this will be a guide to identify levers for high emissions and reduction opportunities. We researched potential methodologies and found that utilizing the GLEC Framework and straight-line growth forecasting provides the most detailed solution for UF’s business model and purpose. Also, with the SBT model, UF can monitor their trajectory towards a sustainable freight operation.
The following chapter describes the detailed calculation methodology for emissions estimation, 2020 emissions prediction and short-term and long-term climate goal for UF based on SBT.
25
3. Methodology
Once we identified the tools and models to be used to calculate 2018-2019 emissions for Uber Freight, predict 2020 emissions, and set a carbon reduction target with a short-term and long-term plan, the next step was to use the dataset in the models to get final output. UF provided us with 2 years of shipment data from January 2018 to December 2019. The datasets consisted of all the shipments, carrier and shipper information, and route and load information in a detail level. This not only facilitated the calculation, but also was useful to provide additional insights and recommendations.
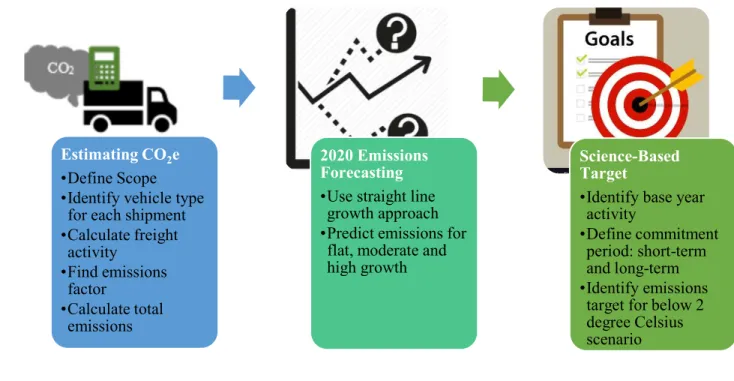
We calculated emission for 2018 and 2019 according to the Global Logistics Emissions Council logic and forecasted for 2020 using the straight-line growth approach. These two pieces of information were used as inputs to set emissions targets based on the Science-Based Target. Figure 6 illustrates the brief methodology used for the calculations.
Figure 6: Brief illustration of methodology Estimating CO2e
•Define Scope
•Identify vehicle type for each shipment •Calculate freight activity •Find emissions factor •Calculate total emissions 2020 Emissions Forecasting
•Use straight line growth approach •Predict emissions for
flat, moderate and high growth
Science-Based Target
•Identify base year activity
•Define commitment period: short-term and long-term •Identify emissions
target for below 2 degree Celsius scenario
26
3.1 Calculating Emissions
Uber Freight’s 2018-2019 data was gathered on an individual load basis to provide the greatest level of accuracy. Scope 3 emissions are calculated based on Equation 2.0, requiring the multiplication of distance (km) by weight (tonnes) and the CO2 intensity factor (kg CO2e/tkm). Since the unit of measure for distance in the available dataset from UF was in miles, this was converted to kilometer by multiplying the total miles by a factor of 1.609344. Weight was converted from pound to kilograms through multiplication by a factor of 0.000453592, and further converted to tonnes through dividing by 1000.
For the dataset, distance means shortest feasible distance between origin and destination based on Global Positioning System (GPS) information. Weight is captured from the actual load booking information from the UF’s software platform.
3.1.1 Emission Intensity Factors
The CO2 intensity factor was determined separately for SmartWay carriers versus non-SmartWay carriers. non-SmartWay data increases the accuracy of the calculation beyond the general estimation factors provided by the GLEC method.
The GLEC has specific emission factor data for SmartWay carriers based on vehicle types and fuel consumption (Greene & Lewis, 2019). Hence, For SmartWay members, the 2018 SmartWay carrier dataset was used, matching the carrier name to the appropriate carbon intensity factors. These factors were converted to CO2e and WTW emissions using the guidance in the GLEC
Framework. If vehicle types did not match, SmartWay factors were still used as an assumption to increase accuracy beyond general GLEC estimations. These factors were utilized within the formula shown in Table 3.0 for each individual load.
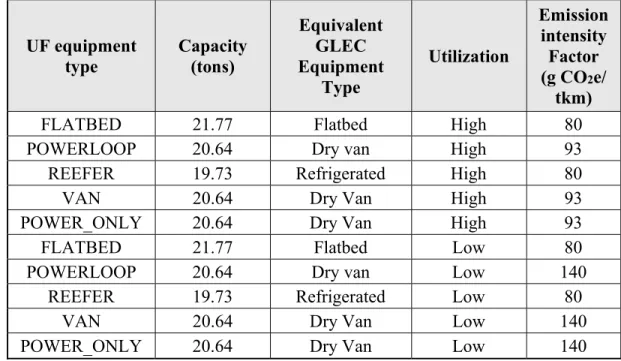
27 For non-SmartWay members, the GLEC logic was used by employing 2018 SmartWay average factors converted to CO2e and WTW emissions. (Greene & Lewis, 2019). These factors were then matched with UF’s vehicle type as shown in Table 3 below. Load utilization was determined by dividing actual weight of the load transported by UF’s given vehicle capacity by vehicle type. For utilization below 90%, it was considered low to determine the emission intensity factor.
Table 3: GLEC CO2 Emissions Calculation Factors (Greene & Lewis, 2019)
UF equipment
type Capacity (tons)
Equivalent GLEC Equipment Type Utilization Emission intensity Factor (g CO2e/ tkm)
FLATBED 21.77 Flatbed High 80
POWERLOOP 20.64 Dry van High 93
REEFER 19.73 Refrigerated High 80
VAN 20.64 Dry Van High 93
POWER_ONLY 20.64 Dry Van High 93
FLATBED 21.77 Flatbed Low 80
POWERLOOP 20.64 Dry van Low 140
REEFER 19.73 Refrigerated Low 80
VAN 20.64 Dry Van Low 140
POWER_ONLY 20.64 Dry Van Low 140
Figure 7 provides a summary of the decision tree used for selecting emissions intensity factor from table 3 for UF. We used LTL factors for less than 90% load capacity utilization.
28 Figure 7 : Decision tree for selecting emissions intensity factor
3.2 Forecasting Emissions
Total emissions in 2020 for Uber Freight was calculated considering 2019 as the base year. UF’s 2020 growth in activities were projected using the following three guide points: 5% for flat growth, 20% for moderate growth, and 40% for high growth to predict emissions in 2020. This was further extended until 2050 to calculate emissions reduction targets as per SBT model. These growth percentages were selected based on the guideline suggested by UF. The projection was made based on the assumption that all scenarios remain as same as 2019, i.e., operations continue with the same type of vehicles (fuel driven), all shipments remain point to point, no measures taken for optimization, and the entire operation remains as is.
3.3 Science-Based Target Calculation
The Sector Decarbonization Approach provides the manual and guidance for SBT initiatives. It provides an Excel model to be populated with relevant information to get the emissions reduction targets for various industries. We used outputs from the activity, emissions and forecast calculations as inputs to this Excel model.
Emissions Factor based on vehicle type
Load Utilization
Carrier Is the carrier SmartWay
partner? Is emissions factor
available for actual load utilization? Use SmartWay Emissions factor Use vehicle specific GLEC emissions factor Is load utilization below 90%? Use LTL emission s factor Use TL emission s factor
Y
Y
Y
N
N
N
29 The general guidelines for SBT follow seven steps as below: (Luna & Villasana, 2017) 1. Identification of the transport categories
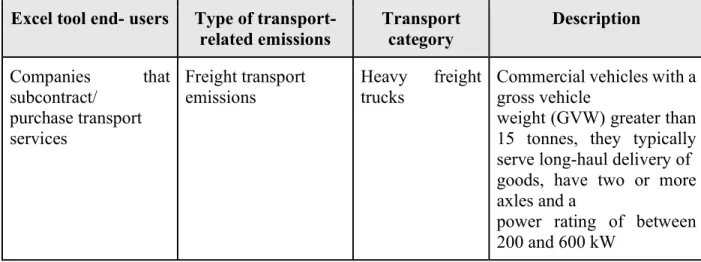
SBT provides guidelines for different industries and all 3 Scopes; hence it is crucial to identify the right industry and transport category and use the most relevant calculation model. For UF as a third-party logistics company, Table 4 presents the key parameters used in the calculation:
Table 4: Transport pathways for SBT (Luna & Villasana, 2017) Excel tool end- users Type of
transport-related emissions Transport category Description Companies that subcontract/ purchase transport services Freight transport
emissions Heavy trucks freight Commercial vehicles with a gross vehicle weight (GVW) greater than 15 tonnes, they typically serve long-haul delivery of goods, have two or more axles and a
power rating of between 200 and 600 kW
2. Defining commitment period
We defined UF’s activity growth using the forecasting method mentioned in 2.3.1, starting from 2020 to 2050 for every 5 years to set the commitment period until 2050.
3. Collecting base year data
We developed our model with 2019 as the base year. Figure 8 is the guideline from SBT to select the right dataset (Luna & Villasana, 2017):
30 Figure 8: Required data to use SBT model. Reprinted from Transport Science- Based Target
Setting Guidance (p. 9) by I.P.D.Luna & F.R.Villasana, 2017. Copyright 2017 by WWF. Reprinted with permission.
4. Estimating activity in the target year
As per the growth guidelines from UF (5%, 20% and 40% growth rate), and 2019 as the base year, we calculated activities with a 5-year interval starting from 2020 to 2050 for three different growth projections.
5. Selecting the type of transport-related emissions
This information was updated in the Excel model as ‘freight transport related’ considering the business type for UF.
6. Selecting the transport category
Since all the vehicles operated under UF’s scope are of greater than 20 tonnes capacity, the entire operation falls under heavy freight truck type and we updated the transport type accordingly. 7. Reviewing the target modeling result
The SDA Excel tool analyses two emissions scenarios, i.e., 2 Degree Scenario (2DS) and Beyond 2 Degree Scenario (B2DS). As stated in section 2.4, we used B2DS for setting emissions pathways for UF, which is in other words carbon budget for the company.
31 We completed all the seven steps described above in the SDA Excel tool to provide emissions targets to UF from year 2020 to 2050 that will ensure compliance with 2BDS.
3.4 Methodology Summary
The methodologies used for calculating emissions, forecast, and carbon budget are based on the global guidelines and any regional factors were converted to global standards. Hence, UF can use these models for replicating the same analysis for the European business or any future international expansions.
The next chapter adds further insights to the carbon estimations by analyzing load concentration and utilization. It also provides recommendations for reducing carbon footprint and achieving SBT.
32
4. Results and Discussion
We calculated and forecasted Uber Freight’s CO2 emissions at an overall aggregated level. Utilizing this information, we created tools for UF to reduce their emissions by focusing on levers including load weight and distance travelled. We also created a science-based target for the company to set reduction goals in accordance with the Intergovernmental Panel on Climate Change’s suggestions.
4.1 2018-2019 Emissions and 2020 Forecast
The GLEC Framework for calculating Uber Freight’s North American emissions was utilized for this calculation. GLEC’s general emission intensity factors were used for carriers that were not enrolled in SmartWay and thus more specific factors were not available. As Figure 9 shows, UF’s emissions were 396,124 tonnes CO2 in 2018 and 806,230 tonnes CO2 in 2019. If UF’s business continues in its current state without adopting a Science Based Target for emission reduction, Figure 9 also provides the forecasted emissions for 2020, based on flat, moderate, and high growth percentages multiplied by 2019’s total emissions.
33 Figure 9: Uber Freight’s 2018-2019 and 2020 Forecasted Tonnes CO2
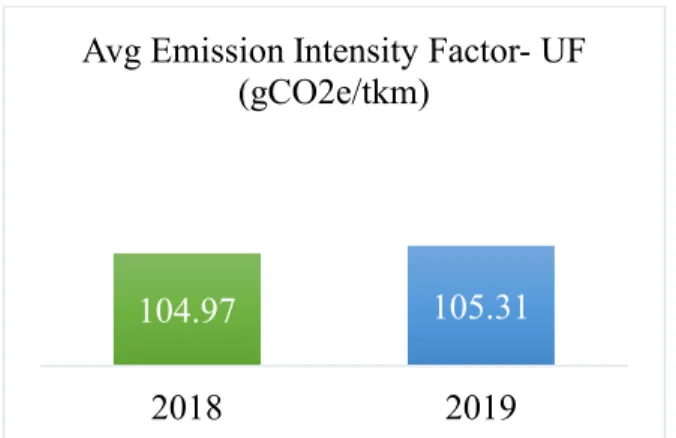
UF’s emissions in 2019 increased by 147% against 2018 and the total activity (ton-km) grew by the same rate as the company expanded business across the United States. This implies that with the growth, UF has continued operation as is without any actions for reduction in environmental footprint. This report gives them the direction to track emissions and insights for reduction of emissions. Also, figure 10 shows though emissions and activities grew at the same rate, average emissions factor increased in 2019 against 2018. Average emission intensity factor for UF in 2019 is 0.3% higher than 2018; for the coming years UF should emphasize on using more fuel efficient vehicles and optimum load building to reduce emission intensity.
200,000
400,000
600,000
800,000
1,000,000
1,200,000
2018
2019
2020 Flat
2020
Moderate
2020 High
To n C O 2 e Forecast Year Actual Year34 Figure 10: Average emissions intensity factor for UF: 2018-2019
Using Figure 9's initial forecast for 2020, Figure 11 illustrates an extrapolation, using a moderate 20% growth forecast, for UF’s total emissions until 2050. If the company continues the same path of moderate growth utilizing the same equipment without focusing on opportunities to consolidate loads and reduce emissions, their overall emissions will grow exponentially over time. UF should also set a company-wide reduction target to monitor and mitigate this forecast shown in Figure 11.
Figure 11 : Uber Freight’s Emission Forecast 2020-2050
104.97 105.31
2018 2019
Avg Emission Intensity Factor- UF (gCO2e/tkm)
35 After calculating UF’s total emissions, we derived insights on opportunities for focused reduction within the business to prevent the forecasted growth in emissions.
4.2 Uber Freight’s Science-Based Emissions Target
Shipping companies across the world are working towards decreasing their carbon emissions while increasing top-line revenue. Since 2018, UF’s top-line revenue has doubled, and their total emissions have almost tripled. The company will have to focus on emission reduction while growing revenue to bring their emissions back in line with their growth. Along with internal initiatives for key lanes, UF can enforce a science-based emission reduction target to achieve a better environmental footprint going forward. This will prevent the company from following the current projected growth in emissions illustrated in Figure 9 and Figure 11.
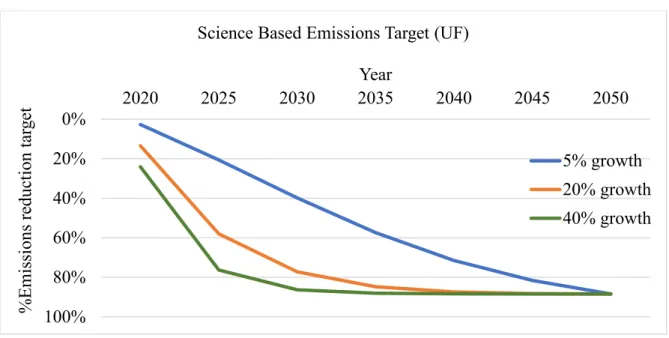
In alignment with the Paris Agreement’s goal of reaching a carbon-neutral environment, companies are signing up to create a science-based emissions target within an initiative led by the World Wildlife Fund, Carbon Disclosure Project, World Resources Institute and United Nations Global Compact. To decarbonize and eventually grow only 30% beyond the current state, UF can set this emission target for any range of time, between now and 2050. Figure 12 encompasses three percentage emission reduction targets, based on 5%, 20%, or 40% growth projections. These targets extend from 2020-2050 in alignment with the emission forecast shown in Figure 11.
36 Figure 12: Science Based Emissions Target
Uber Freight can aim to reach their emissions target each year and adjust their forecast and target accordingly based on the business growth plan. The tools provided will act as a starting point for the company’s process of measuring, tracking, and reducing emissions in 2020. Table 5 shows the absolute emissions target for UF considering growth projections.
Table 5: Uber Freight’s emissions target based on SBT
On a different approach, UF can also set targets for emissions intensity factors (total emissions divided by total activity). While the emissions grow with business growth, UF can still stay in line with SDA trajectories by reducing or controlling emissions intensity factors. This can be achievable by using more fuel efficient vehicles, optimized load planning and other recommendations discussed in chapter 5.
0% 20% 40% 60% 80% 100% 2020 2025 2030 2035 2040 2045 2050 % E m is si on s re du ct io n ta rg et Year
Science Based Emissions Target (UF)
5% growth 20% growth 40% growth Emissions (ton CO2e) 2020 2025 2030 2035 2040 2045 2050 5% growth 824,155 857,203 829,720 749,139 639,011 526,267 423,327 20% growth 838,148 1,010,738 1,363,282 2,270,190 4,670,676 10,873,331 26,572,153 40% growth 856,804 1,434,580 4,447,777 20,862,376 109,648,098 587,869,344 3,160,655,928
37 As the business changes and new data becomes available, methods of measurement should be updated accordingly to reach accurate decarbonization targets.
4.3 Uber Freight Location Insights
Business insights were drawn from Uber Freight’s 2018-2019 actual activity data. Emissions were plotted by the origin of each shipment in Figure 13. Most emissions come from East Coast origins as well as California, with large singular concentrated amounts in Colorado, Mississippi, Illinois and Michigan.
Figure 13: Uber Freight’s 2018-2019 2 Years of Kg CO2e by Origin
Figure 14 illustrates UF’s emissions plotted by destination for each shipment from 2018-2019. Similar to the origins, destination emissions span the East coast and California. Destination emissions also carry up the West coast to Washington.
38 Figure 14: Uber Freight’s 2018-2019 2 Years of Kg CO2e by Destination
Unique to the destination data, several large hotspots for emissions are shown across the map, including the greater Seattle, Washington; Fort Worth, Texas; and Jacksonville, Florida areas. This shows there is an opportunity to consolidate loads for delivery to these centers. This data can be examined further at the lane level to reveal business insights.
4.4 Uber Freight Lane Insights
Uber Freight analyzes performance and financial data on a lane level because it creates opportunities for consolidation by shipper or carrier.
Figure 15 reveals UF’s top five lanes by emissions from 2019-2020, which represent 1.48% of the company’s total emissions. These lanes can be improved to greatly reduce the company’s overall environmental footprint. By consolidating loads on the five lanes, fewer trips will be taken by trucks, resulting in a lower total distance travelled and reduced carbon emissions.
39 Figure 15: Uber Freight’s Top 5 Lanes by Emissions (kg CO2e)
We provided an in-depth view on emissions for lanes with utilization below 90% for year 2019 by dividing the weight of the load by the provided equipment type capacity. We analyzed lane-specific load utilization at an aggregate level and identified all the regular lanes (more than 2 shipments per month) with average utilization of less than 90%. There are 2,092 lanes with lower utilization (2.6% of total number of lanes) contributing to 17% of the emissions in 2019. Assuming 95% as an optimum utilization level, these lanes provide opportunities through load consolidation and thus reducing total number of trips. As we analyzed, 41% fewer loads could be shipped in these lanes if utilization was maximized for these lanes. Assuming loads can be scheduled to wait until capacity is maximized, improving the utilization would result in a 5% total CO2e reduction for the company. This can easily support the emission reduction target of 2.64% obtained from SBT for 2020 considering 5% business growth.
In 2019, 21% of CO2e emissions were generated by lanes with infrequent loads, amounting to fewer than 24 total shipments. These loads had low utilization; total shipment weight divided by capacity amounted to less than 90%. The trucks with remaining excess capacity caused the generation of emissions. These new or irregular lanes comprise 50% of the total lanes. Focusing on the efficiency of new or irregular additions to the business could allow UF to control emission growth.
40 Figure 16 shows the possible emission reduction from the top five lanes with low utilization. By focusing on these actionable top lanes, UF can immediately take steps with measured outcomes for emission reduction. Freight consolidation as an initiative can benefit UF because the company can maximize the efficiency of carriers and offer shippers reduced total costs through requiring fewer total shipments.
Figure 16: Emissions Reduction from Top Lanes with Low Utilization
Another important factor in calculating carbon emissions, besides distance travelled and weight of the load, is the emission intensity factor. Looking at the emission intensity factor for UF’s lanes, there is a significant difference between carriers who are enrolled in SmartWay reporting versus all of UF’s carriers. Figure 17 shows that SmartWay carriers have a higher emission intensity factor, averaging around 150 gCO2e versus 110 gCO2e for all carriers. Median factors lie in the center of the darkened box while the edges of the box illustrate the upper and lower quartiles. The most common maximum and minimum values are shown by the blue edges surrounding the box and outliers are displayed as dots.
86% 87% 87% 88% 88% 89% 89% 90% 90% 91% 500 1,000 1,500 2,000 2,500 3,000 3,500 4,000 4,500 TX - TX IN - OH AZ - CO AZ - CO IL- MI
Trip reduction Emission reduction
N um be r of lo ad s % o f em is si on s re du ct io n
41 Figure 17: Emission Intensity Factors by Lane
This shows that with more specific carrier-based data, emissions estimations are more accurate, thus emissions may actually be much higher than when they are calculated using general intensity factors. Many companies require all carrier partners to enroll in the SmartWay program to encourage consideration of environmental footprint throughout their business. Employing Figure 16, UF can encourage their carrier partners to enroll in SmartWay to get a clearer understanding of their overall emissions.
The first step to reduction is measuring as accurately as possible, so the company can benchmark progress with specific ambitious targets. Ensuring all parties involved in shipping take steps to measure and reduce their own environmental footprint will increase the total freight industry awareness of the issue, and ultimately, emissions reduction. By understanding the details and drivers of their emissions, UF can set their own company-wide goals to improve their business efficiency and reduce their environmental footprint.
42
5.0 Conclusion
To prepare for government regulations and satisfy consumer demand, companies are prioritizing reducing GHG emissions to prevent climate change. Measuring GHG emissions with the purpose of reducing those emissions through setting targets, establishing strategies, and benchmarking progress is important for companies competing for business in today’s economy. UF is a third-party logistics service provider that pairs shippers and carriers who are working to exceed their respective customer expectations for shipping and environmental footprint.
With the available two-year data set of loads shipped since the company’s creation, we created a methodology and full analysis of levers driving UF’s emissions. We conducted a complete analysis, based on the company’s growth projections, to reduce emissions on specific lanes for immediate improvement. The company can reduce emissions by planning loads across shippers to emphasize maximizing capacity and reducing trips. UF can focus on new or irregular lanes with low volume to make an impact. Improvement in accuracy can be made through the collection of additional data from their carriers.
As a third-party freight company, UF must collaborate with shippers and carriers to reduce the emissions caused by their business model. Also, to increase the accuracy in future measurements, UF can encourage their carriers to join the SmartWay organization, which provides CO2e per tkm for each carrier as the emission intensity factor. Alternatively, the company can track its carriers’ fuel usage and equipment type to determine CO2e per tkm at the carrier level, thus creating a more specific emission intensity factor for calculations. The company can also align its equipment type data with the truck types provided in the GLEC Framework.
43 UF can utilize the provided Science-Based Target to continue to accurately measure, track and reduce their environmental footprint each year. The target should be updated as forecasted and actual growth in emissions changes. The company can distinguish itself from competitors by adding GHG emission reduction to their mission. This information can be published within investor reports or corporate responsibility reports to win additional business from shippers, who are concerned with offsetting GHG emissions to satisfy their customers. UF also possesses the opportunity to utilize the outcome from this capstone to create a carbon disclosure report. The company can distinguish itself from competitors by adding GHG emission reduction to their mission.
44
References
Beer, J., & Beer, J. (2018, February 21). How Patagonia Grows Every Time It Amplifies Its Social Mission. Fast Company. https://www.fastcompany.com/40525452/how-patagonia-grows-every-time-it-amplifies-its-social-mission
Business Environmental Leadership Council. (2019, April 24). Center for Climate and Energy Solutions. https://www.c2es.org/our-work/belc/
Claire Underwood. (2019, September 19). How companies take action to reduce carbon emissions. Center for Climate and Energy Solutions. https://www.c2es.org/2019/09/how-companies-take-action-to-reduce-carbon-emissions/
Emission-factors_mar_2018_0.pdf. (2018, March 9). Retrieved April 20, 2020, from
https://www.epa.gov/sites/production/files/2018-03/documents/emission-factors_mar_2018_0.pdf
Ghg-freight-guide.pdf. (n.d.). Retrieved April 20, 2020, from https://assets.publishing.service.gov.uk/government/uploads/system/uploads/attachment_ data/file/218574/ghg-freight-guide.pdf
Greene, S., & Lewis, A. (2016). What is the GLEC Framework—How to implement items | Smart Freight Centre. https://www.smartfreightcentre.org/en/how-to-implement-items/what-is-glec-framework/58/
Greene, Suzanne, & Lewis, A. (2019). GLECFramework_2019.Amsterdam, Netherlands : Smart Freight Centre.
Hill, N., Bramwell, R., & Harris, B. (2017). 2017 GHG Conversion Factors for Company Reporting.pdf.
45 International Transport Forum. (2019). ITF Transport Outlook 2019 [Text].
https://www.oecd-ilibrary.org/transport/itf-transport-outlook-2019_transp_outlook-en-2019-en
Luna, I. P. D., & Villasana, F. R. (2017). SBT-transport-guidance. Gland, Switzerland: World Wildlife Fund
Patagonia Outdoor Clothing & Gear. (2020). https://www.patagonia.com/activism/
Uber Freight. (2019). Uber Freight helps IPP’s mission of sustainability through shipping | Uber Freight. https://www.uberfreight.com/blog/Uber-Freight-IPP-Case-Study
US EPA, O. (2016a, March 3). SmartWay [Collections and Lists]. US EPA. https://www.epa.gov/smartway
US EPA, O. (2016b, May 26). Why Freight Matters to Supply Chain Sustainability [Overviews and Factsheets]. US EPA. https://www.epa.gov/smartway/why-freight-matters-supply-chain-sustainability
US EPA, O. (2017, February 8). Inventory of U.S. Greenhouse Gas Emissions and Sinks [Reports and Assessments]. US EPA. https://www.epa.gov/ghgemissions/inventory-us-greenhouse-gas-emissions-and-sinks
Ward, J., Zimmerman, M., Oca, A., Sonthalia, B., Acar, K., & Sun, Y. (2019). CSCMP’s Annual State of Logistics Report.
Wedderburn-Bisshop, G., Longmire, A., & Rickards, L. (2015). Neglected Transformational Responses: Implications of Excluding Short Lived Emissions and Near Term Projections in Greenhouse Gas Accounting. The International Journal of Climate Change: Impacts and Responses, 7, 11–27.
46
List of Abbreviations
2DS 2-degree Celsius scenario
B2DS Beyond 2-degree Celsius scenario
CO2 Carbon dioxide
CO2e Carbon dioxide equivalent
DEFRA Department of Environmental Food & Retail Affairs
EPA Environmental Protection Agency
GHG Greenhouse gas
GLEC Global Logistics Emissions Council
GVW Gross vehicle weight
GWP Global warming potential
KG Kilogram
KM Kilometer
KW Kilowatt
NTM Network for Transport Measures
SBT Science based target
SDA Sector decarbonization approach
TTW Tank to wheel
UF Uber Freight
USA United States of America
WTT Well to tank