HAL Id: hal-01765830
https://hal.archives-ouvertes.fr/hal-01765830
Submitted on 13 Apr 2018
HAL is a multi-disciplinary open access
archive for the deposit and dissemination of sci-entific research documents, whether they are pub-lished or not. The documents may come from teaching and research institutions in France or abroad, or from public or private research centers.
L’archive ouverte pluridisciplinaire HAL, est destinée au dépôt et à la diffusion de documents scientifiques de niveau recherche, publiés ou non, émanant des établissements d’enseignement et de recherche français ou étrangers, des laboratoires publics ou privés.
MS
Basma El Hamzaoui, Maureen Laroche, Lionel Almeras, Didier Raoult,
Philippe Parola, Jean Michel Berenger
To cite this version:
Basma El Hamzaoui, Maureen Laroche, Lionel Almeras, Didier Raoult, Philippe Parola, et al.. De-tection of Bartonella spp. in fleas by MALDI-TOF MS. PLoS Neglected Tropical Diseases, Public Library of Science, 2018, 12 (2), �10.1371/journal.pntd.0006189�. �hal-01765830�
Detection of Bartonella spp. in fleas by
MALDI-TOF MS
Basma El Hamzaoui1, Maureen Laroche1, Lionel Almeras1,2, Jean-Michel Be´renger1, Didier Raoult1, Philippe Parola1*
1 Aix Marseille Univ, IRD, AP-HM, SSA, VITROME, IHU-Me´diterrane´e Infection. 19–21 Boulevard Jean Moulin, Marseille, France, 2 Unite´ de Parasitologie et entomologie, De´partement des maladies infectieuses, Institut de Recherche Biome´dicale des Arme´es, IHU Me´diterrane´e Infection, Marseille, France
Abstract
Background
Matrix-Assisted Laser Desorption/Ionization Time-of-Flight Mass Spectrometry (MALDI-TOF MS) has recently emerged in the field of entomology as a promising method for the identification of arthropods and the detection of associated pathogens.
Methodology/Principal findings
An experimental model of Ctenocephalides felis (cat fleas) infected with Bartonella quintana and Bartonella henselae was developed to evaluate the efficacy of MALDI-TOF MS in distin-guishing infected from uninfected fleas, and its ability to distinguish fleas infected with
Barto-nella quintana from fleas infected with BartoBarto-nella henselae. For B. quintana, two groups of
fleas received three successive blood meals, infected or not. A total of 140 fleas (100 exposed fleas and 40 control fleas) were engorged on human blood, infected or uninfected with B. quintana. Regarding the second pathogen, two groups of fleas (200 exposed fleas and 40 control fleas) were fed in the same manner with human blood, infected or not with
Bartonella henselae. Fleas were dissected longitudinally; one-half was used for assessment
of B. quintana and B. henselae infectious status by real-time PCR, and the second half was subjected to MALDI-TOF MS analysis. Comparison of MS spectra from infected fleas and uninfected fleas revealed distinct MS profiles. Blind queries against our MALDI-TOF MS arthropod database, upgraded with reference spectra from B. quintana and B. henselae infected fleas but also non-infected fleas, provided the correct classification for 100% of the different categories of specimens tested on the first model of flea infection with Bartonella
quintana. As for Bartonella henselae, 81% of exposed qPCR-positive fleas, 96% of exposed
qPCR-negative fleas and 100% of control fleas were correctly identified on the second model of flea infection.
MALDI-TOF MS successfully differentiated Bartonella spp.-infected and uninfected fleas and was also able to correctly differentiate fleas infected with Bartonella quintana and fleas infected with Bartonella henselae. MALDI-TOF MS correctly identified flea species as well as their infectious status, consistent with the results of real-time PCR.
a1111111111 a1111111111 a1111111111 a1111111111 a1111111111 OPEN ACCESS
Citation: El Hamzaoui B, Laroche M, Almeras L,
Be´renger J-M, Raoult D, Parola P (2018) Detection of Bartonella spp. in fleas by MALDI-TOF MS. PLoS Negl Trop Dis 12(2): e0006189.https://doi.org/ 10.1371/journal.pntd.0006189
Editor: Pamela L. C. Small, University of
Tennessee, UNITED STATES
Received: November 24, 2016 Accepted: December 22, 2017 Published: February 16, 2018
Copyright:© 2018 El Hamzaoui et al. This is an open access article distributed under the terms of theCreative Commons Attribution License, which permits unrestricted use, distribution, and reproduction in any medium, provided the original author and source are credited.
Data Availability Statement: All relevant data are
within the paper and its Supporting Information files.
Funding: The authors received no specific funding
for this work.
Competing interests: The authors have declared
Conclusions/Significance
MALDI-TOF is a promising tool for identification of the infection status of fleas infected with
Bartonella spp., which allows new possibilities for fast and accurate diagnosis in medical
entomology and vector surveillance.
Author summary
Fleas are known vectors of human infectious diseases. Identification of fleas and their associated pathogens is essential for the prevention of flea-borne diseases. Currently, the morphological identification of arthropods based on dichotomous keys, as well as molecu-lar techniques, are the most common approaches for arthropod identification and ento-mological surveillance. In recent years, MALDI-TOF MS has revolutionized clinical microbiology in enabling the rapid identification of bacteria and fungi by comparing the protein profiles obtained to a database. This proteomic approach has recently been used for arthropod identification and pathogen detection. Here, we developed an experimental model to test MALDI-TOF’s ability to differentiate fleas infected with human pathogens, Bartonella quintana and Bartonella henselae, from uninfected fleas.
Introduction
Fleas are wingless insects characterized by a laterally flattened body between 1.5 and 4 mm long. Males and females are strict hematophagous parasites of mammals and birds [1].
Fleas are vectors of human infectious diseases such as bubonic plague, caused byYersinia pestis, and murine typhus, caused by Rickettsia typhi [2,3]. Fleas can also transmitBartonella henselae, the agent of cat-scratch disease. Recently, Ctenocephalides felis, the cat flea, was described as a potential vector ofBartonella quintana, the agent of trench fever, known to be transmitted by the human body louse(Pediculus humanus humanus)[4,5].
Currently, the most widely used method for flea identification is based on morphological criteria [6]. This approach relies on the use of identification keys that require entomological expertise and specific documentation. However, the number of entomologists specialized in flea’s taxonomy is very small [7]. Also, the accurate identification of most flea species requires specimens to be slide mounted for stereoscopic examination, which makes them unusable for further molecular studies [8].
During entomological surveys, the determination of the infection status of fleas is also a critical step in assessing the risk of disease transmission. Molecular biology has been used in the last 20 years for arthropod identification and detection of their associated pathogens [8]. However, this approach is limited by the availability of reference sequences in the GenBank database. The length of time and the cost associated with molecular biology approaches can be limiting as well.
Recently, Matrix-Assisted Laser Desorption/Ionization Time-Of-Flight Mass Spectrometry (MALDI-TOF MS), a technique based on the analysis of protein fingerprints, has revolution-ized clinical microbiology, enabling the rapid identification of bacteria and fungi by compar-ing their protein profiles to a reference database [9]. More recently, MALDI-TOF MS has been successfully applied to the identification of arthropods, including fleas [8,10]. Moreover, this tool has been tested for its ability to detect pathogens in arthropods, and it has been reported that MALDI-TOF is able to successfully differentiate ticks infected or uninfected byBorrelia or Rickettsia spp. [11,12].
In this context, we set up an experimental model of flea infection withB. quintana and Bar-tonella henselae. We ranked the flea groups according to their infection status as confirmed with molecular biology, and we evaluated MALDI-TOF’s ability to distinguish the different groups and different pathogens.
Materials and methods
Flea rearing
Cat fleas (Ctenocephalides felis) were maintained under standard laboratory rearing conditions as previously described [4]. Adult stages were fed with human blood previously heated in a water bath at 37˚C for 30 minutes. It was made available to the fleas via glass tubes closed with parafilm (Sigma-Aldrich, Saint Louis, Missouri, USA), which were fixed to the plates contain-ing the fleas [4]. The breeding cells containing the fleas are in contact with the lower part of the membrane. The eggs are collected with adult feces 1–2 times a week in sterile tubes con-taining 10 grams of larval nutrient medium, composed of 20 g rodent food, 40 g sand, 3 g lyophilized blood, and 2 g yeast. The tubes were placed in the laboratory incubator in the same temperature and humidity conditions used for the adults (80% humidity, 27˚C). The device is kept in the dark until the emergence of the adult stages [4].
Bartonella quintana and Bartonella henselae
All experiments conducted withBartonella quintana and Bartonella henselae were performed inside a Biosafety cabinet in a Biosafety Level 2 (BSL2) room. The two strains of bacteria (B. quintana strain Oklahoma ATCC 49793, Bartonella henselae strain Marseille) were grown on Columbia sheep blood agar plates (5%, BioMerieux, Marcy l’Etoile, France) at 37˚C in atmo-sphere enriched with 5% CO2[13]. After 10 days of culturing, the bacteria were collected and
transferred to a tube containing 400μL of phosphate buffered saline (PBS), pH 7.2 (PBS, Bio-Merieux, Marcy l’Etoile, France). Two hundred microliters of this bacterial suspension mixed with 2 mL of human blood, like a simple mixture ofBartonella sp. and erythrocytes not an erythrocyte infection, were used for artificial infection of fleas. An aliquot of 2 ml of human whole blood containing 200μl of PBS was used to feed the control group. The bacterial suspen-sion (100μl) was used for bacterial quantification by flow cytometry. The inocula were marked by DAPI (4’,6-diamidino-2-phe´nylindole) and counting beads to quantify the number of bac-teria. The absolute number of cells of interest (cells/μL) was calculated according to the manu-facturer’s recommendations. The last 100μl of inoculum was used for bacterial culture [14].
Artificial infection of fleas
For secure experimentation, a Georgie and Wade confined equipment (BSL3) was used for flea infection withB. quintana and B. henselae [4]. It is composed of a glove box with a safety airlock to load and unload material. For artificial infection withBartonella quintana, two groups were created, an exposed group containing 100Ctenocephalides felis fleas (40 males and 60 females) and a control group containing 40Ctenocephalides felis fleas (20 males and 20 females). For artificial infection withBartonella henselae, two groups were formed; an exposed group containing 200Ctenocephalides felis fleas (120 females and 80 males) and a control group containing 40Ctenocephalides felis fleas (20 males and 20 females). Each flea group received three successive human blood meals. Control fleas were fed withBartonella-free blood mixed with 200μL of PBS and exposed fleas were fed with blood infected with 200 μL of bacterial suspension [15]. These meals were delivered every 48 hours [4].
DNA extraction and PCR detection of
Bartonella quintana and Bartonella
henselae
Three days after the last infective meal, ten fleas from each group were subsequently collected every two days. They were washed individually with 70% ethanol, and then rinsed twice with dis-tilled water. Each flea was dissected using a sterile scalpel. Half of the body was selected for real-time PCR detection of the presence ofBartonella quintana and Bartonella henselae and the rest of the body was saved for MALDI-TOF MS analysis. Flea samples destined for molecular biology were incubated overnight at 56˚C in 180μl of G2 buffer (Qiagen, Hilden, Germany) (30 mM Tris-Cl, 30 mMEDTA; 5% Tween 20, 0.5% Triton X-100; 800 mMGuHCl) and 20μl of proteinase K (Qiagen, Hilden, Germany) (activity of 600 mAU/ml solution or 40 mAU/mg of protein).
After lysis of the samples, DNA extraction was performed in the automatic extractor EZ1 (Qiagen, Hilden, Germany). The presence ofB. quintana and B. henselae DNA in these fleas was assessed byBartonella-specific real-time PCR targeting the yopP3 gene [16] andpap31 gene, respectively [17].
Assessment by MALDI-TOF MS for the detection of
Bartonella quintana
and
Bartonella henselae in fleas
The other half of the body of each flea was used to detect the presence ofBartonella quintana and Bartonella henselae in fleas by MALDI-TOF MS. The samples were ground using a TissueLyser II device (Qiagen, Hilden, Germany) in 30μl of 50% (v/v) acetonitrile, 30 μl of 70% (v/v) formic acid (Fluka, Buchs, Switzerland) and a small amount of glass powder (Sigma, Lyon, France). They were crushed at a frequency of 30 Hz for 1 minute and this cycle was repeated 3 times, in accordance with the previously published sample preparation optimization tests [18]. After cen-trifugation, 1μl of supernatant was deposited in quadruplicate on the MALDI-TOF plate and covered by 1μl of CHCA matrix solution composed of saturated α-cyano-4-hydroxycynnamic acid (CHCA) (Sigma, Lyon, France), 50% (v/v) acetonitrile (Fluka, Buchs, Switzerland), 2.5% tri-fluoroacetic acid (v/v) (Aldrich, Dorset, UK) and HPLC-grade water as previously described [8].
Protein mass profiles were obtained using a Microflex LT MALDI-TOF (Bruker Daltonics, Germany) mass spectrometer, with detection in positive ion linear mode at a laser frequency of 50 Hz in a mass range 2–20 kDa. The acceleration voltage was set to 20 kV, and the time of extraction delay was 200 ns. Each spectrum corresponds to the ions obtained from 240 laser shots fired in six regions of the same deposit on the ground plate and acquired automatically using the function of the Flex Control AutoXecute V.2.4 software (Bruker Daltonics). The spectra are displayed with Flex analysis v.3.3 software and exported to ClinProTools2.2 and MALDI Biotyper v.3.0 (Bruker Daltonics, Germany) for data processing. The reproducibility of the spectra of each flea group was evaluated using the ClinProTools 2.2 software. Reference spectra (MSP, Main Spectrum Profile) were generated by the automated function of the MAL-DI-Biotyper software v3.0 (Bruker Daltonics, Germany) by combining the results of the spec-tra of at least three specimens per condition in order to create a database. MSP were produced based on an unbiased algorithm based on the peak position, intensity and frequency. Flea spec-tra were selected based on their reproducibility and intensity for all MS analyses, including database creation. The database was created by selecting the spectra of at least 3 to 14 speci-mens from infected, exposed and control groups for both trials.
Blind tests
The ability of MALDI-TOF MS to distinguish infected, exposed but uninfected, and control fleas was evaluated by blind test analysis. After sorting the spectra, high quality and reproducible
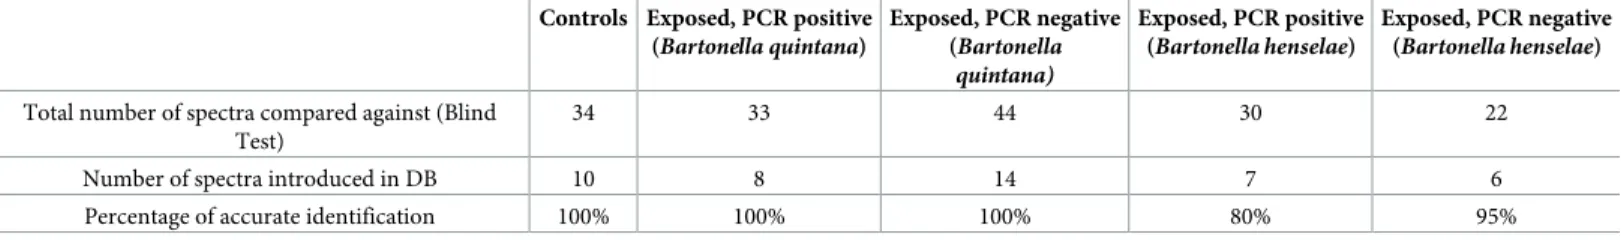
MALDI-TOF MS spectra from the half body of 8 control fleas from the first trial (B. quintana) and 2 from the second trial (B. henselae), 8 fleas infected with B. quintana and 7 fleas infected with B. henselae, and 14 fleas that fed on infected blood with B. quintana and 6 fleas that fed on infected blood withBartonella henselae but tested negative in qPCR, were introduced into our in-house arthropod database (Table 1). This database already contains spectra obtained from protein extracts of the cephalothorax and legs of specimens of 4 species of fleas, includingCtenocephalides felis felis, Archaeopsylla erinacei, Xenopsylla cheopis and Ctenocephalides canis, a total of 6 tick spe-cies (Am. variegatum infected by Rickettsia africae, Rh. sanguineus, Rh. bursa, Rh. annulatus, Rh. turanicus, Argas persicus, Hy. rufipes, Hy. detritum, I. ricinus, D. marginatus and D. reticulatus), 30 mosquito species (Anopheles gambiae Giles, An. coluzzii, An. funestus, An. ziemanni, An. arabien-sis, An. wellcomei, An. rufipes, An. pharoenarabien-sis, An. coustani, An. claviger, An. hyrcanus, An. maculi-pennis, Culex quinquefasciatus, Cx. pipiens, Cx. modestus, Cx. insignis, Cx. neavei, Aedes albopictus, Ae. excrucians, Ae. vexans, Ae. rusticus, Ae. dufouri, Ae. cinereus, Ae. fowleri, Ae. aegypti, Ae. cas-pius, Mansonia uniformis, Orthopodomyia reunionensis, Coquillettidia richiardii and Lutzia tigripes,), and other arthropods, including lice (Pediculus humanus corporis), triatomines (Tria-toma infestans, Rhodnius prolixus, R. pictipes, R. robustus, Panstrongylus geniculatus, Eratyrus mucronatus) and bedbugs (Cimex lectularius)[8,10,12,19–22].
Then, after the elimination of poor quality spectra, 33 spectra of infected fleas with Barto-nella quintana, 30 spectra of infected fleas with BartoBarto-nella henselae, 44 spectra of fleas that fed on infected blood but that tested negative toBartonella quintana in qPCR, 22 spectra of fleas that fed on infected blood but that tested negative toBartonella henselae in qPCR, and a total of 34 spectra of control fleas from the first and second trial were queried against the upgraded database (Table 1).
The results of the database queries are presented as Log Score Values (LSVs) for each spec-trum, corresponding to a matched degree of signal intensities of mass spectra of the query and the reference spectra. LSVs range from 0 to 3. LSVs allow good evaluation of the reproducibil-ity between a queried spectrum and a reference spectrum, as they are the result of a thorough comparison of peak positions and intensity between those two spectra. An LSV was obtained for each spectrum of the samples tested blindly. For each specimen, the spectrum with the highest LSVs was selected for identification [22].
MALDI-TOF MS biomarker mass set
To appraise reproducibility of the MS profiles, spectra from the three categories (infected, exposed but PCR-negative, and control) were imported in the ClinProTools 2.2 software for both pathogens (B. quintana, B. henselae). For the determination of discriminating peak mas-ses associated with infection status, we compared the average spectrum of the three categories of fleas. The software was used to generate a peak list for each group in the 2 to 20 kDa mass range and to identify discriminating peaks. Regarding the discrimination between control pro-files andB. quintana-infected flea derived profiles, the parameter settings in ClinProTools
Table 1. Results of blind test analysis after upgrading of the MALDI-TOF MS database. DB: database. Controls Exposed, PCR positive
(Bartonella quintana) Exposed, PCR negative (Bartonella quintana) Exposed, PCR positive (Bartonella henselae) Exposed, PCR negative (Bartonella henselae)
Total number of spectra compared against (Blind Test)
34 33 44 30 22
Number of spectra introduced in DB 10 8 14 7 6
Percentage of accurate identification 100% 100% 100% 80% 95%
2.2 software for spectra preparation were as follows: a resolution of 800; a noise threshold of 2.50; a maximal peak shift of 800 ppm and a match to calibrant peaks of 20%. For the peak cal-culation, peak peaking was performed on single spectra with a signal-to-noise threshold of 2.50 and an aggregation of 800 ppm. As forB. henselae, the parameters were as follows: a reso-lution of 800; a noise threshold of 2.20; a maximal peak shift of 800 ppm and a match to cali-brant peaks of 20%. For the peak calculation, peak peaking was performed on single spectra with a signal-to-noise threshold of 2.20 and an aggregation of 800 ppm. The spectra were then analyzed with the genetic algorithm (GA) model, which provided a list of discriminating peaks. Manual inspection and validation of the peaks by the operator gave a “recognition capa-bility” (RC) value together with the highest “cross-validation” (CV) value.
Results
Acquisition of
Bartonella quintana and Bartonella henselae by cat fleas
ForBartonella quintana inocula, bacterial cell numbers in the first inoculum were 8.106, 7.106 in the second inoculum and 7.106in the last inoculum (cells/μL), as determined by flow cytometry.
ForBartonella henselae inocula, bacterial cell numbers in the first inoculum were 6.106, 4.107in the second inoculum, and 8.106in the last inoculum (cells/μL).
Three days after the infective blood meal, 28 control fleas and 80Bartonella quintana-exposed fleas were collected for the first trial, and 20 control and 160Bartonella henselae-exposed fleas were collected for the second trial. The qPCR results indicated the presence of Bartonella quintana DNA in 33 (41.25%) of the 80 fleas, with cycle threshold (Ct) values rang-ing from 27.19 to 35.85, and the presence ofBartonella henselae in 40 Ctenocephalides felis (25%) of the 160 fleas, with cycle threshold (Ct) values ranging from 28.95 to 35.80. All control fleas tested negative.
MALDI-TOF MS detection of
Bartonella spp. in fleas
All collected fleas were analyzed by MALDI-TOF MS. Spectra analysis with Flex analysis v.3.3 and ClinProTools 2.2 software revealed reproducibility of the profiles within the same category (Figs1and2).
All profiles were compared using the ClinProTools 2.2 software to appraise global repro-ducibility and create an average profile. Visual inspection revealed that some peaks were pres-ent in fleas infected withBartonella quintana and Bartonella henselae profiles, but absent in control and exposed fleas (Figs3and4).
The Genetic Algorithm tool of ClinProTools software was used to better identify the dis-criminating peaks between infected and control fleas. Spectra from 33Ctenocephalides felis specimens infected withBartonella quintana were compared to 22 control Ctenocephalides felis, same for the second pathogen; spectra from 24 Ctenocephalides felis specimens infected withBartonella henselae were compared to 12 control Ctenocephalides felis. The genetic algo-rithm model displayed 13 peak masses that discriminated control and infected fleas with Bar-tonella quintana (Table 2), and 20 peak masses that discriminated control and infected fleas withBartonella henselae (Table 3), with recognition capability (RC) and cross validation (CV) values of 100% for both comparisons.
Bartonella quintana qPCR positive fleas (n = 33), Bartonella henselae qPCR positive fleas (n = 30), fleas exposed to blood infected withB. quintana but PCR negative (n = 44), fleas exposed to blood infected withB. henselae but PCR negative (n = 22) and control fleas (n = 34) were queried blindly against the MALDI-TOF arthropod database upgraded with reference spectra from these 4 category. All fleas from the artificial infection withBartonella quintana
were correctly identified to the species level and MALDI-TOF MS differentiated correctly the three categories of fleas (Table 1). Regarding artificial infection withBartonella henselae, the identification was correct for 24/30 infected fleas (80%), 21/22 exposed negative fleas (95%) and 100% correct identification for all control fleas. For all tested samples, LSVs ranged from 2.149 to 2.859 for exposed positive fleas, from 2.091 to 2.838 for exposed negative fleas and from 2.147 to 2.713 for control fleas.
Discussion
Recently, MALDI-TOF MS technology has been successfully used for the identification of arthropods such as fleas [10], mosquitoes [20,23],Culicoides [21], ticks [19,24], sand flies [25] tsetse flies [26] and triatomines [22]. The success of this method requires the standardization of sample preparation protocols to allow sharing and comparison of MS reference spectra and results between research laboratories. As is true for each innovative method, application of this tool is best with some limitations, such as the cost of the device and the comprehensiveness of the databases [23]. Furthermore, some parameters may play a role in the efficiency of
Fig 1. Reproducible and specific MALDI-TOF MS spectra ofBartonella quintana strain, body half of fresh Ctenocephalides felis infected with Bartonella quintana,
exposed and control analyzed by Flex analysis 3.3 software. a.u., arbitrary units; m/z, mass-to-charge ratio. https://doi.org/10.1371/journal.pntd.0006189.g001
MALDI-TOF MS identification, such as the conservation of arthropods after collection (18). Several recent studies have shown the efficacy of MALDI-TOF in identifying arthropods con-served in alcohol. Ticks collected in the field in Ethiopia, which were precon-served in 70% ethanol for about two years, were correctly identified by MALDI-TOF. More recently, different species of ticks collected on mammals in Mali, also preserved in alcohol, were successfully identified as well by MALDI TOF, after the development of a de-alcoholization protocol providing even better results for MS identification for samples preserved in alcohol [27]. Arthropod body part selection for MALDI-TOF arthropod identification is based on the comparison of the spectra quality from different parts of the body. Flea reference spectra in our database were obtained from cephalothorax and leg protein extracts [10]. In this study, half of the body was chosen for MALDI-TOF MS and the other half for molecular biology, based on previous data indicating that theBartonella species is localized in the infected flea gut tract [4]. Intraspecies reproduc-ibility and interspecies specificity are then evaluated and the most reproducible spectra are selected to upgrade the database [8].
After the emergence of this method to identify arthropods, our research has been oriented toward the detection of associated pathogens. Preliminary encouraging work has shown that
Fig 2. Reproducible and specific MALDI-TOF MS spectra ofBartonella quintana strain, body half of fresh Ctenocephalides felis infected with Bartonella henselae, exposed and control analyzed by Flex analysis 3.3 software. a.u., arbitrary units; m/z, mass-to-charge ratio.
MALDI-TOF can differentiateRhipicephalus sanguineus ticks infected or not by Rickettsia conorii, the agent of Mediterranean spotted fever [12]. It can detectPlasmodium parasites in anopheles [23] andBorrelia spp. in Ornithodoros sonrai ticks [11] based on spectra obtained from the cephalothorax or legs, respectively.
Here, we obtained reproducible and intense spectra from control fleas, and also from fleas infected withB. quintana and B. henselae whose infection status was previously confirmed by quantitative PCR. In these models (B. quintana, B. henselae), the bacterial loads of the infec-tious blood meals is higher than the bacteremia of humans with trench fever, which is around 104 to 105 [28]. However, our work focuses on the capacity of MALDI-TOF MS to distinguish fleas infected or not byBartonella species. So, for this purpose we needed to obtain infected fleas. In previous published work, we have shown that in experimental models, it is difficult to infect fleas using bacteremia lower than 105 [4]. The aim of this work was not to study or explain how fleas are infected in natural cycles. This is why we chose to use higher concentra-tions, knowing that fleas will be successfully infected, as others have done in their models of infection [29,30]. Although the performance of the tool was assessed for the detection of the presence ofBartonella species in fleas, sensitivity and specificity are important parameters to consider when a new method is proposed. However, it is difficult to definitively determine the sensitivity of our method in the absence of a gold standard to determine the infectious status
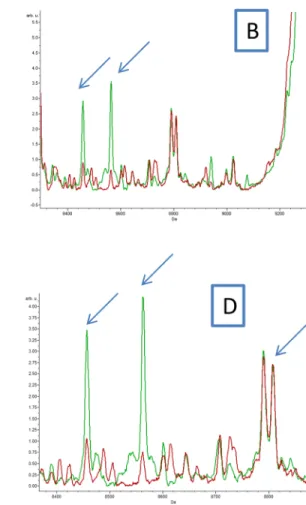
Fig 3. (A, B, C and D) Comparison of MALDI-TOF MS profiles of body half ofCtenocephalides felis infected or not by Bartonella quintana using ClinProTools 2.2 software. Red and green peaks indicated by arrows correspond to discriminating peaks of control and infected fleas respectively.
of fleas. While the bacterial concentration of the inoculum was measured, the exact bacterial load in each flea at the moment of the MALDI-TOF assay was unknown here. This work how-ever was a preliminary work to determine the usefulness of MALDI TOF in differentiating infected and non-infected fleas in comparison with qPCR. For that purpose, groups were cho-sen regarding infection status. These groups corresponded respectively to fleas with low Ct val-ues (below 35) for the infected group, fleas that were exposed to infected blood but had a negative qPCR test, and control fleas. Interestingly, exposed but PCR-negative fleas were clas-sified by MALDI-TOF MS as a single category, different than infected and control categories. While all fleas were perfectly identified for each category for theB. quintana model, there were nevertheless limitations in the distinction between fleas infected withB. henselae and fleas exposed to the same bacteria but negative in qPCR, since six infected specimens were identi-fied as exposed PCR-negative specimens. The qPCR Ct values of these specimens varied between 35.53 and 35.85; they were all collected on the first day of collection, which corre-sponded to the third day after the last infective blood meal. We can hypothesize that the identi-fication of infected fleas is based on discriminating peaks associated with the flea immune response. Because this approach is strictly based on the comparison of a profile to a reference
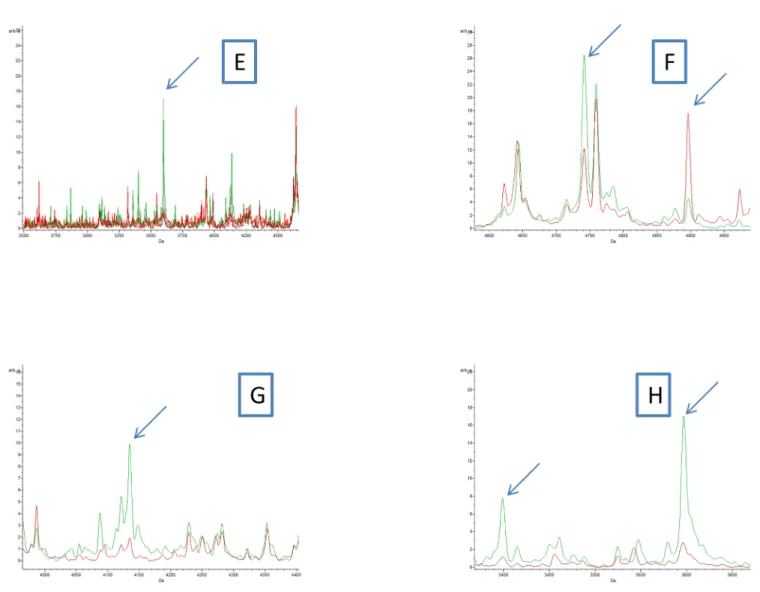
Fig 4. (E, F, G and H) Comparison of MALDI-TOF MS profiles of body half ofCtenocephalides felis infected or not by Bartonella henselae using ClinProTools 2.2 software. Red and green peaks indicated by arrows correspond to discriminating peaks of control and infected fleas, respectively.
spectrum, which is a representation of the extracted global proteome of the selected body part of the flea, it is not here possible to correlate a peak position to a protein identification. To obtain such information, complementary proteomic analyses would be necessary and would help to decipher interactions between fleas and flea-borne pathogens. These peaks could be partially present in exposed fleas, perhaps temporarily, causing misidentification of these spec-imens as infected fleas.
A specific arthropod immune response to bacterial infection has already been described. Indeed, the production of three proteins inAnopheles gambiae hemolymph were increased
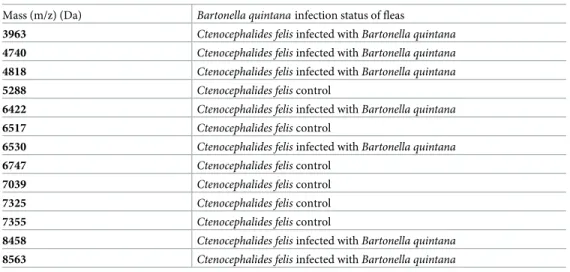
Table 2. Peak masses distinguishing uninfected andinfected fleas by Bartonella quintana analyzed with
ClinProTools.
Mass (m/z) (Da) Bartonella quintana infection status of fleas
3963 Ctenocephalides felis infected with Bartonella quintana
4740 Ctenocephalides felis infected with Bartonella quintana
4818 Ctenocephalides felis infected with Bartonella quintana
5288 Ctenocephalides felis control
6422 Ctenocephalides felis infected with Bartonella quintana
6517 Ctenocephalides felis control
6530 Ctenocephalides felis infected with Bartonella quintana
6747 Ctenocephalides felis control
7039 Ctenocephalides felis control
7325 Ctenocephalides felis control
7355 Ctenocephalides felis control
8458 Ctenocephalides felis infected with Bartonella quintana
8563 Ctenocephalides felis infected with Bartonella quintana
https://doi.org/10.1371/journal.pntd.0006189.t002
Table 3. Peak masses distinguishing uninfected andinfected fleas by Bartonella henselae analyzed with
ClinProTools.
Mass (m/z) (Da) Bartonella henselae infection status of fleas
7487.86 Ctenocephalides felis infected with Bartonella henselae
5478.5 Ctenocephalides felis infected with Bartonella henselae
5044.17 Ctenocephalides felis infected with Bartonella henselae
5419.73 Ctenocephalides felis control
4132.82 Ctenocephalides felis infected with Bartonella henselae
15023.55 Ctenocephalides felis infected with Bartonella henselae
9941.14 Ctenocephalides felis infected with Bartonella henselae
5206.22 Ctenocephalides felis control
4352.34 Ctenocephalides felis control
7737.4 Ctenocephalides felis infected with Bartonella henselae
7559.54 Ctenocephalides felis infected with Bartonella henselae
9476.91 Ctenocephalides felis infected with Bartonella henselae
4509.22 Ctenocephalides felis infected with Bartonella henselae
2616.18 Ctenocephalides felis infected with Bartonella henselae
6763.08 Ctenocephalides felis infected with Bartonella henselae
7969.85 Ctenocephalides felis infected with Bartonella henselae
7873.37 Ctenocephalides felis infected with Bartonella henselae
4897.31 Ctenocephalides felis infected with Bartonella henselae
13056.87 Ctenocephalides felis control
5923.83 Ctenocephalides felis control
following bacterial injection ofEscherichia coli (XL1 Blue) and Micrococcus luteus (UW-Madi-son strain). These proteins are associated with the immune response of these mosquitoes [31]. We can therefore hypothesize that immune response proteins played a role in allowing MAL-DI-TOF MS to clearly distinguish between negative exposed and control fleas. During this response, some genes coding for the proteins involved in innate immunity are regulated or reduced, which could explain the disappearance of some peaks on the average profile of the control fleas [23].
The microbiome of arthropods is usually different in the field than in lab colonies [32]. It may be questioned if the microbiome of wild fleas might be more extensive and varied and might interfere with the interpretation of the MALDI TOF-MS assay. We can’t exclude the part played by the microbiome in the resulting MALDI TOF-MS spectra. Therefore, it would be interesting to study its impact on the differentiation between Bartonella-infected and unin-fected fleas in future studies.
The one-step detection of the species identity of fleas and their infection status would be revolutionary for medical entomology studies, vector surveillance and movement of pathogens.
Author Contributions
Conceptualization: Basma El Hamzaoui, Didier Raoult, Philippe Parola. Data curation: Basma El Hamzaoui.
Formal analysis: Basma El Hamzaoui. Funding acquisition: Philippe Parola. Investigation: Philippe Parola. Methodology: Basma El Hamzaoui. Resources: Jean-Michel Be´renger.
Software: Maureen Laroche, Lionel Almeras. Supervision: Philippe Parola.
Validation: Philippe Parola.
Writing – original draft: Basma El Hamzaoui.
Writing – review & editing: Basma El Hamzaoui, Maureen Laroche, Lionel Almeras, Philippe Parola.
References
1. Bitam I, Dittmar K, Parola P, Whiting MF, Raoult D. Fleas and flea-borne diseases. Int J Infect Dis. 2010; 14: e667–e676.https://doi.org/10.1016/j.ijid.2009.11.011PMID:20189862
2. Bacot AW, Martin CJ. LXVII. Observations on the mechanism of the transmission of plague by fleas. J Hyg (Lond). 1914; 13: 423–439.
3. Leulmi H, Socolovschi C, Laudisoit A, Houemenou G, Davoust B, Bitam I, et al. Detection of Rickettsia felis, Rickettsia typhi, Bartonella Species and Yersinia pestis in Fleas (Siphonaptera) from Africa. PLoS Negl Trop Dis. 2014; 8: e3152.https://doi.org/10.1371/journal.pntd.0003152PMID:25299702
4. Kernif T, Leulmi H, Socolovschi C, Berenger J-M, Lepidi H, Bitam I, et al. Acquisition and excretion of Bartonella quintana by the cat flea, Ctenocephalides felis felis. Mol Ecol. 2014; 23: 1204–1212.https:// doi.org/10.1111/mec.12663PMID:24400877
5. Coulaud P-J, Lepolard C, Bechah Y, Berenger J-M, Raoult D, Ghigo E. Hemocytes from Pediculus humanus humanus are hosts for human bacterial pathogens. Front Cell Infect Microbiol. 2014; 4: 183.
6. Mathison BA, Pritt BS. Laboratory identification of arthropod ectoparasites. Clin Microbiol Rev. 2014; 27: 48–67.https://doi.org/10.1128/CMR.00008-13PMID:24396136
7. Cuisance D, Antoine Rioux J. Current status of medical and veterinary entomology in France: endan-gered discipline or promising science? Comp Immunol Microbiol Infect Dis. 2004; 27: 377–392.https:// doi.org/10.1016/j.cimid.2004.03.007PMID:15225986
8. Yssouf A, Almeras L, Raoult D, Parola P. Emerging tools for identification of arthropod vectors. Future Microbiol. 2016; 11: 549–566.https://doi.org/10.2217/fmb.16.5PMID:27070074
9. Seng P, Rolain J-M, Fournier PE, La Scola B, Drancourt M, Raoult D. MALDI-TOF-mass spectrometry applications in clinical microbiology. Future Microbiol. 2010; 5: 1733–1754.https://doi.org/10.2217/fmb. 10.127PMID:21133692
10. Yssouf A, Socolovschi C, Leulmi H, Kernif T, Bitam I, Audoly G, et al. Identification of flea species using MALDI-TOF/MS. Comp Immunol Microbiol Infect Dis. 2014; 37: 153–157.https://doi.org/10.1016/j. cimid.2014.05.002PMID:24878069
11. Fotso Fotso A, Mediannikov O, Diatta G, Almeras L, Flaudrops C, Parola P, et al. MALDI-TOF mass spectrometry detection of pathogens in vectors: the Borrelia crocidurae/Ornithodoros sonrai paradigm. PLoS Negl Trop Dis. 2014; 8: e2984.https://doi.org/10.1371/journal.pntd.0002984PMID:25058611
12. Yssouf A, Almeras L, Terras J, Socolovschi C, Raoult D, Parola P. Detection of Rickettsia spp in ticks by MALDI-TOF MS. PLoS Negl Trop Dis. 2015; 9: e0003473.https://doi.org/10.1371/journal.pntd. 0003473PMID:25659152
13. Rolain J-M, Arnoux D, Parzy D, Sampol J, Raoult D. Experimental infection of human erythrocytes from alcoholic patients with Bartonella quintana. Ann N Y Acad Sci. 2003; 990: 605–611. PMID:12860697
14. Helmi K, Barthod F, Me´heut G, Henry A, Poty F, Laurent F, et al. Methods for microbiological quality assessment in drinking water: a comparative study. J Water Health. 2015; 13: 34–41.https://doi.org/10. 2166/wh.2014.056PMID:25719463
15. La Scola B, Fournier PE, Brouqui P, Raoult D. Detection and culture of Bartonella quintana, Serratia marcescens, and Acinetobacter spp. from decontaminated human body lice. J Clin Microbiol. 2001; 39: 1707–1709.https://doi.org/10.1128/JCM.39.5.1707-1709.2001PMID:11325978
16. Angelakis E, Diatta G, Abdissa A, Trape J-F, Mediannikov O, Richet H, et al. Altitude-dependent Barto-nella quintana genotype C in head lice, Ethiopia. Emerg Infect Dis. 2011; 17: 2357–2359.https://doi. org/10.3201/eid1712.110453PMID:22172306
17. Zeaiter Z, Fournier P-E, Raoult D. Genomic variation of Bartonella henselae strains detected in lymph nodes of patients with cat scratch disease. J Clin Microbiol. 2002; 40: 1023–1030.https://doi.org/10. 1128/JCM.40.3.1023-1030.2002PMID:11880432
18. Nebbak A, El Hamzaoui B, Berenger J-M, Bitam I, Raoult D, Almeras L, et al. Comparative analysis of storage conditions and homogenization methods for tick and flea species for identification by MALDI-TOF MS. Med Vet Entomol. 2017;https://doi.org/10.1111/mve.12250PMID:28722283
19. Yssouf A, Almeras L, Berenger J-M, Laroche M, Raoult D, Parola P. Identification of tick species and disseminate pathogen using hemolymph by MALDI-TOF MS. Ticks Tick-Borne Dis. 2015; 6: 579–586.
https://doi.org/10.1016/j.ttbdis.2015.04.013PMID:26051210
20. Yssouf A, Parola P, Lindstro¨m A, Lilja T, L’Ambert G, Bondesson U, et al. Identification of European mosquito species by MALDI-TOF MS. Parasitol Res. 2014; 113: 2375–2378.https://doi.org/10.1007/ s00436-014-3876-yPMID:24737398
21. Dieme C, Yssouf A, Vega-Ru´a A, Berenger J-M, Failloux A-B, Raoult D, et al. Accurate identification of Culicidae at aquatic developmental stages by MALDI-TOF MS profiling. Parasit Vectors. 2014; 7: 544.
https://doi.org/10.1186/s13071-014-0544-0PMID:25442218
22. Laroche M, Be´renger J-M, Gazelle G, Blanchet D, Raoult D, Parola P. MALDI-TOF MS protein profiling for the rapid identification of Chagas disease triatomine vectors and application to the triatomine fauna of French Guiana. Parasitology. 2017; 1–11.https://doi.org/10.1017/S0031182017001342PMID:
28768559
23. Laroche M, Almeras L, Pecchi E, Bechah Y, Raoult D, Viola A, et al. MALDI-TOF MS as an innovative tool for detection of Plasmodium parasites in Anopheles mosquitoes. Malar J. 2017; 16: 5.https://doi. org/10.1186/s12936-016-1657-zPMID:28049524
24. Rothen J, Githaka N, Kanduma EG, Olds C, Pflu¨ger V, Mwaura S, et al. Matrix-assisted laser desorp-tion/ionization time of flight mass spectrometry for comprehensive indexing of East African ixodid tick species. Parasit Vectors. 2016; 9: 151.https://doi.org/10.1186/s13071-016-1424-6PMID:26979606
25. Lafri I, Almeras L, Bitam I, Caputo A, Yssouf A, Forestier C-L, et al. Identification of Algerian Field-Caught Phlebotomine Sand Fly Vectors by MALDI-TOF MS. PLoS Negl Trop Dis. 2016; 10: e0004351.
26. Hoppenheit A, Murugaiyan J, Bauer B, Steuber S, Clausen P-H, Roesler U. Identification of Tsetse (Glossina spp.) using matrix-assisted laser desorption/ionisation time of flight mass spectrometry. PLoS Negl Trop Dis. 2013; 7: e2305.https://doi.org/10.1371/journal.pntd.0002305PMID:23875040
27. Diarra AZ, Almeras L, Laroche M, Berenger J-M, Kone´ AK, Bocoum Z, et al. Molecular and MALDI-TOF identification of ticks and tick-associated bacteria in Mali. PLoS Negl Trop Dis. 2017; 11: e0005762.
https://doi.org/10.1371/journal.pntd.0005762PMID:28742123
28. Rolain J-M, Foucault C, Guieu R, La Scola B, Brouqui P, Raoult D. Bartonella quintana in human eryth-rocytes. Lancet Lond Engl. 2002; 360: 226–228.
29. Chomel BB, Kasten RW, Floyd-Hawkins K, Chi B, Yamamoto K, Roberts-Wilson J, et al. Experimental transmission of Bartonella henselae by the cat flea. J Clin Microbiol. 1996; 34: 1952–1956. PMID:
8818889
30. Bouhsira E, Ferrandez Y, Liu M, Franc M, Boulouis H-J, Biville F. Ctenocephalides felis an in vitro potential vector for five Bartonella species. Comp Immunol Microbiol Infect Dis. 2013; 36: 105–111.
https://doi.org/10.1016/j.cimid.2012.10.004PMID:23200028
31. Paskewitz SM, Shi L. The hemolymph proteome of Anopheles gambiae. Insect Biochem Mol Biol. 2005; 35: 815–824.https://doi.org/10.1016/j.ibmb.2005.03.002PMID:15944078
32. Tandina F, Almeras L, Kone´ AK, Doumbo OK, Raoult D, Parola P. Use of MALDI-TOF MS and culturo-mics to identify mosquitoes and their midgut microbiota. Parasit Vectors. 2016; 9: 495.https://doi.org/ 10.1186/s13071-016-1776-yPMID:27613238