Milk fatty acid profile related to energy balance in dairy cows
Josef Gross
1, Hendrika A van Dorland
2, Rupert M Bruckmaier
2and Frieder J Schwarz
1*
1Department of Animal Sciences, Chair of Animal Nutrition, Technical University of Munich, Liesel-Beckmann-Str. 6, D-85350
Freising-Weihenstephan, Germany
2Veterinary Physiology, Vetsuisse Faculty, University of Bern, Bremgartenstr. 109a, CH-3001 Bern, Switzerland
Received 2 May 2011; accepted for publication 14 July 2011; first published online 16 August 2011
Milk fatty acid (FA) profile is a dynamic pattern influenced by lactational stage, energy balance and dietary composition. In the first part of this study, effects of the energy balance during the proceeding lactation [weeks 1–21 post partum (pp)] on milk FA profile of 30 dairy cows were evaluated under a constant feeding regimen. In the second part, effects of a negative energy balance (NEB) induced by feed restriction on milk FA profile were studied in 40 multiparous dairy cows (20 feed-restricted
and 20 control). Feed restriction (energy balance of 63 MJ NEL/d, restriction of 49 % of energy
requirements) lasted 3 weeks starting at around 100 days in milk. Milk FA profile changed markedly from week 1 pp up to week 12 pp and remained unchanged thereafter. The proportion of saturated FA (predominantly 10:0, 12:0, 14:0 and 16:0) increased from week 1 pp up to week 12 pp, whereas monounsaturated FA, predominantly the proportion of 18:1,9c decreased as NEB in early lactation became less severe. During the induced NEB, milk FA profile showed a similarly directed pattern as during the NEB in early lactation, although changes were less marked for most FA. Milk FA composition changed rapidly within one week after initiation of feed restriction and tended to adjust to the initial composition despite maintenance of a high NEB. C18:1,9c was increased significantly during the induced NEB indicating mobilization of a considerable amount of adipose tissue. Besides 18:1,9c, changes in saturated FA, monounsaturated FA, de-novo synthesized and preformed FA (sum of FA > C16) reflected energy status in dairy cows and indicated the NEB in early lactation as well as the induced NEB by feed restriction.
Keywords: Milk fat, fatty acids, energy balance, dairy cow.
Milk fat is the main component determining energy expenditure for milk production in dairy cows. It consists
almost completely of triglycerides (Moate et al.2007). Due
to proceeding analytical improvements, up to now more than 400 individual fatty acids (FA) in milk fat are
documented (Jensen et al. 1991; Moate et al. 2007).
During the last decades, milk FA composition has gained the interest of manufacturers and consumers as it influences nutritional, physical and flavour properties of dairy products
(Bobe et al.2007). Changes in the degree of FA unsaturation
have an impact on oxidative stability during milk processing
(Kay et al.2005; Glantz et al.2009). The focus of research
regarding the impact of milk FA on human health was especially set on conjugated linoleic acids (CLA) and other
polyunsaturated FA (18:2, 18:3) (e.g. Kelsey et al. 2003;
Palladino et al. 2009). Dietary manipulation to directly
influence the content of these FA is documented in over 100
publications during the last decade (Moate et al.2007). Thus
nutrition is one of the main factors influencing milk FA composition.
Besides diet, lactational stage along with energy balance
of dairy cows have an impact on FA profile in cows’ milk
(Kay et al.2005; Stoop et al.2009). During the first couple of weeks after parturition, the occurrence of a negative energy balance (NEB) is common in dairy cows. The defici-ency of nutrients and energy is compensated by mobilization of body reserves, predominantly adipose tissue associated with the release of FA. During insufficient supply and quality of feed, a NEB may also occur later in lactation as reported for pastured dairy cows averaging 94 days in milk (DIM)
(Leiber et al.2005). The specific effect of a NEB on milk
FA composition was shown in a few earlier studies such
as Luick & Smith (1963), who fasted high-yielding dairy
cows for 5 d to induce a clinical ketosis or Dann et al.
(2005), who enhanced the post partum (pp) NEB by feed
restriction. *For correspondence; e-mail: schwarzf@wzw.tum.de
The focus of the present study is set on the interactions between energy balance and milk FA profile in dairy cows. Contrary to earlier studies, the present study investigated effects of both the NEB in early lactation and a deliberately induced NEB by feed restriction at around 100 DIM.
Materials and Methods Animal trial
Fig. 1shows the experimental schedule of the present study. Detailed information on the animal trial and feeding regimen
is given in Gross et al. (2011). In brief, the study was
conducted with multiparous Holstein dairy cows (3·1 ± 0·2
parities, mean ±SEM) kept in a free stall barn and covered
three experimental periods beginning with parturition. Experimental period 1 (from parturition up to week 12 pp) included 40 cows that were treated similarly. However, only milk samples from 30 out of the 40 cows were obtained for FA analysis at all time points in period 1. In period 2 at around 100 DIM (week 14 pp), cows were divided equally into either a control (CON; n = 20) or a restriction group (RES;
n= 20) with feed restriction for 3 weeks (weeks 15 to 17 pp,
Fig. 1). After 3 weeks of the deliberately induced NEB, period
3 (weeks 18 to 21 pp,Fig. 1) started, where RES cows were
(re)fed similarly to CON cows. Throughout the study, all ani-mals, except RES cows in feed restriction, had free access to a partial mixed ration 1 (PMR 1; 33·7 % grass silage, 44·9 % corn silage, 6·5 % hay and 14·9 % concentrate on a DM
basis). Intake of PMR was recorded individually by troughs connected to electronic balances. When milk yield was above 21 kg/d, additional concentrate (CONC, based on barley, wheat, corn kernels, soybean meal, dried sugar beet pulp with molasses) including a vitamin-mineral premix was fed individually according to milk yield in transponder feeding stations (0·4 kg CONC/kg milk; maximum of 8·9 kg CONC/d). In order to induce an energy deficiency of at least 30 % of cows’ requirements at the start of period 2, RES cows received a limited amount of a similar diet as the CON cows, but mixed with an additional 25 % of hay (PMR 2) and a limited amount of CONC (0·4 kg/d). Nutrient values of PMR 1, PMR 2 and CONC are described in Gross et al. (2011).
Determination of energy balance
Individual feed intake (PMR and CONC) and milk yield were recorded daily, body weight weekly. Components of the diets were analysed for crude ash, crude fibre, crude protein and crude fat according to the Weende analysis (Naumann
et al.2000) and from that their energy content was
calcul-ated according to the German Society of Nutrition
Physiology (GfE, 2001). The energy content of PMR 1,
PMR 2 and CONC was calculated by multiplying the energy density of the single components with their relative pro-portion in the diets. Energy content of milk as well as the energetic requirement for maintenance were determined
according to GfE (2001). The difference between energy
Fig. 1. Experimental design. † Partial mixed ration ‡ Concentrate § Control group ¶ Feed-restricted group †† Negative energy balance
intake by feed and energy expenditure for maintenance and milk production (net energy lactation) results in the energy balance of the individual cow.
Analysis of milk composition, and FA composition of milk and diets
After parturition, cows were milked twice daily (5·00 and 15·00) and milk yield was recorded. Milk samples were pooled once per week from two consecutive milkings, Monday evening and Tuesday morning. Obtained milk aliquots were analysed for milk fat, protein and lactose by an infrared-spectrophotometer (MilkoScan-FT-6000, Foss Analytical A/S, Hillerød, Denmark) in the laboratory of the Milchprüfring Bayern e. V., Wolnzach, Germany. A second
aliquot was stored at 20 °C until analysis for FA
com-position. Milk FA composition was determined in weeks 1, 4, 6 and 12 pp of period 1, weekly during period 2 and in weeks 1, 2 and 4 of period 3.
Milk fat was extracted according to Bligh & Dyer (1959),
modified by Hallermayer (1976). Total fat from feed samples
was extracted according to Naumann et al. (2000). FA
composition of milk and feed samples was determined using FA methyl esters (FAME) prepared by transesterifica-tion with trimethylsulphonium hydroxide (TMSH). FAME were injected into a gas chromatograph (GC 6890, Agilent Technologies, Waldbronn, Germany) with a
flame-ionization detector and a DB23 column (Agilent
Technologies, Waldbronn, Germany; 60 m × 0·25 mm
inner diameter, 0·25μm film). The carrier gas was hydrogen
(constant flow at 1·0 ml/min). Samples were injected by split injection (split ratio 1:100). The oven temperature was increased from 50 °C to 175 °C at 5 deg C per min, from 175 °C to 220 °C at 3·3 deg C per min, held for 7·25 min, increased from 220 °C to 250 °C at 10 deg C per min and held for 5 min. The detector temperature was 260 °C. FA were quantified with Chromeleon 6·8 Chromatography Software (Dionex, Sunnyvale CA, USA) using a FAME mix (Sigma Aldrich, St. Louis MO, USA) as standard. FA
com-position of PMR 1, PMR 2 and CONC is shown inTable 1.
Statistical analysis
Data presented in text and tables are means ±SEM of
individual measurements in each cow. Relations between energy balance and FA were expressed by the Pearson correlation coefficient. Changes in energy balance, feed intake, milk yield, milk composition and milk FA profile over time during lactation and feed restriction with subsequent realimentation were evaluated by a mixed model in SAS, version 9.2 (SAS Institute, Cary NC, USA) with group, week and the group × week interaction as fixed effect. Differences over time and within groups during feed restriction (period 2) and realimentation (period 3) were detected by Bonferroni’s t test. P values <0·05 were considered to be significant.
Results and Discussion
Changes in milk composition and milk FA profile with altering energy balance post partum
Data on energy balance, feed intake, milk yield, milk
composition and FA profile are shown inTables 2and3.
Lactational stage clearly affected daily milk yield and milk composition. Daily milk yield increased up to week 6 pp and
declined thereafter (Table 2). Milk fat and protein contents
decreased from week 1 pp up to week 6 pp and slightly increased thereafter, whereas lactose content was relatively
constant from week 4 pp onwards (Table 2). With
progres-sing lactation and improvement of energy balance through increasing feed intake, especially milk FA profile markedly
changed (Table 3). Energy balance in dairy cows was most
negative in week 1 pp and improved with increasing feed intake, but was still negative in week 6 pp (Table 2). In order to compensate the insufficient energy intake pp, consider-able amounts of body fat are mobilized resulting in elevated plasma concentrations of non-esterified FA (NEFA) and beta-hydroxybutyrate (BHBA). During the NEB in early lactation, plasma glucose concentration in the present study showed a nadir of 3·30 ± 0·04 mmol/l in week 2 pp, whereas plasma concentrations were highest for NEFA in week 2 pp (0·90 ± 0·06 mmol/l) and for BHBA in week 3 pp
(0·98 ± 0·14 mmol/l; Gross et al.2011). After the observed
peak of lactation, energy requirements could be met by consumed feed resulting in a positive energy balance.
Basically, milk FA can be derived from four major pathways: the diet, the mammary gland (de-novo synthesis), the rumen (biohydrogenation, bacterial degradation and
synthesis), and body fat mobilization (Stoop et al. 2009).
Changes in milk FA composition during lactation originate from altered activities in these pathways (Van Knegsel et al.
2005; Stoop et al.2009).
For the evaluation of changes in milk composition and milk FA profile in the present study with altering energy balance pp depending on the same feeding regimen, data Table 1. Fatty acid (FA) composition (g/100 g of fatty acid methyl esters, FAME) of experimental diets and concentrate (CONC) Crude fat (g/kg DM) PMR† 1 PMR 2 CONC‡ 30 23 21 FA (g/100 g FAME) 14:0 0·50 0·65 0·19 16:0 16·93 19·97 27·80 16:1,9c 0·28 0·39 0·16 18:0 2·72 2·57 4·18 18:1,9t 0·10 0·12 0·08 18:1,9c 15·90 13·32 20·49 18:1,11c 1·02 0·92 1·47 18:2,9c,12c 37·57 33·36 38·70 18:3,9c,12c,15c 18·59 21·33 2·66
Others and unidentified peaks 6·39 7·38 4·26
†Partial mixed ration ‡Concentrate
from all animals in period 1 and CON group in periods 2 and 3 were evaluated in order to investigate the effect of continuous lactation. In the present study, most changes in milk FA profile took place during the observed NEB from weeks 1 to 6 pp, while FA composition was relatively con-stant between weeks 12 and 21 pp. FA up to 16:0 showed lowest proportions in week 1 pp that increased to relatively
constant proportions from week 12 onwards (Table 3). These
findings agree with earlier studies (Stull et al. 1966;
Palmquist et al. 1993; Kay et al.2005; Garnsworthy et al.
2006). Confirming results of Stoop et al. (2009), saturated FA (SFA), especially 16:0 increased from weeks 1 to 12 pp in the
present study (Fig. 2), while monounsaturated FA (MUFA),
mainly represented by 18:1,9c decreased until week 12 pp
with improving energy balance (Table 2). The proportion of
polyunsaturated FA (PUFA) was relatively constant from
week 1 up to week 21 pp (Table 3). Due to the increased
adipose tissue mobilization during the NEB in early lac-tation, preformed FA concentrations (sum of FA > C16) were greatest in week 1 pp and decreased in a similar pattern to that reported by Kay et al. (2005). Oleic acid (18:1,9c) is the predominant FA in adipocytes and primarily released
through lipolysis during NEB (Rukkwamsuk et al. 2000).
Plasma NEFA and triglycerides are utilized by the mammary
gland for milk FA synthesis (Moore & Christie,1979). The
high transfer rate of 18:1,9c from plasma into milk fat
(Tyburczy et al.2008) confirms the elevated proportion of
18:1,9c in milk fat during the NEB pp in the present study. Especially long-chain FA are derived from plasma and incorporated into milk fat (Palmquist et al.1993) and inhibit the de-novo synthesis of short-chain FA by the mammary
gland (Bauman & Davis, 1974). The observed increase in
short-chain FA with progressing lactation in the present study is consistent with the decreasing adipose tissue mobilization
at around weeks 4–6 pp (Garnsworthy & Huggett, 1992;
Palmquist et al.1993).
Contrary to the findings of Stoop et al. (2009), trans FA
slightly increased with improved energy balance of dairy cows in the present study (Table 3). The proportion of CLA in milk fat remained constant from week 1 to week 12 pp and increased slightly thereafter up to week 21 pp. Milk FA from
de-novo synthesis (4C14 and part of C16) in the present
study increased from week 1 pp up to week 12 pp (Fig. 2) in
agreement with Palmquist et al. (1993) and Kay et al. (2005). Although the FA synthesized de novo comprise approxi-mately 40 % by weight over the entire lactation, preformed FA contribute a larger portion of the total FA in early lactation
(Kay et al.2005). Percentage of preformed FA decreased up
to week 12 pp in the present study. Thereafter milk com-position and milk FA profile were stable until the end of the
study. Garnsworthy et al. (2006) concluded that stage of
lactation does not affect the relative incorporation of de-novo synthesized and preformed FA when the composition of diets remains constant. Because of the same feeding regi-men in the present study, changes in milk FA profile regarding de-novo synthesized and preformed FA therefore reflect changes in energy balance of dairy cows.
Changes in milk and milk FA composition during feed restriction and subsequent realimentation
Due to feed restriction in period 2, RES cows experienced a significant NEB in weeks 15 to 17 pp being even more in-tense compared with the NEB occurring in the first 6 weeks Table 2. Daily milk yield and milk composition in weeks 1, 4, 6, 12 (all animals), 17 and 21 (control group) post partum. Values without a common superscript letter are significantly different (P < 0·05)
Week 1 Week 4 Week 6 Week 12 Week 17 Week 21
(n = 30) (n = 30) (n = 30) (n = 30) (n = 20) (n = 20) Feed intake PMR†1, kg DM/d 13·7b 14·3b 14·3b 17·1a 16·9a 17·8a ± 0·3 ± 0·3 ± 0·3 ± 0·4 ± 0·4 ± 0·5 CONC‡, kg DM/d 1·6e 5·7b 7·6a 5·8b 4·7c 3·6d ± 0·0 ± 0·1 ± 0·2 ± 0·3 ± 0·5 ± 0·5 Energy balance EB, MJ NEL/d 45·0d 24·8c 9·5b 9·1a 8·9a 12·2a ± 3·9 ± 3·2 ± 3·1 ± 2·7 ± 4·7 ± 3·1 Milk, kg/d 27·4c 37·5a 39·3a 33·5b 29·7c 27·6c ± 0·8 ± 0·8 ± 0·9 ± 1·2 ± 1·3 ± 1·2 Fat-corrected milk, kg/d 34·1b 40·6a 40·3a 34·9b 31·9bc 29·8c ± 1·2 ± 1·1 ± 1·1 ± 1·2 ± 1·4 ± 1·2 Fat, % 5·60a 4·56b 4·17c 4·31bc 4·48bc 4·54b ± 0·14 ± 0·10 ± 0·09 ± 0·10 ± 0·08 ± 0·09 Protein, % 4·12a 3·05d 3·09d 3·32c 3·43bc 3·50b ± 0·06 ± 0·04 ± 0·04 ± 0·05 ± 0·06 ± 0·05 Lactose, % 4·46b 4·77a 4·79a 4·76a 4·75a 4·72a ± 0·03 ± 0·02 ± 0·02 ± 0·02 ± 0·02 ± 0·03
†Partial mixed ration ‡Concentrate
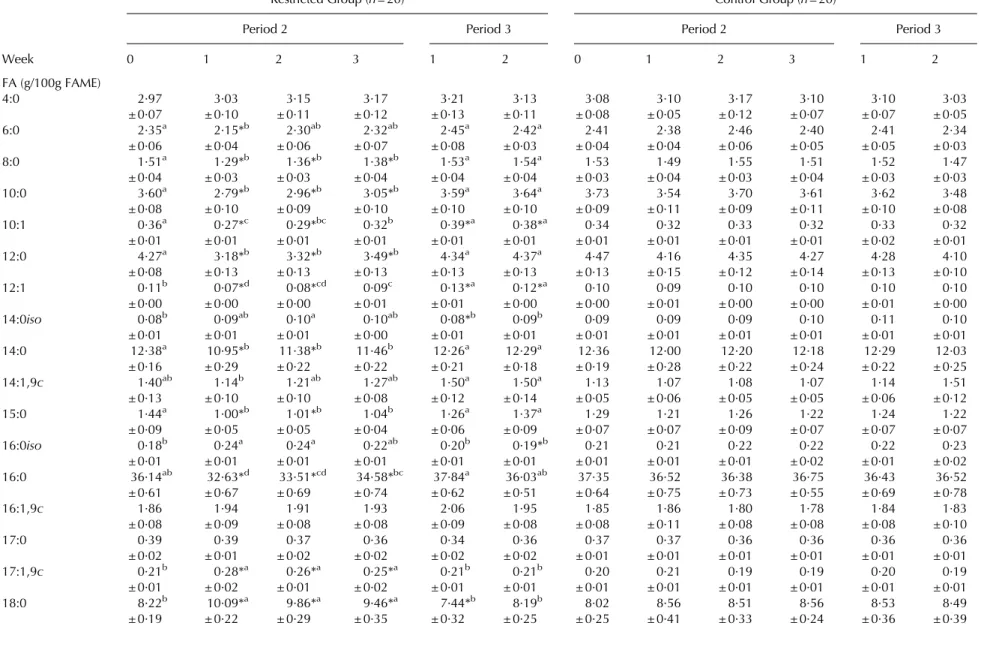
Table 3. Milk fatty acid (FA) composition (g/100 g of fatty acid methyl esters, FAME) in weeks 1, 4, 6, 12 (all animals), 17 and 21 (control group) post partum. Values without a common superscript letter are significantly different (P < 0·05)
Week 1 Week 4 Week 6 Week 12 Week 17 Week 21
(n = 30) (n = 30) (n = 30) (n = 30) (n = 20) (n = 20) FA (g/100 FAME) 4:0 3·85a 3·54b 3·38b 3·14c 3·10c 3·15c ± 0·12 ± 0·11 ± 0·08 ± 0·07 ± 0·07 ± 0·07 6:0 2·21c 2·41ab 2·55a 2·40abc 2·39abc 2·34bc ± 0·11 ± 0·08 ± 0·05 ± 0·06 ± 0·04 ± 0·04 8:0 1·16c 1·39b 1·58a 1·50ab 1·51ab 1·49ab ± 0·08 ± 0·06 ± 0·04 ± 0·04 ± 0·03 ± 0·02 10:0 2·24c 2·82b 3·52a 3·52a 3·61a 3·56a ± 0·18 ± 0·16 ± 0·13 ± 0·10 ± 0·08 ± 0·06 10:1 0·12d 0·21c 0·27b 0·31ab 0·32a 0·34a ± 0·01 ± 0·01 ± 0·01 ± 0·01 ± 0·01 ± 0·01 12:0 2·37c 2·96b 3·83a 4·07a 4·27a 4·26a ± 0·20 ± 0·18 ± 0·18 ± 0·13 ± 0·11 ± 0·08 12:1 0·03e 0·05d 0·07c 0·09b 0·10ab 0·10a ± 0·00 ± 0·00 ± 0·01 ± 0·00 ± 0·00 ± 0·00 14:0iso 0·07b 0·06b 0·07b 0·08b 0·10a 0·11a ± 0·00 ± 0·01 ± 0·01 ± 0·01 ± 0·00 ± 0·01 14:0 8·82c 9·75b 11·36a 12·06a 12·18a 12·22a ± 0·48 ± 0·32 ± 0·28 ± 0·23 ± 0·17 ± 0·14 14:1,9c 0·62b 1·58a 1·00a 1·17a 1·07a 1·36a ± 0·04 ± 0·04 ± 0·08 ± 0·12 ± 0·05 ± 0·13 15:0 0·64c 0·74c 0·98b 1·15ab 1·22a 1·17a ± 0·03 ± 0·05 ± 0·09 ± 0·07 ± 0·04 ± 0·04 16:0iso 0·18c 0·17c 0·17c 0·20bc 0·22ab 0·24a ± 0·01 ± 0·01 ± 0·01 ± 0·01 ± 0·01 ± 0·01 16:0 28·77c 29·62c 31·38b 35·62a 36·75a 36·23a ± 0·61 ± 0·63 ± 0·64 ± 0·70 ± 0·49 ± 0·39 16:1,9c 2·31a 2·27a 1·93b 1·84b 1·78b 1·82b ± 0·16 ± 0·14 ± 0·12 ± 0·08 ± 0·06 ± 0·05 17:0 0·46a 0·38b 0·37b 0·38b 0·36b 0·34b ± 0·01 ± 0·02 ± 0·02 ± 0·02 ± 0·01 ± 0·01 17:1,9c 0·37a 0·35a 0·26b 0·22bc 0·19c 0·19c ± 0·02 ± 0·02 ± 0·02 ± 0·02 ± 0·01 ± 0·01 18:0 12·88a 10·87b 10·17b 8·92c 8·56c 8·54c ± 0·33 ± 0·29 ± 0·36 ± 0·28 ± 0·22 ± 0·17 18:1,9t 0·40 0·39 0·42 0·42 0·40 0·42 ± 0·03 ± 0·02 ± 0·01 ± 0·01 ± 0·01 ± 0·01 18:1,11t 1·01bc 0·94c 1·06bc 1·11ab 1·15ab 1·23a ± 0·09 ± 0·05 ± 0·04 ± 0·05 ± 0·04 ± 0·04 18:1,9c 25·75a 23·96a 19·89b 16·16c 15·00c 15·30c ± 1·22 ± 1·05 ± 0·89 ± 0·69 ± 0·46 ± 0·24 18:1,11c 1·06a 1·01ab 0·92abc 0·76bcd 0·68cd 0·63d ± 0·09 ± 0·09 ± 0·07 ± 0·08 ± 0·06 ± 0·05 18:1,12c 0·24c 0·25c 0·26bc 0·26bc 0·29ab 0·29a ± 0·01 ± 0·01 ± 0·01 ± 0·01 ± 0·01 ± 0·01 18:2,9c,12c 1·95 1·89 1·94 1·84 1·79 1·77 ± 0·05 ± 0·06 ± 0·06 ± 0·05 ± 0·04 ± 0·04 18:3,9c,12c,15c 0·38ab 0·34bc 0·35bc 0·33c 0·40a 0·39a ± 0·01 ± 0·01 ± 0·01 ± 0·01 ± 0·01 ± 0·01 18:2,9c,11t 0·35b 0·34b 0·34b 0·37b 0·43a 0·48a ± 0·02 ± 0·02 ± 0·01 ± 0·01 ± 0·01 ± 0·02 18:2,10t,12c 0·04 0·03 0·03 0·02 0·03 0·03 ± 0·01 ± 0·01 ± 0·01 ± 0·01 ± 0·01 ± 0·01
of lactation (Tables 2 and 4). Besides energy supply the dietary composition also was changed in the group of RES cows during period 2 as the amount of the PMR and the concentrate was limited. Additionally, PMR 2 fed to RES cows included more hay than the PMR 1 fed to CON cows. Despite the higher induced NEB by feed restric-tion compared with the NEB in early lactarestric-tion, plasma NEFA and BHBA concentrations were elevated only moderately in RES cows compared with CON cows during period 2 (0·23 ± 0·02 v. 0·14 ± 0·01 mmol/l and 0·62 ± 0·03 v. 0·52 ± 0·02 mmol/l, respectively).
Milk fat content was elevated during feed restriction for
RES cows (Table 4). Changes in milk yield and composition
have been discussed in Gross et al. (2011). Data on the effect of energy balance on milk fat composition are scarce (Stoop
et al. 2009). In the present study, milk FA profile of CON
cows was stable during the whole time of periods 2 and
3. For RES cows, the proportion of most FA416:0 (e.g. 6:0,
10:0, 10:1, 12:0, 14:0, 16:0) was decreased during the NEB induced by feed restriction compared with the respective initial values, whereas preformed FA, especially 17:1,9c, 18:0 and 18:1,9c arising from body fat mobilization
in-creased markedly during feed restriction (Table 5). These
changes occurred rapidly within the first week of feed re-striction (on average 3 d distance between the start of feed restriction and the next milking sample) and disappeared completely within one week of realimentation (4 d on av-erage). The proportion of CLA in milk fat of RES cows was elevated at the start of feed restriction and adjusted im-mediately to initial values (Table 5). The rise of CLA in RES cows may be attributed to the changed diet towards less concentrate and more roughage. Despite the maintenance of the deliberately induced NEB by feed restriction at a relatively constant level, FA showed a tendency during the NEB to adjust towards the initial levels with progressing feed
restriction. The pattern of decreasing short-chain FA and increase of long-chain FA during an induced NEB was reported in an earlier study of Luick & Smith (1963). During feed restriction (period 2), SFA decreased, while MUFA (especially 18:1,9c) increased for RES cows compared with
CON cows (Fig. 3). PUFA were stable during period 2 and
the following realimentation period in RES cows (Table 5).
Luick & Smith (1963) examined whether changes in
milk FA composition during feed restriction are caused by a decreased synthesis of short-chain FA or by an increased incorporation of long-chain FA absorbed from plasma. Ac-cording to Luick & Smith (1963), the failure to utilize beta-hydroxybutyrate occurs when its concentration in plasma is elevated, i.e. during fasting and ketosis. This in turn, ac-counts for the relatively high levels of oleic acid found in milk fat of fasting and ketotic cows (Luick & Smith,1963) as observed in the present study. Although less in their extent, milk FA in the present study clearly showed a similar pattern during a deliberately induced NEB by feed restriction at around 100 DIM compared with the NEB in early lactation. Compared with milk of dairy cows in positive energy balance (week 14 pp), proportions for single FA (e.g. 17:1,9c; 18:1,9c) were changed up to 80 % during the NEB in early lactation and during the deliberately induced NEB by feed restriction.
Van Haelst et al. (2008) determined whether
concen-trations of specific FA in milk fat are suitable for the early detection of subclinical ketosis as mobilization of adipose
tissue precedes development of ketosis (Reist et al. 2003).
Van Haelst et al. (2008) suggested the elevated proportion of 18:1,9c as an interesting trait for prediction of subclinical ketosis, particularly since this FA was elevated in milk fat before diagnosis of ketosis. As milk FA changed with altering energy balance, it is obvious to identify milk FA indicating a NEB in dairy cows independent of their lactational stage. Therefore, correlations between milk FA and the energy balance of all cows were calculated. Correlation over all cows between energy balance and the proportion of 18:1,9c was 0·77. We wanted to investigate whether the correlation is higher in cows with a higher NEB. Thus the correlation between energy balance and the proportion of 18:1,9c in milk fat of 5 cows with the most negative EB in week 1 pp ( 80·2 MJ NEL/d) was calculated, but did not show a closer relationship (r = 0·62). The correlation between EB and 18:1,9c for RES cows with the highest NEB in the first week of feed restriction ( 83·2 MJ NEL/d) was 0·92. From these results, an elevated proportion of 18:1,9c in milk fat can be confirmed to be a suitable marker for a NEB. The correlation between energy balance and a single FA during the NEB in early lactation and during the deliberately induced NEB ranged from 0·71 to 0·96. However, the low proportion and relatively high variation in changed FA (e.g. 11:0; 12:1; Tables 3 and 5) restrict the predictive value of these FA to indicate a NEB although changes were sig-nificant between RES and CON cows. On the contrary, the correlation between energy balance and groups of FA was higher in cows with a more intense NEB during feed Week of lactation 1 3 5 7 9 11 13 15 17 19 21 FA (g/100g FA M E ) 0 10 20 30 40 C16 <C16 C18:1,9c
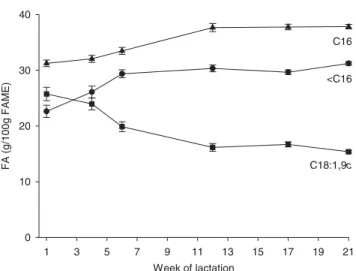
Fig. 2. Proportions (g/100 g of fatty acid methyl esters, FAME) of de-novo synthesized FA (< C16; circles), C16 FA (triangles) and C18:1,9c (squares) in milk fat during the first 21 weeks of lactation in dairy cows.
Table 4. Milk yield and milk composition for feed-restricted (RES) and control cows (CON) during feed restriction and realimentation. For differences over time within group, values without a common superscript are significantly different (P > 0·05), significant differences between RES- and CON-group within week are marked with * (P < 0·05)
Week
Restricted Group (n = 20) Control Group (n = 20)
Period 2 Period 3 Period 2 Period 3
0 1 2 3 1 2 0 1 2 3 1 2 Feed intake PMR†, kg DM/d 17·0a 9·4*c 9·6*c 9·8*c 15·6*b 16·9a 16·4ab 15·6b 17·3a 16·9a 16·3ab 17·0a ± 0·7 ± 0·3 ± 0·3 ± 0·3 ± 0·4 ± 0·5 ± 0·5 ± 0·3 ± 0·5 ± 0·4 ± 0·4 ± 0·5 CONC‡, kg DM/d 5·5a 1·2*d 0·4*e 0·4*e 2·9*c 4·2b 5·4 5·2 4·8 4·7 4·4 4·3 Energy status ± 0·5 ± 0·1 ± 0·0 ± 0·0 ± 0·3 ± 0·4 ± 0·5 ± 0·5 ± 0·5 ± 0·5 ± 0·4 ± 0·5 EB§, MJ NEL/d 9·9a 68·0*c 64·7*c 61·8*c 4·6*b 6·2a 3·7 0·8 8·1 8·9 5·8 9·9 ± 2·8 ± 2·8 ± 3·9 ± 4·2 ± 2·7 ± 3·3 ± 2·9 ± 3·2 ± 3·8 ± 4·7 ± 3·5 ± 3·6 Milk, kg/d 33·4a 29·3bc 27·9bc 27·2c 28·3bc 30·4ab 32·3 31·1 31·1 29·7 28·8 28·8 ± 1·2 ± 1·1 ± 1·0 ± 0·9 ± 1·1 ± 1·3 ± 1·5 ± 1·4 ± 1·3 ± 1·3 ± 1·1 ± 1·3 FCM¶, kg/d 33·6a 31·8a 29·0*bc 28·6*c 28·9bc 31·3ab 34·2a 32·8ab 33·0ab 31·9ab 30·8ab 30·6b ± 1·0 ± 1·0 ± 0·9 ± 0·9 ± 1·1 ± 1·1 ± 1·2 ± 1·4 ± 1·2 ± 1·4 ± 1·1 ± 1·2 Fat, % 4·11*b 4·64a 4·31ab 4·38ab 4·19b 4·28ab 4·50 4·41 4·45 4·48 4·49 4·48 ± 0·13 ± 0·17 ± 0·12 ± 0·14 ± 0·13 ± 0·15 ± 0·19 ± 0·11 ± 0·11 ± 0·08 ± 0·13 ± 0·13 Protein, % 3·38ab 3·21*bc 3·18*c 3·18*c 3·33abc 3·43a 3·41 3·41 3·41 3·43 3·43 3·48 ± 0·06 ± 0·06 ± 0·06 ± 0·07 ± 0·05 ± 0·05 ± 0·06 ± 0·05 ± 0·05 ± 0·06 ± 0·06 ± 0·06 Lactose, % 4·80a 4·79a 4·80a 4·75ab 4·71b 4·73b 4·74 4·77 4·76 4·75 4·74 4·73 ± 0·02 ± 0·02 ± 0·02 ± 0·02 ± 0·02 ± 0·03 ± 0·04 ± 0·03 ± 0·03 ± 0·02 ± 0·03 ± 0·03
†Partial mixed ration ‡Concentrate § Energy balance ¶ Fat-corrected milk Milk fatty acids related to energy bal ance 485 . https://doi.org/10.1017/S0022029911000550 https:/www.cambridge.org/core
. University of Basel Library
, on
30 May 2017 at 18:05:56
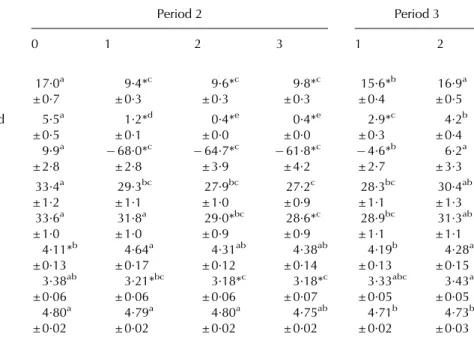
Table 5. Milk fatty acid (FA) composition (g/100 g fatty acid methyl esters, FAME) for feed-restricted (RES) and control cows (CON) during feed restriction and realimentation. For differences over time within group, values without a common superscript are significantly different (P > 0·05), significant differences between RES- and CON-group within week are marked with * (P < 0·05)
Week
Restricted Group (n = 20) Control Group (n = 20)
Period 2 Period 3 Period 2 Period 3
0 1 2 3 1 2 0 1 2 3 1 2 FA (g/100g FAME) 4:0 2·97 3·03 3·15 3·17 3·21 3·13 3·08 3·10 3·17 3·10 3·10 3·03 ± 0·07 ± 0·10 ± 0·11 ± 0·12 ± 0·13 ± 0·11 ± 0·08 ± 0·05 ± 0·12 ± 0·07 ± 0·07 ± 0·05 6:0 2·35a 2·15*b 2·30ab 2·32ab 2·45a 2·42a 2·41 2·38 2·46 2·40 2·41 2·34 ± 0·06 ± 0·04 ± 0·06 ± 0·07 ± 0·08 ± 0·03 ± 0·04 ± 0·04 ± 0·06 ± 0·05 ± 0·05 ± 0·03 8:0 1·51a 1·29*b 1·36*b 1·38*b 1·53a 1·54a 1·53 1·49 1·55 1·51 1·52 1·47 ± 0·04 ± 0·03 ± 0·03 ± 0·04 ± 0·04 ± 0·04 ± 0·03 ± 0·04 ± 0·03 ± 0·04 ± 0·03 ± 0·03 10:0 3·60a 2·79*b 2·96*b 3·05*b 3·59a 3·64a 3·73 3·54 3·70 3·61 3·62 3·48 ± 0·08 ± 0·10 ± 0·09 ± 0·10 ± 0·10 ± 0·10 ± 0·09 ± 0·11 ± 0·09 ± 0·11 ± 0·10 ± 0·08 10:1 0·36a 0·27*c 0·29*bc 0·32b 0·39*a 0·38*a 0·34 0·32 0·33 0·32 0·33 0·32 ± 0·01 ± 0·01 ± 0·01 ± 0·01 ± 0·01 ± 0·01 ± 0·01 ± 0·01 ± 0·01 ± 0·01 ± 0·02 ± 0·01 12:0 4·27a 3·18*b 3·32*b 3·49*b 4·34a 4·37a 4·47 4·16 4·35 4·27 4·28 4·10 ± 0·08 ± 0·13 ± 0·13 ± 0·13 ± 0·13 ± 0·13 ± 0·13 ± 0·15 ± 0·12 ± 0·14 ± 0·13 ± 0·10 12:1 0·11b 0·07*d 0·08*cd 0·09c 0·13*a 0·12*a 0·10 0·09 0·10 0·10 0·10 0·10 ± 0·00 ± 0·00 ± 0·00 ± 0·01 ± 0·01 ± 0·00 ± 0·00 ± 0·01 ± 0·00 ± 0·00 ± 0·01 ± 0·00 14:0iso 0·08b 0·09ab 0·10a 0·10ab 0·08*b 0·09b 0·09 0·09 0·09 0·10 0·11 0·10 ± 0·01 ± 0·01 ± 0·01 ± 0·00 ± 0·01 ± 0·01 ± 0·01 ± 0·01 ± 0·01 ± 0·01 ± 0·01 ± 0·01 14:0 12·38a 10·95*b 11·38*b 11·46b 12·26a 12·29a 12·36 12·00 12·20 12·18 12·29 12·03 ± 0·16 ± 0·29 ± 0·22 ± 0·22 ± 0·21 ± 0·18 ± 0·19 ± 0·28 ± 0·22 ± 0·24 ± 0·22 ± 0·25 14:1,9c 1·40ab 1·14b 1·21ab 1·27ab 1·50a 1·50a 1·13 1·07 1·08 1·07 1·14 1·51 ± 0·13 ± 0·10 ± 0·10 ± 0·08 ± 0·12 ± 0·14 ± 0·05 ± 0·06 ± 0·05 ± 0·05 ± 0·06 ± 0·12 15:0 1·44a 1·00*b 1·01*b 1·04b 1·26a 1·37a 1·29 1·21 1·26 1·22 1·24 1·22 ± 0·09 ± 0·05 ± 0·05 ± 0·04 ± 0·06 ± 0·09 ± 0·07 ± 0·07 ± 0·09 ± 0·07 ± 0·07 ± 0·07 16:0iso 0·18b 0·24a 0·24a 0·22ab 0·20b 0·19*b 0·21 0·21 0·22 0·22 0·22 0·23 ± 0·01 ± 0·01 ± 0·01 ± 0·01 ± 0·01 ± 0·01 ± 0·01 ± 0·01 ± 0·01 ± 0·02 ± 0·01 ± 0·02 16:0 36·14ab 32·63*d 33·51*cd 34·58*bc 37·84a 36·03ab 37·35 36·52 36·38 36·75 36·43 36·52 ± 0·61 ± 0·67 ± 0·69 ± 0·74 ± 0·62 ± 0·51 ± 0·64 ± 0·75 ± 0·73 ± 0·55 ± 0·69 ± 0·78 16:1,9c 1·86 1·94 1·91 1·93 2·06 1·95 1·85 1·86 1·80 1·78 1·84 1·83 ± 0·08 ± 0·09 ± 0·08 ± 0·08 ± 0·09 ± 0·08 ± 0·08 ± 0·11 ± 0·08 ± 0·08 ± 0·08 ± 0·10 17:0 0·39 0·39 0·37 0·36 0·34 0·36 0·37 0·37 0·36 0·36 0·36 0·36 ± 0·02 ± 0·01 ± 0·02 ± 0·02 ± 0·02 ± 0·02 ± 0·01 ± 0·01 ± 0·01 ± 0·01 ± 0·01 ± 0·01 17:1,9c 0·21b 0·28*a 0·26*a 0·25*a 0·21b 0·21b 0·20 0·21 0·19 0·19 0·20 0·19 ± 0·01 ± 0·02 ± 0·01 ± 0·02 ± 0·01 ± 0·01 ± 0·01 ± 0·01 ± 0·01 ± 0·01 ± 0·01 ± 0·01 18:0 8·22b 10·09*a 9·86*a 9·46*a 7·44*b 8·19b 8·02 8·56 8·51 8·56 8·53 8·49 486 J G ross and others . https://doi.org/10.1017/S0022029911000550 https:/www.cambridge.org/core
. University of Basel Library
, on
30 May 2017 at 18:05:56
restriction that ranged from 0·92 up to 0·98 for SFA, MUFA (predominantly 18:1,9c), de-novo synthesized (sum of FA < C16, r = 0·94) and preformed FA (sum of FA > C16, r= 0·92). The higher proportion of these summarized FA in milk fat makes their changes a more appropriate tool reflecting energy balance in dairy cows compared with a single FA represented at a low concentration.
Conclusions
Post-partum changes in milk FA profile in the present study followed previous findings. Short- and medium-chain FA up to C16 increased with the decreasing NEB pp, while long-chain FA, especially 18:1,9c decreased as mobilization of body fat reserves declined. The responses of FA profiles of cows’ milk due to a NEB at two lactational stages in the
present study– the NEB in early lactation and the
deliber-ately induced NEB by feed restriction– was similarly
direc-ted. Despite the maintenance of a high NEB during the feed restriction period, changes in milk FA profile were less pronounced compared with changes during the NEB in early lactation and tended to adjust to the initial composition. However, milk FA profile changed within a few days after initiation of the deliberately induced NEB and showed no more differences within the first week of realimentation compared with control cows. For the dietary composition and feeding regimen in the present study, the close rela-tionship with energy balance makes changes in 18:1,9c as well as in groups of FA (SFA, MUFA, de-novo synthesized and preformed FA) suitable indicators of the energy balance in dairy cows. 18:1,9 t 0·41 ab 0·43* a 0·44 a 0·43 ab 0·39 b 0·42 ab 0·39 0·39 0·40 0·40 0·41 0·41 ± 0·01 ± 0·01 ± 0·01 ± 0·01 ± 0·01 ± 0·01 ± 0·01 ± 0·01 ± 0·01 ± 0·01 ± 0·01 ± 0·01 18:1,11 t 1·10 ab 1·18 ab 1·21 a 1·20 a 1·05 b 1·10 ab 1·07 b 1·06 b 1·13 ab 1·15 ab 1·18 ab 1·20 a ± 0·05 ± 0·05 ± 0·06 ± 0·05 ± 0·05 ± 0·05 ± 0·05 ± 0·05 ± 0·05 ± 0·04 ± 0·05 ± 0·06 18:1,9 c 15·27 c 20·89* a 19·29* ab 18·42* b 14·58 c 15·27 c 14·42 15·69 15·01 14·99 15·04 15·07 ± 0·25 ± 0·85 ± 0·61 ± 0·67 ± 0·43 ± 0·36 ± 0·34 ± 0·70 ± 0·45 ± 0·34 ± 0·36 ± 0·51 18:1, c11 0·65 ab 0·73 a 0·69 ab 0·62 bc 0·51 d 0·56 cd 0·68 0·71 0·70 0·68 0·56 0·65 ± 0·04 ± 0·04 ± 0·03 ± 0·03 ± 0·03 ± 0·03 ± 0·11 ± 0·09 ± 0·10 ± 0·11 ± 0·04 ± 0·09 18:1, c12 0·29 0·27 0·28 0·27 0·28 0·29 0·27 ab 0·27 b 0·29 ab 0·29 ab 0·31 a 0·29 ab ± 0·01 ± 0·01 ± 0·01 ± 0·01 ± 0·01 ± 0·01 ± 0·01 ± 0·01 ± 0·01 ± 0·01 ± 0·01 ± 0·01 18:2,9 c,12 c 1·81 ab 1·90 a 1·75 ab 1·64 bc 1·59* c 1·67 bc 1·77 1·83 1·82 1·79 1·79 1·77 ± 0·06 ± 0·07 ± 0·04 ± 0·05 ± 0·05 ± 0·06 ± 0·05 ± 0·05 ± 0·06 ± 0·05 ± 0·06 ± 0·06 18:3,9 c,12 c,15 c 0·39 abc 0·42 ab 0·44 a 0·41 abc 0·37 bc 0·37 c 0·37 0·38 0·39 0·40 0·41 0·38 ± 0·02 ± 0·02 ± 0·02 ± 0·02 ± 0·02 ± 0·02 ± 0·02 ± 0·01 ± 0·02 ± 0·02 ± 0·03 ± 0·02 18:2,9 c,11 t 0·41 0·46* 0·46 0·45 0·42 0·42 0·39 b 0·40 ab 0·41 ab 0·43 ab 0·44 a 0·45 a ± 0·02 ± 0·02 ± 0·02 ± 0·02 ± 0·02 ± 0·02 ± 0·02 ± 0·02 ± 0·02 ± 0·02 ± 0·02 ± 0·02 18:2,10 t,12 c 0·02 0·03 0·03 0·03 0·02 0·02 0·03 0·03 0·03 0·03 0·03 0·03 ± 0·01 ± 0·01 ± 0·01 ± 0·01 ± 0·01 ± 0·01 ± 0·01 ± 0·01 ± 0·01 ± 0·01 ± 0·01 ± 0·01 Week of lactation 14 15 16 17 18 19 FA (g/100g FAM E) 0 10 20 30 40 C16 <C16 C18:1,9c * * * Feed-restriction Realimentation
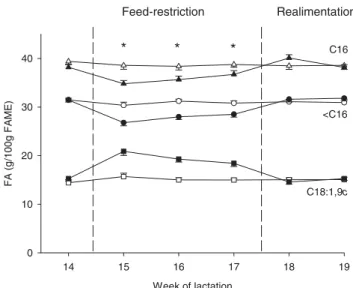
Fig. 3. Proportions (g/100 g of fatty acid methyl esters, FAME) of de-novo synthesized FA (< C16; circles), C16 FA (triangles) and C18:1,9c (squares) in milk fat of feed-restricted cows (filled symbols) and control cows (empty symbols) during feed restriction (weeks 15–17 post partum) and subsequent realimentation (weeks 18–19 post partum). Stars indicate a significant difference between the groups (P < 0·05).
References
Bauman DE & Davis CL 1974 Biosynthesis of milk fat. In: Lactation—A comprehensive treatise Vol. 2 (Eds BL Larson & VR Smith) p. 31. New York, USA: Academic Press
Bligh EG & Dyer WJ 1959 A rapid method of total lipid extraction and purification. Canadian Journal of Biochemistry and Physiology 37 911–917
Bobe G, Lindberg GL, Freeman AE & Beitz DC 2007 Short communication: Composition of milk protein and milk fatty acids is stable for cows differing in genetic merit for milk production. Journal of Dairy Science 90 3955–3960
Dann HM, Morin DE, Bollero GA, Murphy MR & Drackley JK 2005 Prepartum intake, postpartum induction of ketosis, and periparturient disorders affect the metabolic status of dairy cows. Journal of Dairy Science88 3249–3264
Garnsworthy PC & Huggett CD 1992 The influence of the fat concentration of the diet on the response by dairy cows to body condition at calving. Animal Production54 7–13
Garnsworthy PC, Masson LL, Lock AL & Mottram TT 2006 Variation of milk citrate with stage of lactation and de novo fatty acid synthesis in dairy cows. Journal of Dairy Science 89 1604–1612
GfE (German Society of Nutrition Physiology) 2001 [Recommendations on energy and nutrient requirements of dairy cows and rearing cattle], ed. Ausschuss für Bedarfsnormen der Gesellschaft für Ernährungsphysiologie. DLG-Verlag, Frankfurt am Main, Germany Glantz M, Lindmark Mansson H, Stalhammar H, Barström L-O, Fröjelin M,
Knutsson A, Teluk C & Paulsson M 2009 Effects of animal selection on milk composition and processability. Journal of Dairy Science 92 4589–4603
Gross J, van Dorland HA, Bruckmaier RM & Schwarz FJ 2011 Performance and metabolic profile of dairy cows during a lactational and deliberately induced negative energy balance with subsequent realimentation. Journal of Dairy Science94 1820–1830
Hallermayer R 1976 [A rapid method to determine fat content in food]. Deutsche Lebensmittelrundschau10 356–359
Jensen RG, Ferris AM & Lammi-Keefe CJ 1991 The composition of milk fat. Journal of Dairy Science74 3228–3243
Kay JK, Weber WJ, Moore CE, Bauman DE, Hansen LB, Chester-Jones H, Crooker BA & Baumgard LH 2005 Effects of week of lactation and genetic selection for milk yield on milk fatty acid composition in Holstein cows. Journal of Dairy Science 88 3886–3893
Kelsey JA, Corl BA, Collier RJ & Bauman DE 2003 The effect of breed, parity, and stage of lactation on conjugated linoleic acid (CLA) in milk fat from dairy cows. Journal of Dairy Science 86 2588– 2597
Leiber F, Kreuzer M, Nigg D, Wettstein H-R & Scheeder MRL 2005 A study on the causes for the elevated n-3 fatty acids in cows’ milk of alpine origin. Lipids 40 191–202
Luick JR & Smith LM 1963 Fatty acid synthesis during fasting and bovine ketosis. Journal of Dairy Science 46 1251–1255
Moate PJ, Chalupa W, Boston RC & Lean IJ 2007 Milk fatty acids. I. Variation in the concentration of individual fatty acids in bovine milk. Journal of Dairy Science90 4730–4739
Moore JH & Christie WW 1979 Lipid metabolism in the mammary gland of ruminant animals. Progress in Lipid Research 17 347–395
Naumann K, Bassler R, Seibold R & Barth C 2000 [The chemical analysis of feedstuffs. Book of methods no. III], ed. Verband Deutscher Landwirtschaftlicher Untersuchungs- und Forschungsanstalten. Darmstadt, Germany: VDLUFA-Press
Palladino RA, O`Donovan M, Murphy JJ, McEvoy M, Callan J, Boland TM & Kenny DA 2009 Fatty acid intake and milk fatty acid composition of Holstein dairy cows under different grazing strategies: Herbage mass and daily herbage allowance. Journal of Dairy Science 92 5212–5223 Palmquist DL, Beaulieu AD & Barbano DM 1993 ADSA foundation
symposium: Milk fat synthesis and modification. Feed and animal factors influencing milk fat composition. Journal of Dairy Science 76 1753–1771 Reist M, Erdin D, von Euw D, Tschuemperlin K, Leuenberger H, Delavaud C, Chilliard Y, Hammon HM, Kuenzi N & Blum JW 2003 Concentrate feeding strategy in lactating dairy cow: Metabolic and endocrine changes with emphasis on leptin. Journal of Dairy Science 86 1690–1706 Rukkwamsuk T, Geelen MJH, Kruip TAM & Wensing T 2000 Interrelation of fatty acid composition in adipose tissue, serum, and liver of dairy cows during the development of fatty liver postpartum. Journal of Dairy Science 83 52–59
Stoop WM, Bovenhuis H, Heck JML & van Arendonk JAM 2009 Effect of lactation stage and energy status on milk fat composition of Holstein-Friesian cows. Journal of Dairy Science 92 1469–1478
Stull JW, Brown WH, Valdez C & Tucker H 1966 Fatty acid composition of milk. III. Variation with stage of lactation. Journal of Dairy Science 49 1401–1405
Tyburczy C, Lock AL, Dwyer DA, Destaillats F, Mouloungui Z, Candy L & Bauman DE 2008 Uptake and utilization of trans octadecenoic acids in lactating cows. Journal of Dairy Science 91 3850–3861
Van Haelst YNT, Beeckman A, van Knegsel ATM & Fievez V 2008 Short communication: Elevated concentrations of oleic acid and long-chain fatty acids in milk fat of multiparous subclinical ketotic cows. Journal of Dairy Science91 4683–4686
Van Knegsel ATM, van den Brand H, Dijkstra J, Tamminga S & Kemp B 2005 Effect of dietary energy source on energy balance, production, metabolic disorders and reproduction in lactating dairy cattle. Review. Reproduction Nutrition Development45 665–688