Iron supplementation promotes gut microbiota metabolic activity
but not colitis markers in human gut microbiota-associated rats
Alexandra Dostal
1, Christophe Lacroix
1*, Van T. Pham
1, Michael B. Zimmermann
2,
Christophe Del’homme
3, Annick Bernalier-Donadille
3and Christophe Chassard
11Laboratory of Food Biotechnology, Institute of Food, Nutrition and Health, ETH Zurich, Switzerland 2Laboratory of Human Nutrition, Institute of Food, Nutrition and Health, ETH Zurich, Switzerland 3UR454 Microbiology Unit, INRA, Clermont-Ferrand Research Centre, St Gene`s-Champanelle, France
(Submitted 17 June 2013 – Final revision received 14 November 2013 – Accepted 14 January 2014 – First published online 21 February 2014)
Abstract
The global prevalence of Fe deficiency is high and a common corrective strategy is oral Fe supplementation, which may affect the commensal gut microbiota and gastrointestinal health. The aim of the present study was to investigate the impact of different dietary Fe concentrations on the gut microbiota and gut health of rats inoculated with human faecal microbiota. Rats (8 weeks old, n 40) were divided into five (n 8 each) groups and fed diets differing only in Fe concentration during an Fe-depletion period (12 weeks) and an Fe-repletion period (4 weeks) as follows: (1) Fe-sufficient diet throughout the study period; (2) Fe-sufficient diet followed by 70 mg Fe/kg diet; (3) Fe-depleted diet throughout the study period; (4) Fe-depleted diet followed by 35 mg Fe/kg diet; (5) Fe-depleted diet followed by 70 mg Fe/kg diet. Faecal and caecal samples were analysed for gut microbiota composition (quantitative PCR and pyrosequen-cing) and bacterial metabolites (HPLC), and intestinal tissue samples were investigated histologically. Fe depletion did not significantly alter dominant populations of the gut microbiota and did not induce Fe-deficiency anaemia in the studied rats. Provision of the 35 mg Fe/kg diet after feeding an Fe-deficient diet significantly increased the abundance of dominant bacterial groups such as Bacteroides spp. and Clostridium cluster IV members compared with that of an Fe-deficient diet. Fe supplementation increased gut microbial butyrate concen-tration 6-fold compared with Fe depletion and did not affect histological colitis scores. The present results suggest that Fe supplementation enhances the concentration of beneficial gut microbiota metabolites and thus may contribute to gut health.
Key words:Iron: Gut microbiota: Colitis: Butyrate
Research carried out in the past few years has highlighted the importance of the gut microbiota to intestinal health and host health in general(1,2). The gut microbiota plays a crucial role in the development and maintenance of the immune system(3), colonisation resistance to environmental bacteria, such as pathogens(4), extraction of energy from indigestible food com-ponents and production of metabolites that influence gut health(5). SCFA have been widely investigated due to their ability to influence several aspects of host health. Many mem-bers of the gut microbiota produce acetate and propionate. Acetate is either reused by other bacteria for butyrate for-mation or absorbed by the host and can be used as an energy source, while propionate is involved in gluconeo-genesis(6,7). The most investigated end metabolite of the gut microbiota is probably butyrate due to its importance to mucosal health. Butyrate is mainly produced by the members of Clostridium clusters IV and XIVa, such as Faecalibacterium
prausnitzii, Eubacterium hallii and Roseburia spp.,(8,9)and is absorbed by the mucosa where it can act as an energy source for colonocytes(10). Moreover, butyrate has anti-inflammatory effects, is able to promote apoptosis in cancer cells and has been shown to inhibit virulence in enteropathogens(11,12).
Gut microbiota composition and metabolic activity not only affect the host but are also strongly modified by host and environmental factors. Diet composition, such as fibre content, has been shown to have a strong impact on the gut microbiota(13,14). Recent studies have elucidated the differences in gut microbial consortium in populations living in developed and developing countries possibly due to the effects of diet or high prevalence of malnutrition in developing countries, which can strongly influence the gut microbiota(3,15 – 20). One of the most common nutritional deficiencies is Fe deficiency, affecting more than two billion people worldwide, especially in developing countries(21,22).
* Corresponding author: C. Lacroix, fax þ 41 44 632 14 03, email [email protected] Abbreviations: qPCR, quantitative PCR; SRB, sulphate-reducing bacteria.
qThe Authors 2014
British
Journal
of
Fe deficiency affects cognitive and motor development in children and increases the maternal/perinatal mortality rate(23). It also has an impact on gut microbiota composition and metabolic activity. In a recent rat study, we have shown a decrease in the abundance of Roseburia spp./Eubacterium rectale and Bacteroides spp. along with a large decrease in the concentrations of caecal butyrate and propionate in highly Fe-deficient young rats(24). Earlier studies in mice have also demonstrated that low gut luminal Fe concentrations have an impact on gut microbiota composition leading to a decrease in the abundance of Desulfovibrio spp. and an increase in that of Turicibacter spp.(25) while elevating the counts of lactobacilli(26). Using an in vitro colonic fermen-tation model mimicking the proximal colon of a child, we have also confirmed strong dysbiosis of the gut microbiota under very-low-Fe conditions(27).
Usual strategies for Fe-deficiency anaemia correction are Fe supplementation and Fe fortification of foods; FeSO4 is often used, which is highly bioavailable(28). However, absorp-tion of Fe is usually low (5 – 20 %) and takes place mainly in the duodenum, while the main fraction of Fe reaches the colon, where it might affect the gut microbiota(21). Indeed, gut microbiota composition in Fe-deficient rats supplemented with Fe has been found to be partially recovered and gut microbiota metabolic activity to be strongly promoted(24). Animal studies in rats and pigs have also reported dysbiosis of the gut microbiota due to Fe supplementation(26,29), recently confirmed in human studies. School children in Coˆte d’Ivoire have been found to have higher numbers of Enterobacteriaceae and decreased numbers of lacto-bacilli in faeces after Fe supplementation for 6 months and increased concentrations of calprotectin, a marker for gut inflammation(30). Infants given an Fe-supplemented diet for 3 months have been found to have higher relative abundances of Bacteroides spp. and lower abundances of lactobacilli(31).
An unanswered question raised by these studies is whether dietary Fe alone is a modulation factor for the gut microbiota and intestinal inflammation or whether Fe status and suscepti-bility to gut inflammation could also play a role in the observed changes in gut microbiota composition. Both changes in host Fe homeostasis and gut inflammation can alter the gut microbiota composition(32 – 34). Our previous study using Sprague – Dawley rats with a rodent microbiota has investigated the changes in gut microbiota composition due to Fe supplementation in a highly Fe-deficient host(24).
As the rodent microbiota differs from the human
microbiota(35 – 37), in the present study, we used gnotobiotic rats associated with child microbiota, which represent an excellent model to study host – microbiota interactions in a well-controlled environment without confounding factors such as variations in diet or host genetic background(38 – 40). A child was selected as the faecal donor due to the high preva-lence of Fe deficiency and need for Fe supplementation in this age group(22,41). The human microbiota-associated rats were fed diets differing in Fe concentration and source according to the standard Fe depletion – repletion study used to assess Fe bioavailability(42). Changes in faecal microbiota compo-sition were analysed during the study period, and caecal
microbiota composition and metabolic activity, as well as gut inflammation, were assessed after killing the rats at the end of the study.
Materials and methods Rats and diets
A total of forty germ-free female Fischer 344 rats were bred at the INRA facilities of Clermont-Ferrand-Theix, France. They were kept in sterile isolators with positive pressure over the entire trial period as described previously(40,43). Rats were fed an irradiated standard diet for germ-free rodents (SAFE) and given free access to sterilised water. Rats were maintained pairwise in standard Macrolon cages under a 12 h light – 12 h dark cycle under constant temperature and humidity. At 5 weeks of age, rats were inoculated with a human faecal microbiota slurry obtained from a healthy volun-teer (age 6 years) not treated with antibiotics 3 months before faecal sample collection. The faecal sample was processed within 6 h of defecation and maintained under anaerobic conditions. After 1000-fold dilution with an anaerobic mineral solution, 1 ml of faecal slurry was orally inoculated into germ-free rats. The microbiota was allowed to establish for 3 weeks while the rats were being fed a control diet with normal Fe concentrations equivalent to a standardised American Institute of Nutrition (AIN)-93G purified diet(44) before starting the different feeding regimens.
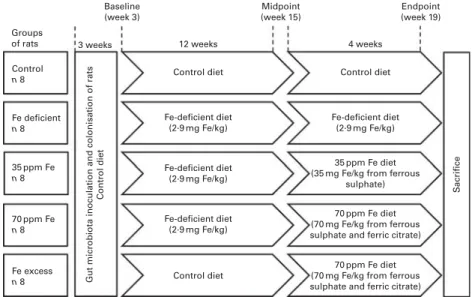
All diets were produced by Dyets Inc. and based on a standard AIN-93G diet differing only in Fe concentration (Table S1, available online). The study set-up (Fig. 1) was designed according to the classical Fe depletion – repletion assay of Forbes et al.(42) and comprised five different groups of rats. A ‘control’ group of rats (n 8) was fed a regular AIN-93G diet containing a mean of 37·6 (SEM0·9) mg Fe/kg diet from ferric citrate over the entire trial period of 16 weeks, while a ‘Fe-deficient’ group of rats (n 8) was fed an Fe-deficient diet containing 2·9 (SEM0·2) mg Fe/kg diet. A further two groups of rats, ‘35 ppm Fe’ group (n 8) and ‘70 ppm Fe’ group (n 8), were first fed a Fe-deficient diet for 12 weeks and were then supplemented with either a 35 ppm Fe diet containing 32·2 (SEM1·0) mg Fe/kg diet from FeSO4or a 70 ppm Fe diet contain-ing 66·1 (SEM7·8) mg Fe/kg diet from FeSO4and ferric citrate to mimic Fe supplementation with two different Fe sources and concentrations for 4 weeks. A fifth group of rats, ‘Fe-excess’ group (n 8), was first fed the control diet and was then sup-plemented with the 70 ppm Fe diet to mimic the impact of Fe supplementation on the gut microbiota not previously affected by a low-Fe diet and to investigate the effects of excess Fe on the gut microbiota. Once a week, body weight of each rat was measured and diet intake was assessed cage-wise (two rats). Fe concentration in the diets was assessed by atomic absorption spectrometry (SpectrAA-240K with GTA-120 Graphite Tube Ato-mizer, Varion Techtron) shortly before use. All procedures were
carried out according to the European Directives on
the protection of animals used for scientific purposes, 2010/63/ EU, and the laboratory procedures were approved by the local ethics committee (CEMEAA 02).
British
Journal
of
Sample collection
Faecal samples and blood samples of all rats were collected at baseline (week 3), after the first feeding period at midpoint (week 15) and at endpoint (week 19). Faecal samples were frozen at 2 808C until gut microbiota composition analysis by quantitative PCR (qPCR). Fe concentration in the faecal samples of the 35 ppm Fe-supplemented group, Fe-deficient group and control group at endpoint (week 19) was assessed by atomic absorption spectrometry (SpectrAA-240K with GTA-120 Graphite Tube Atomizer, Varion Techtron). Blood samples were collected by the tail vein clip method(45) and analysed immediately for Hb concentrations using a Hemocue 201 instru-ment (HemoCue). After killing the rats by CO2inhalation, blood was collected again by cardiac puncture and centrifuged immediately, and serum was kept at 2 808C until ferritin measurements. Serum ferritin concentrations were assessed in duplicate using a rat ferritin ELISA kit according to the manu-facturer’s instructions (Immunology Consultants Laboratory, Inc.). Sections of the ileum, caecum and colon were removed, rinsed in PBS and immersed in 4 % paraformaldehyde, and stored at 48C until histological analyses. Caecal contents were also collected and frozen immediately at 2 808C for caecal microbiota metabolic activity and composition analyses.
Histological analyses of ileal, caecal and colonic tissue samples
All histological analyses were carried out by the Histology Analysis Platform of the Nantes Atlantic National College of Veterinary Medicine, Food Science and Engineering (Oniris, Nantes, France). After sectioning, ileal, caecal and colonic tissue samples were stained with haematoxylin – eosin – safranin and analysed microscopically using a Nikon Eclipse 5DI microscope connected to a Nikon DS-42-RI1 camera (200£ or 400£ magnification) (Nikon Instruments). Tissue samples were analysed for infiltration of immune cells,
damage in crypt architecture, hyperaemia and mucosal ero-sion and were given a histological colitis score according to the severity of these parameters(46). The veterinary pathologist examining the tissue samples was blinded to treatment.
Faecal and caecal microbiota composition analysis using quantitative PCR
Total genomic DNA from faecal samples and caecal content samples was extracted using the FastDNA SPIN Kit for Soil (MP Biomedicals). For the enumeration of total 16S rRNA gene copies and nine bacterial groups prevalent in the gut microbiota, namely Firmicutes, Bacteroides spp., Clostridium cluster IV, F. prausnitzii, E. hallii, Enterobacteriaceae, Lactobacillus/Leuconostoc/Pediococcus spp., Roseburia spp./ E. rectale, and sulphate-reducing bacteria (SRB), primers target-ing the 16S rRNA gene or a functional gene were used for qPCR carried out with an ABI PRISM 7500-PCR sequence detection
system using 2£ SYBR Green PCR Master Mix (Life
Technologies), as described previously(27,47). In short, PCR comprising 0·2 mMof each primer in 25 ml volume were carried out in duplicate for each sample. In every run, a standard curve with serially diluted 16S rRNA gene or functional gene concen-trations of a representative strain for each bacterial target group was included. SRB were enumerated with the same protocol
using the primers dsrA_F336 (50-CTG CGA ATA TGC CTG
CTA CA-30) and dsrA_R533 (50-TGG TCG ARC TTG ATG TCG TC-30) targeting the dissimilatory sulphite reductase subunit A(48), and E. hallii 16S rRNA gene copies were evaluated using the primers EhalF (50-GCGTAGGTGGCAGTGCAA-30) and EhalR (50-GCACCGRAGCCTATACGG-30)(49).
Pyrosequencing analysis
Pyrosequencing analysis was carried out using caecal
samples of the control group, Fe-deficient group and
Groups of rats Control
n 8
Gut microbiota inoculation and colonisation of rats
Control diet S acrifice Fe deficient n 8 35 ppm Fe n 8 70 ppm Fe n 8 Fe excess n 8 Baseline (week 3) 3 weeks 12 weeks Control diet Control diet Fe-deficient diet (2·9 mg Fe/kg) Control diet Fe-deficient diet (2·9 mg Fe/kg) 35 ppm Fe diet (35 mg Fe/kg from ferrous
sulphate)
70 ppm Fe diet (70 mg Fe/kg from ferrous sulphate and ferric citrate)
70 ppm Fe diet (70 mg Fe/kg from ferrous sulphate and ferric citrate) Fe-deficient diet (2·9 mg Fe/kg) Fe-deficient diet (2·9 mg Fe/kg) 4 weeks Midpoint (week 15) Endpoint (week 19)
Fig. 1. Study set-up with different iron feeding regimens according to a classical iron depletion – repletion study design. Germ-free Fischer 344 rats (n 40) were divided into five groups and inoculated with the same microbiota from a human volunteer. After 3 weeks of initial colonisation for gut microbiota establishment, diets differing only in iron concentration were fed to rats as outlined in the figure.
British
Journal
of
35 ppm Fe-supplemented group for three rat pairs in each group. Caecal content samples of the two rats housed in the same cage were pooled, and DNA was extracted using the FastDNA SPIN Kit for Soil (MP Biomedicals), resulting in three genomic DNA samples per analysed group of rats (total of nine genomic DNA samples). Pyrosequencing anal-ysis was carried out by DNAVision (Charleroi, Belgium) using a 454 Life Sciences Genome Sequencer FLX instrument (Roche Applied Science), following previously described pro-cedures(27). Resulting reads from the hypervariable gene region V5 – V6 of the 16S rRNA gene were assigned to samples according to their multiplex identifier tag, checked for the presence of primer sequences and fragment length . 200 bp. All reads not fulfilling these criteria were discarded, resulting in an average number of sequences of 5345 (SD 1929) per sample used in taxonomic assignment. Sequences were assigned on family and genus level using the Mothur(50) and Greengenes 16S reference database(51). Moreover, sequences that did not align where 95 % of the other sequences aligned were discarded. Chimera candidates were identified using the UCHIME implementation in Mothur(52). Relative abun-dances of unassigned reads or reads assigned on family or genus level were calculated from the total number of reads matching the quality control criteria.
Metabolite analysis
Caecal content samples were centrifuged (10 000 g) and super-natants were diluted with MilliQ water before analysis by HPLC as described previously(53). Fermentative metabolites (lactate, formate, acetate, propionate, butyrate, isovalerate, isobutyrate and valerate) and SCFA (acetate, propionate and butyrate) in each sample were analysed in duplicate.
Statistical analysis
Statistical analysis was carried out using JMP 8.0 and SPSS 18.0 (IBM SPSS, Inc.). All data were tested for normal distribution using the Shapiro – Wilk test and are expressed as means with their standard errors. Hb, ferritin, weight gain and gut
microbiota concentrations for each metabolite and caecal qPCR data for each bacterial target were compared between the groups of rats using one-way ANOVA with a post hoc Bonferroni test. Diet consumption was compared using non-parametric Kruskal – Wallis test. qPCR data on faecal micro-biota composition were analysed over time for every bacterial target within each rat group using one-way repeated-measures ANOVA with Greenhouse – Geisser correction and post hoc Bonferroni test. qPCR data were log10-transformed before statistical analysis. Histological colitis scores and pyrosequen-cing data were compared pairwise using the non-parametric Mann – Whitney U test. P values , 0·05 were considered significantly different.
Results
Iron status, faecal iron concentrations, weight gain and diet consumption
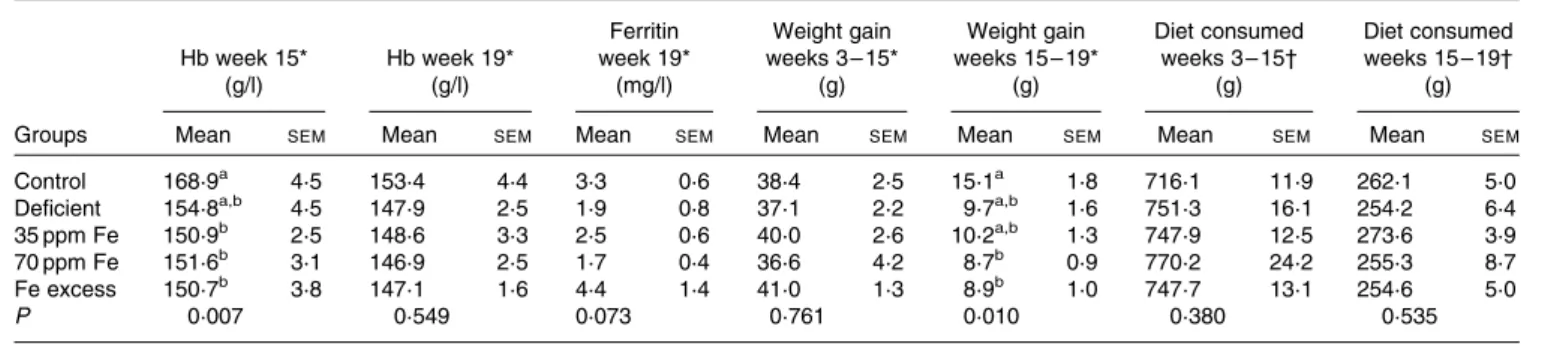
Fe status of rats fed different Fe diets was assessed by blood Hb concentration measurements at midpoint (week 15) and at endpoint (week 19), while ferritin concentration was measured at endpoint (Table 1). Although rats were fed a highly Fe-deficient diet (2·9 mg Fe/kg diet) for up to 16 weeks after an initial colonisation period during which they were fed a standard diet, Hb and ferritin concentrations at endpoint (week 19) were not significantly different between the groups of rats. However, lighter caecal content colour and liver colour were observed in the majority of rats in the Fe-deficient group (Fig. S1, available online). Weight gain was similar between all groups of rats during the first feeding period (weeks 3 – 15). During the second feeding period (weeks 15 – 19), rats in the control group exhibited the highest weight gain, which was significantly higher than that in rats in the 70 ppm Fe-supplemented group and Fe-excess group possibly because the control group had the lowest weight at week 15 and therefore more growth potential during the second feeding period. Interestingly, diet consumption was similar between the groups of rats during the first and second feeding periods.
Table 1. Hb and ferritin concentrations, weight gain and dietary intake in rats fed a diet differing only in iron concentration at midpoint (week 15) and endpoint (week 19) (n 7 – 8, each group)
(Mean values with their standard errors)
Hb week 15* (g/l) Hb week 19* (g/l) Ferritin week 19* (mg/l) Weight gain weeks 3 – 15* (g) Weight gain weeks 15 – 19* (g) Diet consumed weeks 3 – 15† (g) Diet consumed weeks 15 – 19† (g)
Groups Mean SEM Mean SEM Mean SEM Mean SEM Mean SEM Mean SEM Mean SEM
Control 168·9a 4·5 153·4 4·4 3·3 0·6 38·4 2·5 15·1a 1·8 716·1 11·9 262·1 5·0
Deficient 154·8a,b 4·5 147·9 2·5 1·9 0·8 37·1 2·2 9·7a,b 1·6 751·3 16·1 254·2 6·4
35 ppm Fe 150·9b 2·5 148·6 3·3 2·5 0·6 40·0 2·6 10·2a,b 1·3 747·9 12·5 273·6 3·9
70 ppm Fe 151·6b 3·1 146·9 2·5 1·7 0·4 36·6 4·2 8·7b 0·9 770·2 24·2 255·3 8·7
Fe excess 150·7b 3·8 147·1 1·6 4·4 1·4 41·0 1·3 8·9b 1·0 747·7 13·1 254·6 5·0
P 0·007 0·549 0·073 0·761 0·010 0·380 0·535
a,bMean values within a column with unlike superscript letters were significantly different (P, 0·05). * Differences among groups were tested by ANOVA and post hoc Bonferroni test.
† Differences among groups were tested by non-parametric Kruskal– Wallis test.
British
Journal
of
At endpoint, Fe concentration in the faecal samples of rats in the Fe-deficient group (20 (SEM 3) mg Fe/kg) was signi-ficantly lower than that in the faecal samples of rats in the
35 ppm Fe-supplemented group (185 (SEM 14) mg Fe/kg,
P, 0·001) and control group (184 (SEM7) mg Fe/kg, P, 0·001).
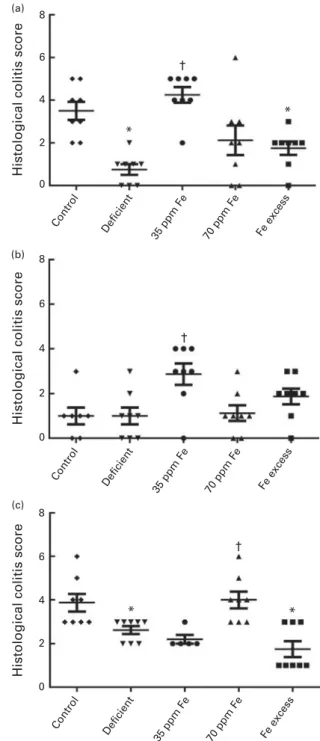
Effect of different iron concentrations in the diet on histological colitis scores
Ileum, caecum and colon of rats were collected after killing them, preserved in paraformaldehyde, and investigated by light microscopy for infiltration of immune cells, damage in crypt architecture, hyperaemia and mucosal erosion to evalu-ate histological colitis scores (Fig. 2(a) – (c)). In general, no severe colitis was detected in the ileum, caecum or colon of all rat groups, and the highest average score was 4·3 (SEM0·4) (ileum, 35 ppm Fe-supplemented group) of a maxi-mum possible score of 11, indicating very light colitis. Rats fed an Fe-deficient diet had the lowest ileum histological colitis scores (score of 0·8 (SEM0·3)), which were significantly lower than those of the control rats (3·5 (SEM0·4), P¼ 0·001) and 35 ppm Fe-supplemented rats (4·3 (SEM 0·4), P¼ 0·0009) (Fig. 2(a)). Caecum histological colitis scores were similar between all groups of rats and rats in the 35 ppm Fe-supplemented group had the highest scores (2·9 (SEM 0·5)) (Fig. 2(b)). Supplementation with 35 ppm Fe after feeding
an Fe-deficient diet (35 ppm Fe-supplemented group)
significantly increased the caecum histological colitis scores compared with those of rats in the Fe-deficient group. Surprisingly, when a diet with 70 ppm Fe was fed after feeding an Fe-deficient diet (70 ppm Fe-supplemented group), no increase in histological colitis scores was observed. The opposite observation was made in the colon, wherein the 70 ppm Fe-supplemented group had higher histological colitis scores (4·0 (SEM 0·4)) than the Fe-deficient group (Fig. 2(c)). Moreover, differences in histological colitis scores between the different parts of the intestine (ileum – caecum – colon) were observed with a lower histological colitis score being observed for the caecum in the control and 70 ppm Fe-supplemented groups and an increase in histological colitis scores from the ileum to the colon being observed in the Fe-deficient group. By contrast, a significant decrease in histological colitis scores from the ileum to the colon was observed in rats in the 35 ppm Fe-supplemented group, while no changes were observed in those in the Fe-excess group.
Caecal and faecal microbiota composition in rats fed diets differing in iron concentration
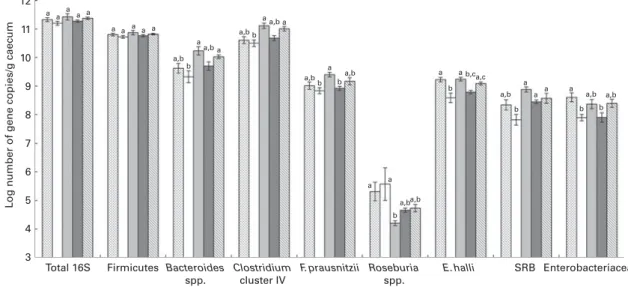
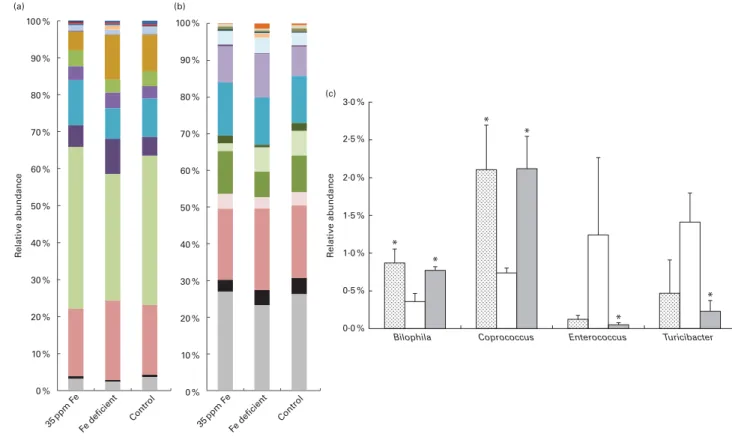
Caecal contents of all rats were collected after killing them and the extracted DNA was investigated by qPCR to enumer-ate different bacterial groups present in the gut microbiota (Fig. 3) and by 454-pyrosequencing (Fig. 4(a) – (c)) to assess gut microbiota diversity and composition. qPCR did not reveal changes in the log number of total 16S rRNA gene copies or Firmicutes 16S rRNA gene copies/g caecum between the different groups of rats fed different Fe diets. The bacterial community in all rats was dominated by Firmicutes, including Clostridium cluster IV, followed by Bacteroides spp. (Fig. 3). This finding was confirmed by 454-pyrosequencing in rats in the control group, Fe-deficient group and 35 ppm
Fe-supplemented group, where the phylum Firmicutes
(54·5 – 82·6 %, data not shown) dominated, followed by 8
*
†
*
Histological colitis score
Histological colitis score
Histological colitis score
† * † * (a) (b) (c) 6 4 2 0 Control Deficient 35 ppm Fe 70 ppm Fe Fe excess Control Deficient 35 ppm Fe 70 ppm Fe Fe excess Control Deficient 35 ppm Fe 70 ppm Fe Fe excess 8 6 4 2 0 8 6 4 2 0
Fig. 2. Histological colitis scores of (a) ileum, (b) caecum and (c) colon of rats fed diets differing in iron concentration. Colitis scores were obtained by light microscopy after haematoxylin/eosin/safranin staining and investigation of infiltration of immune cells, damage in crypt architecture, hyperaemia and mucosal erosions. Each dot represents one rat. Horizontal bars are means, with their standard errors. * Mean value was significantly different from that of the control group (P, 0·05; non-parametric Mann – Whitney U test). † Mean value was significantly different from that of the iron-deficient group (P, 0·05; non-parametric Mann – Whitney U test).
British
Journal
of
Bacteroidetes (14·3 – 42·0 %, data not shown). On the taxonomic family level, these rats had the highest relative abundance (34·1 – 43·8 %) of Lachnospiraceae (Firmicutes) (Fig. 4(a)).
The levels of dominant bacterial groups (Firmicutes, Bacteroides spp. and Clostridium cluster IV) in caecum were similar in rats in the control and Fe-deficient groups. However, the levels of E. hallii and Enterobacteriaceae were significantly lower in rats fed an Fe-deficient diet (8·59 (SEM0·17) and 7·89 (SEM 0·11), respectively; mean log 16S rRNA gene copies/g caecum) than in the control rats (9·22 (SEM 0·08) and 8·61 (SEM 0·16), respectively) (Fig. 3). Moreover, a significantly lower abundance of Bilophila spp. (0·36 (SEM 0·11) %) and Coprococcus spp. (0·74 (SEM 0·07) %) was observed in rats in the Fe-deficient group than in those in the control group (Bilophila spp., 0·87 (SEM 0·19) %; Coprococcus spp. 2·11 (SEM 0·58) %) by 454-pyrosequencing (Fig. 4(c)). Bacteroides spp., Clostridium cluster IV, F. prausnitzii, E. hallii and SRB were significantly increased in the caecum of rats in the 35 ppm Fe-supplemented group than in that of rats in the Fe-deficient group; however, bacterial concentrations did not increase to higher levels compared with those in the control group (Fig. 3). The 454-pyrosequencing analysis revealed a signifi-cantly higher relative abundance of Lachnospiraceae (43·81 (SEM 2·79) %, Fe-deficient group: 34·14 (SEM 1·97) %), Rumino-coccaceae (12·15 (SEM 1·30) %, Fe-deficient group: 8·25 (SEM 0·38) %) and Veillonellaceae (0·46 (SEM 0·05) %, Fe-deficient group: 0·29 (SEM 0·02) %) in the 35 ppm Fe-supplemented group than in the Fe-deficient group (Fig. 4(a)). On the genus level, the abundance of Coprococcus spp. (2·21 (SEM 0·43) %, Fe-deficient group: 0·74 (SEM 0·07) %) and Bilophila spp. (0·77 (SEM0·05) %, Fe-deficient group: 0·36 (SEM0·11) %) was significantly increased, while that of Enterococcus spp. (0·05 (SEM 0·03) %, Fe-deficient group: 1·24 (SEM 1·03) %) and Turicibacter spp. (0·23 (SEM 0·14) %, Fe-deficient group:
1·41 (SEM 0·38) %) was significantly decreased in the 35 ppm Fe-supplemented group than in the Fe-deficient group (Fig. 4(b) and (c)). Bacterial populations in rats in the 70 ppm Fe-supplemented group and the Fe-excess group did not differ when compared with those in rats in the Fe-deficient group or control group, respectively (Fig. 3).
Faecal samples collected at baseline (week 3), midpoint (week 15) and endpoint (week 19) shortly before killing were analysed for microbial composition using qPCR to enumerate prevalent bacterial groups (Table S2, available online). During the entire trial period of 16 weeks, the faecal microbiota was very stable, with changes in the log numbers of 16S rRNA gene copies of dominant bacterial groups per g faeces being less than 1 log, and no direct correlations between dietary Fe concentrations and faecal microbiota composition could be extracted.
Effect of different iron diets on caecal microbiota metabolic activity
Fermentative metabolites and SCFA concentrations measured by HPLC (Fig. 5) were not different between rats in the Fe-deficient group and those in the control group. However, supplementation with Fe at the 35 and 70 ppm levels affected the caecal microbiota metabolic profile profoundly. Fermentative metabolites and acetate and propionate concen-trations were all significantly increased in rats in the 35 ppm Fe-supplemented group (83·2 (SEM 10·1), 33·7 (SEM 2·3) and 15·3 (SEM 0·9) mM, respectively) and the 70 ppm Fe-supplemented group (62·0 (SEM 2·6), 33·1 (SEM 1·6) and 14·5 (SEM 0·9) mM, respectively) than in those in the Fe-deficient group (39·6 (SEM 1·6), 23·7 (SEM 1·2) and 9·5 (SEM 0·5) mM, respectively). Moreover, butyrate
concen-tration was significantly increased in the 35 ppm
Fe-supplemented group (29·5 (SEM 7·5) mM) compared with 12 11 10 9 8 7 6 5 4 3 Total 16S a a a a a a a a a a a a a,b a,b a,b a,b a,b a,b a,b a,b b b b b a a a a a a a a a a a b b b b b,ca,c
a,b a,b a,b
b
Firmicutes
L
og number of gene copies/g caecum
Bacteroides spp. Clostridium cluster IV F. prausnitzii Roseburia spp. E. halli SRB Enterobacteriaceae
Fig. 3. Caecal microbiota composition after killing in rats fed diets differing only in iron concentration. Bacterial groups were enumerated with specific bacterial primers targeting the 16S rRNA gene or a specific functional gene by quantitative PCR. Values are means (n 8; iron excess, n 7), with their standard errors represented by vertical bars.a,b,cMean values within the same bacterial group with unlike letters were significantly different (P, 0·05; ANOVA followed by post hoc Bonferroni test). SRB, sulphate-reducing bacteria. , Control; , Fe deficient; , 35 ppm Fe; , 70 ppm Fe; , Fe excess.
British
Journal
of
the Fe-deficient group (4·8 (SEM 0·8) mM). Propionate and butyrate concentrations in the 35 ppm Fe-supplemented group were even higher than those in the control group. On the other hand, supplementation with 70 ppm Fe led to no sig-nificant increase in butyrate concentration compared with that in rats in the Fe-deficient group. Propionate (15·4 (SEM 0·7) mM) and butyrate (16·7 (SEM 3·9) mM) concentrations were significantly increased in the Fe-excess group compared with the control group (11·7 (SEM 0·8) and 3·3 (SEM 0·6) mM, respectively).
Discussion
The results of the present study carried out using human gut microbiota-associated rats provide a new insight into the highly complex interactions between the host, the gut micro-biota and Fe. Colonisation of rats with human gut micromicro-biota was successful, and dominant bacterial groups were present at similar levels in rats at baseline and in the donor microbiota as described previously(36,40). The use of one faecal donor also led to highly similar microbiotas in all rats, whereas in humans variability in microbiota composition between individuals is high and may potentially mask smaller effects(54). Feeding
regimens were set up according to the classical Fe
depletion – repletion study(42)in which Fe depletion is started in very young rats (usually 3 weeks old), which have small body Fe stores and high Fe needs for growth, leading to severe Fe-deficiency anaemia(28,42).
Surprisingly, in the present study, the 12- and 16-week depletion periods were insufficient to induce Fe-deficiency anaemia. This may be because the rats were 8 weeks of age when the intervention was started (instead of the usual 3 weeks) and had time to build up adequate Fe stores. Drawing on these stores allowed them to maintain Hb concentrations during the depletion period. However, rats in the Fe-deficient group had caecal contents of a lighter colour, suggesting a mild degree of Fe depletion (Fig. S1, available online). In addition, Fischer 344 rats are known to be more resistant to Fe deficiency than the Sprague– Dawley rats usually used in a Hb depletion– repletion study(55). At endpoint, faecal Fe con-centrations in rats were higher than dietary Fe concon-centrations, which may be explained by a concentration effect of Fe in the gut lumen during water and nutrient absorption and a poss-ible Fe loss in the host by sloughed enterocytes.
Dietary Fe supplementation has been shown to be associated with increased inflammatory reactions of the gut mucosa possibly generated by the production of reactive oxygen species in the presence of elevated luminal Fe
3·0 % 2·5 % 2·0 % R elati ve abundance R elati ve abundance * * * * * * 1·5 % 1·0 % 0·5 % 0·0 %
Bilophila Coprococcus Enterococcus Turicibacter
100 % (a) (b) (c) 90 % 80 % 70 % 60 % 50 % 40 % 30 % 20 % 10 % 0 % 35ppm F e Fe deficient Control 35ppm F e Fe deficient Control 100 % 90 % 80 % 70 % 60 % 50 % 40 % 30 % 20 % 10 % 0 %
Fig. 4. Caecal microbiota composition of rats fed the 35 ppm iron diet (n 3 samples), rats fed an iron-deficient diet (n 3 samples) and rats fed the control diet (n 3 samples). Relative abundances of (a) bacterial families and (b) genera identified by 454-pyrosequencing analysis. (c) Relative abundance of subdominant genera Bilophila, Coprococcus, Enterococcus and Turicibacter. Values are means, with their standard errors represented by vertical bars. * Mean values were significantly different from those of the iron-deficient group (P, 0·05; non-parametric Mann – Whitney U test). (a) , Verrucomicrobiaceae; , Veillonellaceae;
, Alcaligenaceae; , Enterococcaceae; , Desulfovibrionaceae; , Coriobacteriaceae; , Erysipelotrichaceae; , Porphyromonadaceae; , Rikenellaceae;
, Ruminococcaceae; , Clostridiaceae; , Lachnospiraceae; , Bacteroidaceae; , smaller taxa; , unclassified. (b) , Turicibacter; , Desulfovibrio; , Bilophila;
, Sutterella; , Enterococcus; , Alistipes; , Faecalibacterium; , Clostridium; , Ruminococcus; , Coprococcus; , Dorea; , Blautia; , Parabacteroides;
, Bacteroides; , smaller taxa; , unclassified. (c) , Control; , Fe deficient; , 35 ppm Fe.
British
Journal
of
concentration, which has been observed in inflammatory bowel disease patients and rat models(56 – 58), while other studies suggest an involvement of gut bacterial composition changes due to Fe concentrations(25,59). Werner et al.(25) found that a low-Fe diet completely inhibited gut inflam-mation in a mouse colitis model, while Fe supplementation in wild-type mice had no effect on colitis scores. In agreement, the present study showed lower histological colitis scores of ileum and colon in rats fed an Fe-deficient diet while Fe sup-plementation with 35 ppm Fe but not with 70 ppm Fe caused light colitis in ileum and caecum. Therefore, no clear inflam-mation pattern related to Fe concentrations could be detected in the investigated rats. Fe supplementation in school children in Coˆte d’Ivoire has been found to clearly increase calprotectin concentrations, but in an environment with a high risk of pathogen exposure(30). We speculate that Fe supplementation in the range of physiological levels may not lead to mucosal inflammation unless other influencing factors are present such as a high contamination with pathogens or an inflamma-tory pre-set of the host.
Faecal microbiota composition in all rats was very stable over time. Because rats had normal Fe status, we speculated that especially under an Fe-deficient diet regimen, bacteria in the colon could sequester Fe from sloughed enterocytes. Therefore, caecal contents were analysed, in which Fe might have a more direct impact on the microbiota. There was no difference in gut microbiota metabolic activity in caecum between rats in the Fe-deficient group and those in the control group. However, we found that low luminal Fe concentrations
slightly affected the gut microbiota composition and
decreased the relative abundances of Bilophila spp., E. hallii and Coprococcus spp. most probably due to Fe-dependent
enzymes such as hydrogenases in their metabolic
pathways(9,60,61).
The findings of the present study are in contrast to previous findings in highly Fe-deficient rats and also to the results of an in vitro colonic fermentation experiment(24,27). In both exper-iments, very-low-Fe conditions had caused major dysbiosis of the gut microbiota and especially decreased butyrate and pro-pionate production. Moreover, it has been shown that changes in host Fe metabolism in mice and humans have effects on the gut microbiota without changing dietary Fe concen-trations(32,62). However, in the present study, hosts were not Fe deficient and it is possible that host Fe plays an important role in the maintenance of the composition and metabolic function of the gut microbiota as part of the symbiosis between the microbiota and the host. Indeed, during low-Fe diet feeding, faecal Fe concentrations were 20 mg Fe/kg faeces, which could be provided by unabsorbed dietary Fe and by sloughed enterocytes from the host. These faecal Fe concentrations are probably adequate to maintain the gut microbiota as has been shown in our previous in vitro studies(27).
Fe supplementation with 35 mg Fe/kg diet from FeSO4 (35 ppm Fe-supplemented group) had a strong effect on both the caecal microbiota composition and metabolic activity, especially increasing the abundance of Bacteroides spp. and butyrate producers such as Clostridium cluster IV members, e.g. F. prausnitzii, and Coprococcus spp. Moreover, a decrease in the relative abundances of Turicibacter spp. and
100 90 80 70 60 50 40 30 20 10 0 Control c,d Concentration (m M ) a,b b,c c d b c a a a a b,c a a,b a,b,c a,b a a a,b b,c Fe deficient 35 ppm Fe 70 ppm Fe Fe excess
Fig. 5. Caecal fermentative metabolites and acetate, propionate and butyrate concentrations after killing in different groups of rats. Concentrations were measured by HPLC in caecum water samples in duplicate. Values are means (n 8; 35 ppm iron, n 7), with their standard errors represented by vertical bars.a,b,c,dMean values of the same metabolite with unlike letters were significantly different (P, 0·05; one-way ANOVA followed by post hoc Bonferroni test). , Fermentative metabolites; , acetate; , propionate; , butyrate.
British
Journal
of
Enterococcus spp., both of which are opportunistic patho-gens(63,64), was observed during feeding of the 35 ppm Fe diet than during feeding of a Fe-deficient diet. Enterococci most probably had a growth advantage under low-Fe con-ditions due to their restricted need for Fe and lost this advantage during Fe supplementation. Similar observations were made in mice in which feeding a diet containing Fe led to an increase in the abundance of Bacteroides spp. and to a decrease in that of Turicibacter spp. compared with feeding a Fe-free diet(25).
The concentrations of acetate, propionate and especially butyrate were significantly increased due to Fe supplemen-tation compared with those in rats in the Fe-deficient group. In a previous study, Fe supplementation has been found to lead to a significant increase in butyrate and propionate concentrations in highly Fe-deficient rats(24). Moreover, Fe-deficient conditions in the same rat study and also in a colonic in vitro fermentation study led to a decrease in buty-rate and propionate production(27). These observations suggest that Fe is a crucial element for butyrate and propio-nate production in strict anaerobic gut bacteria. Indeed, in the butyrate production pathway, oxidoreductases and hydrogenases are involved(8,14,65), which are often Fe depen-dent, and under conditions of optimal bioavailable Fe concen-trations, the conversion of dietary or host carbons into end metabolites such as butyrate by gut bacteria may be enhanced. Studies in bioreactors with mixed strict-anaerobe cultures have shown that increasing Fe concentrations lead to a higher H2 and butyrate yield per carbon source(29,66,67). Indeed, when calculating the total carbon output from bacterial fermentation in the form of SCFA, the diet with 35 mg Fe/kg diet from FeSO4 (35 ppm Fe-supplemented group) led to more than double the carbon output than the control diet or a Fe-deficient diet, mainly due to the promotion of butyrate production, although diet consumption was similar in these groups of rats. SCFA can provide up to an additional 10 % of daily dietary energy to the host from indigestible compounds, such as fibres(68). This pro-motion of carbon output due to Fe supplementation could increase the energy source of plant-based diets, which are mainly consumed in developing countries, and therefore might contribute to weight gain in malnourished individuals.
A significant increase in caecal butyrate and propionate con-centrations along with a decrease in the abundance of possible opportunistic pathogens due to 35 ppm Fe supplementation could lead to beneficial effects on host gut health. Propionate produced by several Bacteroides spp. has been shown to be involved in the regulation of satiety(69). Butyrate is the main energy source for colonocytes, and it can inhibit NF-kB acti-vation and therefore decrease inflammatory responses(70,71). Moreover, butyrate has anti-carcinogenic effects through the promotion of apoptosis and inhibition of proliferation(72). Interestingly, no correlation between increased butyrate con-centrations and decreased colitis scores was observed in the present study, but the anti-inflammatory effects of butyrate might be much more visible in mucosa with an inflammatory pre-set. Moreover, the abundance of H2-utilising and potentially toxic H2S-producing SRB was increased with Fe supplemen-tation in the present study possibly due to the promotion of
the production of H2, a by-product of the butyrate production pathway(65). SRB have been identified as possible contributors of different digestive pathologies such as inflammatory bowel syndrome and inflammatory bowel disease(40,73 – 76), and H2S has been shown to affect metabolic functions in colonocytes and to cause DNA damage(74,76). However, other studies have suggested a protective role of H2S in the epithelial layer during inflammation and identified H2S as an important mediator for intracellular processes(77,78). Therefore, it remains difficult to directly associate an increase in SRB counts and H2S production with negative effects on the gut mucosa, and no negative modulation of the gut mucosa could be detected in the present study.
In conclusion, the present study carried out using human gut microbiota-associated rats investigated the effects of diet-ary Fe concentrations on the gut microbiota. Our data suggest that an Fe-deficient diet alone may have no major effects on dominant bacterial populations or gut microbiota metabolic activity in a host, which is not Fe deficient based on blood parameters as observed in the study. By contrast, Fe sup-plementation with 35 mg Fe/kg diet from FeSO4 promoted dominant bacterial groups and slightly increased SRB, while the abundance of potential opportunistic pathogens was decreased. Moreover, Fe supplementation strongly increased the metabolic activity of the gut microbiota. Histological colitis scores remained very low despite Fe supplementation, indicat-ing that Fe alone does not lead to gut inflammation. Thus, we suggest that Fe supplementation might confer additional health benefits on the host by stimulating the gut microbiota without an inflammatory gut mucosa and in a relatively pathogen-free environment.
Supplementary material
To view supplementary material for this article, please visit http://dx.doi.org/10.1017/S000711451400021X
Acknowledgements
The authors thank Christophe De Martrin and Ge´rard Vert for their assistance in animal care and maintenance as well as Rainer Follador (Microsynth AG) for bioinformatics analysis of the pyrosequencing data.
The present study was funded by grants from the Swiss National Science Foundation (project number: 310030_ 127272, Bern, Switzerland) and the Eunice Kennedy Shriver National Institute of Child Health and Human Development (award number: U01HD0 64921). The Swiss National Science Foundation and the Eunice Kennedy Shriver National Institute of Child Health and Human Development had no role in the design and analysis of the study or in the writing of this article. The authors’ contributions are as follows: A. D., C. C., A. B.-D., C. D. and C. L. designed the study; A. D., C. C., C. D. and V. T. P. carried out the study; A. D. and V. T. P. analysed the data; A. D. wrote the manuscript; C. C., A. B.-D., C. D., M. B. Z. and C. L. edited the manuscript.
None of the authors has any conflicts of interest to declare.
British
Journal
of
References
1. Guarner F (2006) Enteric flora in health and disease. Digestion 73, Suppl. 1, 5 – 12.
2. Sekirov I, Russell SL, Antunes LC, et al. (2010) Gut microbiota in health and disease. Physiol Rev 90, 859 – 904. 3. Kau AL, Ahern PP, Griffin NW, et al. (2011) Human nutrition,
the gut microbiome and the immune system. Nature 474, 327 – 336.
4. Stecher B & Hardt WD (2011) Mechanisms controlling patho-gen colonization of the gut. Curr Opin Microbiol 14, 82 – 91. 5. Louis P, McCrae SI, Charrier C, et al. (2007) Organization of butyrate synthetic genes in human colonic bacteria: phylo-genetic conservation and horizontal gene transfer. FEMS Microbiol Lett 269, 240 – 247.
6. Hoyles L & Wallace RJ (2010) Gastrointestinal tract: intestinal fatty acid metabolism and implications for health. In Handbook of Hydrocarbon and Lipid Microbiology, pp. 3119 – 3132 [K Timmis, editor]. Berlin: Springer. 7. Scott KP, Gratz SW, Sheridan PO, et al. (2013) The influence
of diet on the gut microbiota. Pharmacol Res 69, 52 – 60. 8. Louis P & Flint HJ (2009) Diversity, metabolism and
microbial ecology of butyrate-producing bacteria from the human large intestine. FEMS Microbiol Lett 294, 1 – 8. 9. Pryde SE, Duncan SH, Hold GL, et al. (2002) The
micro-biology of butyrate formation in the human colon. FEMS Microbiol Lett 217, 133 – 139.
10. Roediger WE (1980) Role of anaerobic bacteria in the meta-bolic welfare of the colonic mucosa in man. Gut 21, 793 – 798. 11. Hamer HM, Jonkers D, Venema K, et al. (2008) Review Article: the role of butyrate on colonic function. Aliment Pharmacol Ther 27, 104 – 119.
12. Gantois I, Ducatelle R, Pasmans F, et al. (2006) Butyrate specifically down-regulates salmonella pathogenicity island 1 gene expression. Appl Environ Microbiol 72, 946 – 949. 13. Flint HJ, Duncan SH, Scott KP, et al. (2007) Interactions and
com-petition within the microbial community of the human colon: links between diet and health. Environ Microbiol 9, 1101–1111. 14. De Vuyst L & Leroy F (2011) Cross-feeding between bifido-bacteria and butyrate-producing colon bifido-bacteria explains bifidobacterial competitiveness, butyrate production, and gas production. Int J Food Microbiol 149, 73 – 80.
15. Gupta SS, Mohammed MH, Ghosh TS, et al. (2011) Metagenome of the gut of a malnourished child. Gut Pathog 3, 7.
16. Smith MI, Yatsunenko T, Manary MJ, et al. (2013) Gut micro-biomes of Malawian twin pairs discordant for kwashiorkor. Science 339, 548 – 554.
17. Lin A, Bik EM, Costello EK, et al. (2013) Distinct distal gut microbiome diversity and composition in healthy children from Bangladesh and the United States. PLoS ONE 8, e53838. 18. Yatsunenko T, Rey FE, Manary MJ, et al. (2012) Human gut microbiome viewed across age and geography. Nature 486, 222 – 227.
19. Grzeskowiak L, Collado MC, Mangani C, et al. (2012) Distinct gut microbiota in southeastern African and northern European infants. J Pediatr Gastroenterol Nutr 54, 812 – 816. 20. De Filippo C, Cavalieri D, Di Paola M, et al. (2010) Impact of diet in shaping gut microbiota revealed by a comparative study in children from Europe and rural Africa. Proc Natl Acad Sci U S A 107, 14691 – 14696.
21. Zimmermann MB & Hurrell RF (2007) Nutritional iron deficiency. Lancet 370, 511 – 520.
22. WHO (2002) Deficiency Anemia; Assessment, Prevention, and Control; A Guide for Programme Managers. Geneva: World Health Organization.
23. Lynch SR (2011) Why nutritional iron deficiency persists as a worldwide problem. J Nutr 141, 763S – 768S.
24. Dostal A, Chassard C, Hilty FM, et al. (2012) Iron deple-tion and repledeple-tion with ferrous sulfate or electrolytic iron modifies the composition and metabolic activity of the gut microbiota in rats. J Nutr 142, 271 – 277.
25. Werner T, Wagner SJ, Martinez I, et al. (2011) Depletion of luminal iron alters the gut microbiota and prevents Crohn’s disease-like ileitis. Gut 60, 325 – 333.
26. Tompkins GR, O’Dell NL, Bryson IT, et al. (2001) The effects of dietary ferric iron and iron deprivation on the bacterial compo-sition of the mouse intestine. Curr Microbiol 43, 38–42. 27. Dostal A, Fehlbaum S, Chassard C, et al. (2013) Low iron
availability in continuous in vitro colonic fermentations induces strong dysbiosis of the child gut microbial consor-tium and a decrease in main metabolites. FEMS Microbiol Ecol 83, 161 – 175.
28. Hilty FM, Arnold M, Hilbe M, et al. (2010) Iron from nano-compounds containing iron and zinc is highly bioavailable in rats without tissue accumulation. Nat Nanotechnol 5, 374 – 380.
29. Lee SH, Shinde P, Choi J, et al. (2008) Effects of dietary iron levels on growth performance, hematological status, liver mineral concentration, fecal microflora, and diarrhea inci-dence in weanling pigs. Biol Trace Elem Res 126, Suppl. 1, S57 – S68.
30. Zimmermann MB, Chassard C, Rohner F, et al. (2010) The effects of iron fortification on the gut microbiota in African children: a randomized controlled trial in Cote d’Ivoire. Am J Clin Nutr 92, 1406 – 1415.
31. Krebs NF, Sherlock LG, Westcott J, et al. (2013) Effects of different complementary feeding regimens on iron status and enteric microbiota in breastfed infants. J Pediatr 163, 416 – 423.
32. Buhnik-Rosenblau K, Moshe-Belizowski S, Danin-Poleg Y, et al. (2012) Genetic modification of iron metabolism in mice affects the gut microbiota. Biometals 25, 883 – 892. 33. Winter SE, Thiennimitr P, Winter MG, et al. (2010) Gut
inflammation provides a respiratory electron acceptor for Salmonella. Nature 467, 426 – 429.
34. Winter SE, Lopez CA & Baumler AJ (2013) The dynamics of gut-associated microbial communities during inflammation. EMBO Rep 14, 319 – 327.
35. Dethlefsen L, McFall-Ngai M & Relman DA (2007) An eco-logical and evolutionary perspective on human-microbe mutualism and disease. Nature 449, 811 – 818.
36. Alpert C, Sczesny S, Gruhl B, et al. (2008) Long-term stability of the human gut microbiota in two different rat strains. Curr Issues Mol Biol 10, 17 – 24.
37. Krych L, Hansen CH, Hansen AK, et al. (2013) Quantitatively different, yet qualitatively alike: a meta-analysis of the mouse core gut microbiome with a view towards the human gut microbiome. PLoS ONE 8, e62578.
38. Hanske L, Engst W, Loh G, et al. (2012) Contribution of gut bacteria to the metabolism of cyanidin 3-glucoside in human microbiota-associated rats. Br J Nutr 109, 1433 – 1441. 39. Wos-Oxley M, Bleich A, Oxley AP, et al. (2012) Comparative
evaluation of establishing a human gut microbial community within rodent models. Gut Microbes 3, 234 – 249.
40. Crouzet L, Gaultier E, Del’homme C, et al. (2013) The hypersensitivity to colonic distension of IBS patients can be transferred to rats through their fecal microbiota. Neuro-gastroenterol Motil 25, e272 – e282.
41. Iannotti LL, Tielsch JM, Black MM, et al. (2006) Iron sup-plementation in early childhood: health benefits and risks. Am J Clin Nutr 84, 1261 – 1276.
British
Journal
of
42. Forbes AL, Arnaud MJ, Chichester CO, et al. (1989) Compari-son of in vitro, animal, and clinical determinations of iron bioavailability: International Nutritional Anemia Consultative Group Task Force report on iron bioavailability. Am J Clin Nutr 49, 225 – 238.
43. de Sablet T, Chassard C, Bernalier-Donadille A, et al. (2009) Human microbiota-secreted factors inhibit shiga toxin syn-thesis by enterohemorrhagic Escherichia coli O157:H7. Infect Immun 77, 783 – 790.
44. Reeves PG, Nielsen FH & Fahey GC Jr (1993) AIN-93 purified diets for laboratory rodents: final report of the American Institute of Nutrition ad hoc writing committee on the refor-mulation of the AIN-76A rodent diet. J Nutr 123, 1939 – 1951. 45. Abatan OI, Welch KB & Nemzek JA (2008) Evaluation of saphenous venipuncture and modified tail-clip blood collec-tion in mice. J Am Assoc Lab Anim Sci 47, 8 – 15.
46. Engel MA, Kellermann CA, Rau T, et al. (2008) Ulcerative colitis in AKR mice is attenuated by intraperitoneally admi-nistered anandamide. J Physiol Pharmacol 59, 673 – 689. 47. Zihler A, Gagnon M, Chassard C, et al. (2010) Unexpected
con-sequences of administering bacteriocinogenic probiotic strains for Salmonella populations, revealed by an in vitro colonic model of the child gut. Microbiology 156, 3342 – 3353. 48. Pereyra LP, Hiibel SR, Prieto Riquelme MV, et al. (2010) Detec-tion and quantificaDetec-tion of funcDetec-tional genes of cellulose-degrad-ing, fermentative, and sulfate-reducing bacteria and methanogenic archaea. Appl Environ Microbiol 76, 2192–2202. 49. Ramirez-Farias C, Slezak K, Fuller Z, et al. (2009) Effect of inulin on the human gut microbiota: stimulation of Bifido-bacterium adolescentis and FaecaliBifido-bacterium prausnitzii. Br J Nutr 101, 541 – 550.
50. Schloss PD, Westcott SL, Ryabin T, et al. (2009) Introducing mothur: open-source, platform-independent, community-supported software for describing and comparing microbial communities. Appl Environ Microbiol 75, 7537 – 7541. 51. DeSantis TZ, Hugenholtz P, Larsen N, et al. (2006)
Green-genes, a chimera-checked 16S rRNA gene database and workbench compatible with ARB. Appl Environ Microbiol 72, 5069 – 5072.
52. Edgar RC, Haas BJ, Clemente JC, et al. (2011) UCHIME improves sensitivity and speed of chimera detection. Bioinformatics 27, 2194 – 2200.
53. Cleusix V, Lacroix C, Vollenweider S, et al. (2008) Glycerol induces reuterin production and decreases Escherichia coli population in an in vitro model of colonic fermentation with immobilized human feces. FEMS Microbiol Ecol 63, 56–64. 54. Gootenberg DB & Turnbaugh PJ (2011) Companion animals
symposium: humanized animal models of the microbiome. J Anim Sci 89, 1531 – 1537.
55. Kasaoka S, Yamagishi H & Kitano T (1999) Differences in the effect of iron-deficient diet on tissue weight, hemoglobin concentration and serum triglycerides in Fischer-344, Sprague – Dawley and Wistar rats. J Nutr Sci Vitaminol (Tokyo) 45, 359 – 366.
56. Lih-Brody L, Powell SR, Collier KP, et al. (1996) Increased oxidative stress and decreased antioxidant defenses in mucosa of inflammatory bowel disease. Dig Dis Sci 41, 2078 – 2086.
57. Seril DN, Liao J, Ho KL, et al. (2002) Dietary iron supple-mentation enhances DSS-induced colitis and associated colorectal carcinoma development in mice. Dig Dis Sci 47, 1266 – 1278.
58. Carrier JC, Aghdassi E, Jeejeebhoy K, et al. (2006) Exacer-bation of dextran sulfate sodium-induced colitis by dietary iron supplementation: role of NF-kappaB. Int J Colorectal Dis 21, 381 – 387.
59. Perl DP, Fogarty U, Harpaz N, et al. (2004) Bacterial – metal interactions: the potential role of aluminum and other trace elements in the etiology of Crohn’s disease. Inflamm Bowel Dis 10, 881 – 883.
60. da Silva SM, Venceslau SS, Fernandes CL, et al. (2008) Hydro-gen as an energy source for the human pathoHydro-gen Bilophila wadsworthia. Antonie Van Leeuwenhoek 93, 381 – 390. 61. Calusinska M, Happe T, Joris B, et al. (2010) The surprising
diversity of clostridial hydrogenases: a comparative genomic perspective. Microbiology 156, 1575 – 1588.
62. Balamurugan R, Mary RR, Chittaranjan S, et al. (2010) Low levels of faecal lactobacilli in women with iron-deficiency anaemia in south India. Br J Nutr 104, 931 – 934.
63. Cuiv PO, Klaassens ES, Durkin AS, et al. (2011) Draft genome sequence of Turicibacter sanguinis PC909, isolated from human feces. J Bacteriol 193, 1288 – 1289.
64. Arias CA & Murray BE (2012) The rise of the Enterococcus: beyond vancomycin resistance. Nat Rev Microbiol 10, 266 – 278.
65. Louis P, Young P, Holtrop G, et al. (2010) Diversity of human colonic butyrate-producing bacteria revealed by analysis of the butyryl-CoA:acetate CoA-transferase gene. Environ Microbiol 12, 304 – 314.
66. Karadag D & Puhakka JA (2010) Enhancement of anaerobic hydrogen production by iron and nickel. Int J Hydrogen Energy 35, 8554 – 8560.
67. Wei H, Dong L, Wang T, et al. (2010) Structural shifts of gut microbiota as surrogate endpoints for monitoring host health changes induced by carcinogen exposure. FEMS Microbiol Ecol 73, 577 – 586.
68. Conterno L, Fava F, Viola R, et al. (2011) Obesity and the gut microbiota: does up-regulating colonic fermentation protect against obesity and metabolic disease? Genes Nutr 6, 241– 260. 69. Hosseini E, Grootaert C, Verstraete W, et al. (2011) Propio-nate as a health-promoting microbial metabolite in the human gut. Nutr Rev 69, 245 – 258.
70. Luhrs H, Kudlich T, Neumann M, et al. (2002) Butyrate-enhanced TNFalpha-induced apoptosis is associated with inhibition of NF-kappaB. Anticancer Res 22, 1561 – 1568. 71. Luhrs H, Gerke T, Muller JG, et al. (2002) Butyrate inhibits
NF-kappaB activation in lamina propria macrophages of patients with ulcerative colitis. Scand J Gastroenterol 37, 458 – 466.
72. Roy MJ, Dionne S, Marx G, et al. (2009) In vitro studies on the inhibition of colon cancer by butyrate and carnitine. Nutrition 25, 1193 – 1201.
73. Chassard C, Dapoigny M, Scott KP, et al. (2012) Functional dysbiosis within the gut microbiota of patients with consti-pated-irritable bowel syndrome. Aliment Pharmacol Ther 35, 828 – 838.
74. Carbonero F, Benefiel AC, Alizadeh-Ghamsari AH, et al. (2012) Microbial pathways in colonic sulfur metabolism and links with health and disease. Front Physiol 3, 448. 75. Marquet P, Duncan SH, Chassard C, et al. (2009) Lactate has
the potential to promote hydrogen sulphide formation in the human colon. FEMS Microbiol Lett 299, 128 – 134.
76. Attene-Ramos MS, Nava GM, Muellner MG, et al. (2010) DNA damage and toxicogenomic analyses of hydrogen sulfide in human intestinal epithelial FHs 74 Int cells. Environ Mol Mutagen 51, 304 – 314.
77. Wallace JL, Vong L, McKnight W, et al. (2009) Endogenous and exogenous hydrogen sulfide promotes resolution of colitis in rats. Gastroenterology 137, 569 – 578, 578 e561. 78. Hirata I, Naito Y, Takagi T, et al. (2011) Endogenous hydrogen
sulfide is an anti-inflammatory molecule in dextran sodium sulfate-induced colitis in mice. Dig Dis Sci 56, 1379 – 1386.