European Heart Journal (1985) 6, 497-509
Comparison of intravenous digital subtraction
cineangiocardiography with conventional contrast
ventriculography for the determination of the left
ventricular volume at rest and during exercise
B. BIRCHLER, O. M. HESS, T. MURAKAMI, P. NIEDERER, M. ANLIKER AND H. P. KRAYENBUEHL Institute of Biomedical Engineering, Swiss Federal Institute of Technology Zurich and Department of
Medicine, Medical Policlinic, Cardiology, University Hospital Zurich, Switzerland
KEY WORDS: digital subtraction cineangiocardiography; contrast ventriculography; left ventricular volume; supine bicycle exercise; ejection fraction.
Left ventricular volumes were determined by means of digital subtraction cineangiocardiography (DSA) which was performed in the right anterior oblique projection after contrast agent injection into the superior vena cava. Monoplane end-diastolic (EDV), end-systolic volumes (ESV), and ejection fraction (EF) were calculated using the 'area-length' method and were compared with the same parameters obtained by conven-tional left ventricular cineangiocardiography. A first group of 20 patients was studied at rest and a second group of 10 patients during bicycle exercise at a work load of 64 watts during 2 min, by DSA and
conven-tional cineangiocardiography. Three different subtraction modes were evaluated: (1) mask mode subtraction (MMS), (2) time interval difference (TID) method and (3) a combination of MMS and TID called MMS+ TID method. With the MMS method good correlations were obtainedfor EDV, ESV and EF at rest (r>0-91) and during exercise (r>0-91). The TID method showed only moderate correlations for patients at rest (r>0-86) and during exercise (r>0-79). Similar results as with MMS were achieved by the com-bined method (MMS+TID) at rest (r>0-91) and during exercise (r>0-91). Interobserver variability indicated a high reproducibility for all methods except for TID during exercise.
It is concluded that DSA is an accurate technique for left ventricular volume determination not only at rest but also during exercise. The best results are obtained with MMS or MMS+ TID methods, while left
ventricular contour detection is easier and more convenient with MMS+ TID.
Intravenous digital subtraction angiocardiography because of its simplicity and its similarity to (DSA) has been shown" "7 ) to be a reliable tool for conventional angiocardiography,
assessing left ventricular function in man. Due to In patients with coronary artery disease left the fact that contrast material is injected through a ventricular function is studied preferably during intravenous catheter, this technique while still exercise because wall motion abnormalities, which invasive, is more convenient to the patient than often manifest themselves only under exercise conventional left ventricular angiocardiography, conditions are of diagnostic importance to detect However, the low contrast of these images has to ischaemic areas at risk. Digital subtraction angio-be enhanced by means of digital image processing cardiography offers the possibility to study to obtain a sufficiently contrasted angiocardio- patients not only at rest but also during exer-gram. The most widely used technique for studying cise'1 3'1 4'. However, a validation of this technique patients at rest is mask mode s u b t r a c t i o n '8"1^ with contrast ventriculography has not been published so far. Because suppression of respira-Received for publication on 28 December 1984 and in revised form tion during exercise is often difficult in many 26 February 1985. patients, motion artifacts and ambiguous contours This work was suponed by grant 3.804.0.82 from the Swiss appear in subtracted images due to misregistration National Science Foundation and by a grant of the EMDO o f t h e m a s k a n (j t h e c o n t r a s t containing frames, foundation. . . . . r- •
This is particularly true for mask mode imaging. Address far correspondence: B. Birchler, MSEE, and o. M. Hess, Therefore, the time-interval-difference technique ^CH^iZurict'sw^rtand"' UniVerSUy " " ^ " " " ^ w i t h a s h o r t t e mPo r a l separation (20ms to 80ms)
498 B. Birchler et al.
of the mask and the contrast containing frame has been proposed as a method to detect left ventri-cular function at rest'3' as well as during
exer-cise'13'. Thus, the purpose of the present study was
to validate digital subtraction angiocardiography for assessing global left ventricular function in patients with coronary artery disease at rest and during exercise using three different subtraction modes. In contrast to most other digital subtrac-tion angiocardiographic techniques where sub-tractions are performed from video recordings, we used digital subtraction of conventionally obtained cineangiographic frames (50 frames s"1) after
intravenous injection of the contrast agent. With this particular data carrier, high temporal and spatial resolution was achieved. As method of reference, conventional left ventricular cineangio-cardiography was used.
Patients and angiographic examination
Thirty-three patients (31 male, 2 female, 27-65 years of age) underwent left ventricular cineangio-cardiography for diagnostic purposes. Informed consent was obtained from all patients. Coronary artery disease was diagnosed in 29 patients. Four patients had normal coronary arteries. One patient was subsequently excluded from the study because of premature ventricular beats during left ven-tricular angiocardiography. Two patients were unable to suppress respiration during intravenous administration of the contrast agent resulting in severe motion artifacts which allowed no proper background subtraction. As a consequence, the study was performed in 20 patients at rest (group 1) and in 10 patients during exercise (group 2). The patients of group 1 were studied first by con-ventional left ventricular cineangiocardiography in the right anterior oblique projection (RAO) with injection of 45 ml Urographin 76% (12 ml s~') into the left ventricle with a 8F-pigtail catheter. The angiocardiogram was recorded on cinefilm by means of a Siemens Angioscop system at a frame rate of 50 frames s"1. Simultaneously, a standard
lead of the ECG and a numerical code which appeared also on the cinefilm were recorded on an oscillograph (Electronics for Medicine VR12) at a paper speed of 250 mm s"1.
After the first angiogram, an interval of 15min was allowed for dissipation of the haemodynamic effects of the contrast agent. Then, a second injec-tion of 45 ml Urographin (15 ml s~') was per-formed into the superior vena cava. The entire sequence starting one or two heart cycles before
the injection and ending after the contrast agent had passed through the left ventricle was recorded in RAO projection on cinefilm with the same framerate of 50 frames s " ' . During the passage of the contrast agent from the vena cava to the left ventricle, the patients were asked to hold their breath to avoid misregistration and patient motion.
The second group was studied during bicycle exercise at a work load of 50 or 75 W for 2 min (mean work load 64 W). At the end of the exercise period, conventional RAO left ventricular cine-angiocardiography was carried out first by injec-tion of 60 ml urographin with a flow rate of 16 to 18 ml s"'. Because the exercise test was performed twice and the patients had to suppress respiration during the injection the exercise test was carried out at a low or moderate work load. Again, after the first angiogram, an interval of 15 min was allowed for dissipation of the haemodynamic effects of the contrast agent. Then, bicycle exercise test was repeated at the same work load and dur-ation as before and 60 ml urographin (flow rate 17 ml s"1) were injected into the superior vena
cava. Because the apneic phase was too long for some patients, especially during exercise, slight degradation of the recorded images by motion artifacts was unavoidable in these instances. No patient experienced angina pectoris during the exercise test.
At the end of the procedure, a metal sphere of known diameter (6 cm) was filmed for calibration purposes.
Digital image processing
The cinefilm was automatically scanned on a computer-assisted (DEC PDP-11/45) image pro-cessing system (Fig. 1). The observer entered the numbers of the desired frames for digitization at the computer terminal. The cinefilm was then transported under computer control using a modi-fied Vanguard M-35 projector for film display. Digitization was carried out on a high resolution image dissector camera (EMR Photoelectric/ Schlumberger, ODD 658A). Individual image points were digitized with 12 bits resolution and stored in two semiconductor memories of 512x512 pixels after logarithmic transformation. Up to four frames representing end-diastole and end-systole, respectively, of consecutive heart cycles were digitized and averaged (Fig. 2, F) to reduce image noise. From the averaged image the
Digital subtraction cineangiocardiography 499 Vanguard projector Dissector camera Image memories Subtraction Subtracted image Video monitor
Figure 1 Image processing hardware: The 35-mm cinefllm
is transported on a Vanguard projector. Digitization is per-formed by a slow scanning camera. A mask image (M) and a iodinated frame (F) are logarithmically transformed and stored in 512x512 pixel matrices. The subtracted image is displayed on a high resolution video monitor. The operator only has to enter some patient data and the frame numbers to digitize. Then, film transportation, digitization and the subtraction procedure is performed automatically by computer control.
mask (M1 or M2) was subtracted to increase image contrast. After subtraction, the image was linearly amplified to extend the brightness over the whole dynamic range of the image processing system.
Three different subtraction modes were tested to determine the most accurate technique for volume determination with conventional angiocardio-grams as the reference method (Fig. 2).
MASK MODE SUBTRACTION (MMs'8 " '2 l)
The subtraction mask was usually taken before the agent was injected into the patient at the begin-ning of the film sequence (Fig. 2, Ml). In some patients the mask was taken at the end of the film sequence when the contrast agent had passed the left ventricle (M2) because of motion artifacts (e.g. cough) during the lung passage.
TIME INTERVAL DIFFERENCE ( T I D '1 1 1 2' )
TID imaging is based on the same algorithm as the mask mode subtraction except that the time between the mask and the opacified image is very short, namely in the range of 20 to 80 ms to minimize motion artifacts (Fig. 2). As a result, in the TID mode rapidly moving objects are visual-ized whereas stationary and slowly moving parts are subtracted and hence not seen. TID images were usually noisier than MMS images because averaging of multiple frames had to be avoided to obtain optimal sharpness of the subtracted image. TID AND MMS MODE (MMS + TID)
A combination of the previously described two methods was used to obtain adequate information for subsequent boundary detection. Therefore, TID mode was used to determine the rapidly moving sections of the left ventricular wall and MMS was used to complete boundary detection.
Contour detection and volume calculation
The left ventricular silhouette was traced by a semi-automatic contour detection algorithm on the high-resolution monitor. Since noise and motion artifacts often lead to a poor image quality, a fully automatic contour detection of the ventricle is not reliable for clinical routine. Therefore, boundary detection was performed on the monitor using a light-pen and a cursor. The observer had to select a random number of boundary points which were connected by a cubic spline function'151. The
boundary was approximated as close as possible by adding or removing points. Usually, a set of 15 to 20 points resulted in an acceptable approxi-mation of the left ventricular boundary. This method was used for MMS, TID and in an extended implementation also for MMS + TID: first, a set of edge points was determined using the TID image; then, the TID was replaced by the MMS image and the previously selected TID boundary points were superimposed and served as an aid to complete contour detection.
After determination of the left ventricular contour at end-diastole and end-systole, the left ventricular volume was calculated using the 'area-length' method'16' for monoplane angiograms.
Left ventricular ejection fraction was estimated from the end-diastolic minus end-systolic volume divided by the end-diastolic volume x 100. All parameters were determined by two independent observers (Obi and Ob2) for conventional
angio-500 B.Birchleretal. Injector pulse Iodine concentration ECG MMS:
t i l l
Ml M2 TID:Figure 2 Image subtraction modes: After injection of the contrast material (top line) into the superior
vena cava, it needs a certain time (about 6-8 s) to reach the left ventricle (concentration curve). For mask mode subtraction (MMS), a noniodinated mask (M1 or M2) is subtracted from a iodinated frame (F) to remove stationary information and enhance contrast. The end-diastolic and end-systolic frames are identified using the ECG curve. Noise can be suppressed by averaging several frames of subsequent heart cycles. Taking the mask after the contrast has passed through the left ventricle (M2) instead of the pre-injection mask M1 may be of advantage to correct for motion artifacts during lung passage of the iodine material. The subtraction algorithm is the same for time interval difference imaging (TID) but the time between the two frames is very short (20 to 80 ms) for imaging fast moving contours.
grams as well as for MMS, TID and MMS + TID intravenous angiograms. Accuracy and inter-observer variability between digital subtraction and conventional angiocardiography were assessed by linear regression analysis. The regression line is determined to go through the origin. The corre-lation coefficient (r) and the standard error of estimate of the mean (SEE; %) were calculated for both observers and all methods.
Results
Illustrative digitized angiograms of a patient at rest (Fig. 3) and during exercise (Fig. 4) are shown using the MMS (left hand panels) and TID method (right hand panels).
HAEMODYNAMIC MEASUREMENTS
Heart rate, left ventricular end-diastolic and peak systolic pressure were not significantly different between conventional and intravenous angiocardiograms (Table 1). Heart rate and end-diastolic pressure were significantly higher during
exercise than at rest. Peak systolic pressure was slightly but not significantly higher during exercise than at rest.
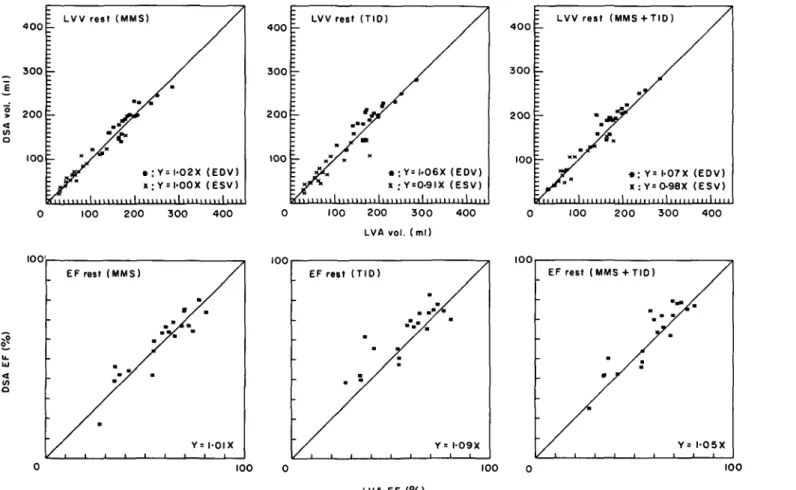
VALIDATION OF VOLUME DETERMINATION (FIGS 5, 6; TABLES 2, 3)
MMS subtraction mode
At rest and during exercise high correlation
Table I Haemodynamic measurements. Heart rale (HR) and end-diastolic pressure (EDP) were significantly higher during exercise than at rest (*P<0001, **P<001). The increase in peak systolic pressure (PSP) was not significant during exercise LVA DSA rest rest HR (beats min" EDP (mmHg) PSP (mmHg) 69* 16-9* 134 94 27-6 148 69* 18-8** 140 97 27-6 145
Digital subtraction cineangiocardiography 501
MMS TID
Figure 3 Subtraction images for a patient at rest (ED — end-diastole, ES — end-systole, MMS — mask mode subtraction, TID — time interval difference method). Note that the end-systolic left ventricular contour is slightly larger in the TID than MMS image due to the fact that filling has occurred between the subtracted ( = end-systole) and the iodinated frame.
coefficients (r> 0-911) were obtained for both observers. The SEE was usually low (SEE < 15% of the mean value of the reference method); it was highest for the end-systolic volumes.
TID subtraction mode
Correlation coefficients were lower for TID than the other two subtraction modes. At rest the differ-ences were small compared to the MMS mode but during exercise the correlation coefficient for the ejection fraction was considerably lower (not signi-ficant) for the TID than the MMS or MMS + TID mode. The SEE was highest for the TID mode at rest and during exercise and exceeded 20% for ejection fraction during exercise.
MMS+ TID subtraction mode
Correlation coefficients at rest and during exercise were comparable to the MMS mode but usually slightly higher. The SEE was generally
small; as with MMS it was highest for end-systolic volumes.
INTEROBSERVER VARIABILITY (FIGS 7, 8; TABLES 2, 3)
Interobserver variability for conventional angio-cardiographic volume determination was excellent (end-diastolic volume at rest r=0-995, during exer-cise r = 0-978; end-systolic volume at rest r = 0-988, during exercise r = 0-991; ejection fraction at rest r = 0-972, during exercise r = 0-990) and SEE was very low (SEE < 9%).
MMS subtraction mode
The correlation coefficient between the two observers was high for resting data (r > 0-930) and for end-systolic volume and ejection fraction dur-ing exercise (r> 0-948). However, the correlation coefficient was moderate for end-diastolic volume (r = 0-819) during exercise. The SEE was usually low (SEE < 13%) at rest and during exercise.
502 B. Birchler et al.
MMS TID
ES
Figure 4 Subtraction images for a patient during exercise (abbreviations as in Fig. 3).
TID subtraction mode
The correlation coefficient was good for end-diastolic volume at rest and during exercise (/•> 0-969; SEE = 6%) and moderate for end-systolic volume and ejection fraction during exercise with a large SEE.
MMS+ TID subtraction mode
High correlation coefficients were observed for all data at rest and during exercise (/•> 0-954; SEE
Discussion
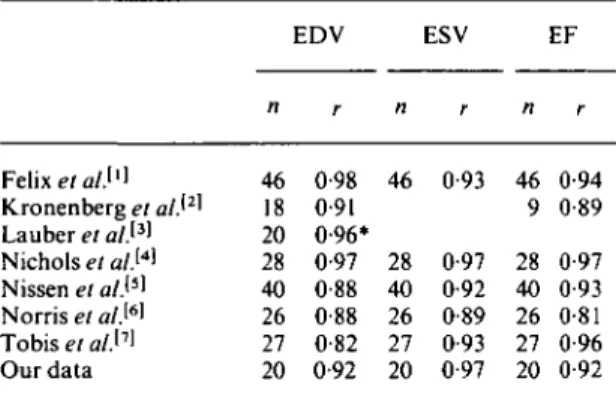
Digital subtraction angiocardiography has been shown by several groups to be a reliable technique for left ventricular volume determination at rest'1"7'. Several subtraction modes have been
used so far and data acquisition was usually performed using on-line video recordings. Most authors reported (Table 4) good correlation
coefficients for left ventricular volume determi-nation (r ranging from 0-82 to 0-98) and for ejec-tion fracejec-tion (r ranging from 0-81 to 0-97) at rest. Since temporal (25 or 30 frames s"1) and spatial
resolution of the video-based systems can be a limiting factor for assessment of left ventricular volumes, we decided to use cineangiocardiography for high temporal (50 framess""1) and spatial
(cinefilm) resolution. This is especially important during exercise when heart rate is increased. A sampling rate of 25 frames s"1 might be too low
and a considerable error might result in the determination of end-systole and end-diastole.
One goal of our study was to evaluate the accuracy of digital subtraction cineangiocardio-graphy for estimation of left ventricular volumes during bicycle exercise, because this technique has not been validated with contrast cineventriculo-graphy under exercise conditions. Recently, a com-parison of digital subtraction angiocardiography with radionuclide ventriculography during exercise
4 0 0 3 0 0 2 0 0 100 \ LVV rest (MMS) 4 0 0 3 0 0 2 0 0 100 ; LVV ~~T
i-~~ v
HI1 1 I 1 1 1 1 1 rest ( T I D )•r/
1 1 1 1 1 1 1 1 1 1 1 1 / • : X ; 111 / Y=|.06X Y = 0-9IX .ml,,111 / (EDV) (ESV) 100 200 300 400 0 100 200 3 0 0 400 LVA vol. (ml) 100 EF rest (MMS) 100 EF -• rest • / ( T I D ) Y / • = I-09X 4 0 0 3 0 0 2 0 0 100 : LVV rest I 1 1 1 1 1 1 I 1 1 I 1 1 I F (MMS • X + T I D ) ; Y= 1-07 X : Y=0-98X 1 / (EDV) (ESV) 100 200 300 400 100 EF rest (MMS +TIO) 100 100 100 LVft EF (%)Figure 5 Linear regression analysis for volumetric data at rest (LVV — left ventricular volume, EDV — end-diastolic volume, ESV — end-systolic
volume, EF — ejection fraction, LVA — left ventricular angiocardiography, DSA — digital subtraction angiocardiography, solid line — line of identity).
(ml ) OS A vol . 4 0 0 3 0 0 2 0 0 100 Z LVV exercise
E-L / *
'•• / (MMS)r
m • X i l l • Y = 0-93X .Y= 0-88X 1.... / (EOV) (ESV) 100 < o EF exercise (MMS) Y= 1-03 X 4 0 0 3 0 0 2 0 0 100 E LVV E- j-~/> I exercise • t ,,, 1 ( T I D ) • « : Y = I - O O X X :YsO-79X •, •, i , , , , 1 •,,,, / (EDV) ( E S V ) 100 200 3 0 0 LVA vol. (ml) 4 0 0 100 4 0 0 3 0 0 2 0 0 1 0 0 E LVV exercise E-:rL /
: /
( M M S M i * : Y x : Y l l l l l l l + T I O ) • • = I-02X = 0-93X M i l l , I, / (EDV) ( E S V ) I I M I M M 100 EFexercise (MMS+ TID) 0 100 0 100 O LVA EF (%)Figure 6 Linear regression analysis for volumetric data during exercise (abbreviations as in Fig. 5).
Digital subtraction cineangiocardiography 505
Table 2 Correlation coefficients (r) and standard error of the mean (SEE) for 20 patients at rest. Volumes are obtained by intravenous digital angiocardiography and compared to left ventricular angiocardiography
MMS TID MMS + TID Obl/Ob2
Obi Ob2 Obi Ob2 Obi Ob2 MMS TID MMS + TID
EDV: r 0-915 0-911 0-903 0-900 0-922 0-919 0-988 0-969 0-984 S E E % 10 10 11 11 10 10 3 6 4 ESV: r 0-967 0-975 0-912 0-948 0-950 0-984 0-974 0-946 0-975 S E E % 15 13 22 20 18 11 13 21 14 EF: r 0-918 0-915 0-857 0-905 0-912 0-962 0-930 0-888 0-954 S E E % 11 12 15 12 12 8 10 11 8
EDV — end-diastolic volume, ESV — end-systolic volume, EF — ejection fraction. Ob 1 — observer 1, Ob2 — observer 2.
Table 3 Correlation coefficients (r) and standard error of the mean (SEE) for 10 patients during exercise. Volumes are obtained by intravenous digital angiocardiography and compared to left ventricular angiocardiography (Abbreviations as in Table 2)
MMS TID MMS + TID Obl/Ob2
Obi Ob2 Obi Ob2 Obi Ob2 MMS TID MMS + TID
EDV: r 0-920 0-917 0-843 0-810 0-910 0-926 0-819 0-977 0-961 S E E % 7 9 15 13 10 8 13 6 6 ESV: r 0-964 0-936 0-807 0-855 0-952 0-945 0-948 0-819 0-959 S E E % 12 15 19 20 13 13 12 26 11 EF: r 0-933 0-933 0-792 0-792 0-936 0-920 0-958 0-772 0-974 S E E % 13 11 22 20 13 13 8 16 6
has been performed for left ventricular ejection patient motion. TID imaging is almost insensitive fraction'14' with a correlation coefficient of to slow respiratory motion and produces a good
r = 0-83. This correlation is lower than ours contrast for the fast moving ventricular wall but it because there was an average time difference of fails to detect local hypokinetic regions. Therefore, 42 days between the two examinations and the we combined both techniques in order to optimize radionuclide reference method has a consistently contour detection, the MMS + TID method, lower resolution than conventional cineangio- At rest, all three methods show reasonably good cardiography. results although the lowest correlation coefficients In the literature, two basic subtraction modes and the highest SEE were observed for the TID have been proposed^ namely the mask mode sub- method. This is probably due to the fact that hypo-traction (MMs'8~ ) and the time interval differ- and akinetic regions in patients with coronary
ence (TID'"1 2 )). We decided to compare these artery disease are responsible for low contrast TID
two subtraction modes for studying left ventricular images. This becomes more evident during exercise function at rest and during exercise. Both methods when correlation coefficients were considerably have advantages and limitations: MMS subtrac- lower for the TID than the other two methods. The tion produces images which are similar to conven- MMS and MMS + TID methods showed equally tional left ventricular angiocardiograms and good results at rest and during exercise although therefore easy to interpret but it is very sensitive to the MMS + TID method tended to have slightly
400 T E 300 r " 200 r 100 r : IOV 1 1 1 I 1 1 I 1 1 1 i i i | 1 i i i Y^ LVV i i m rest / I I I I I (MMS) / « : Y= 0-98X X : Y= 0-95X .,.,.,.,.1 / (EDV) (ESV) m i l i i i i 100 IOV EF rest (MMS) Y=I-O2X 4 0 0 300 2 0 0 100 \ IOV LVV j-'/, 1,,,, rest
J-m i ( T I D ) / « : Y = x : Y = 1 1 I 1 I 1 1 / 0-98X I-07X ,1 / (EDV) (ESV) 0 100 2 0 0 3 0 0 4 0 0 Observer I vol. (ml) 100 IOV EF rest ( T I D ) 4 0 0 3 0 0 200 100 E IOV j- E-Hi 1 1 1 I I 1 LVV / i i n n rest / r I ( M M S
y
/
X : Y = +y
0 1-,1 TIO) / 99X OIX / (EDV) (ESV) 100 2 0 0 3 0 0 4 0 0 100 IOV EF rest (MMS + T I D ) 0 100 Observer I EF (%)Figure 7 Interobserver variability (IOV): Resting data (abbreviations as in Fig. 5).
400 r E 300 != 200 100 -E l o v 'r LVV
y
I n n exercise (MMS) / • : Y= I-O6X x; Y= I-O6X , , , , ! ,,,,1 / (EDV) (ESV) 100 200 3 0 0 4 0 0 100 4 0 0 3 0 0 2 0 0 100 = IOV LVV j-'-L£
exercise / *: Y x : Y (TID) / = 0-9€X = I-IOX ,,,l (EDV) (ESV) 0 100 200 3 0 0 400 Observer I vol. (ml) 100IOV EF exercise (TIO)
4 0 0 3 0 0 2 0 0 100 IOV r
L
:
—
LVV exerciseJ
V x *. (MMS +TID) / Y = 0-95X (EDV) Y = 0-96X (ESV) I , , , , , , , , , ! , , , , 100 2 0 0 300 4 0 0 100IOV EF exercise (MMS + TID)
0 100 0
Observer I EF (%) Figure 8 Interobserver variability (IOV): Exercise data (abbreviations as in Fig. 5).
508 B. Birchler et al.
Table 4 Data from the literature for the comparison of volumes determined with digital subtraction angiocardi-ography and with conventional cineangiocardiangiocardi-ography. All patients were studied at rest and the subtraction technique was mask mode subtraction
EDV ESV EF Kronenberg et a/.'2' Lauber et a/.'3' Nichols et a/.'4' Nissen et a/.'5' Norris et a/.[6' Tobis et a/.'7' Our data 46 0-98 46 0-93 46 0-94 18 0-91 9 0-89 20 0-96» 28 0-97 28 0-97 28 0-97 40 0-88 40 0-92 40 0-93 26 0-88 26 0-89 26 0-81 27 0-82 27 0-93 27 0-96 20 0-92 20 0-97 20 0-92
*End-diastolic and end-systolic volumes are combined into one data set.
better correlation coefficients than the MMS method alone. Also the two observers judged the MMS + TID method to be the most convenient technique since it was usually very helpful for the observer to define the left ventricular contour from the two different types of subtracted images. This is most important during exercise when patient motion (respiration) becomes inevitable and the MMS method is affected by motion artifacts whereas the TID method remains interpretable.
A major benefit of digital subtraction angio-cardiography is that it is less invasive and does not induce arrhythmias which is especially important during exercise. Another advantage is the pos-sibility of assessing left ventricular function during exercise which has so far only been possible with nuclear imaging techniques or echocardiography. Assessment of left ventricular volumes by radio-nuclide ventriculography has been validated at rest'17"22'. The studies showed a good correlation
mainly between the count-based methods of radio-nuclide ventriculography and conventional angio-cardiography. There are several problems with quantitative radionuclide angiography: accurate calibration is difficult, there are superposition problems with the left atrium in the left anterior oblique (LAO) position, the basic resolution is inferior to angiocardiography and long acquisition times are affected by respiratory artifacts. The accuracy of the estimation of left ventricular
ejec-tion fracejec-tion by 2D-echocardiography is generally satisfactory'23 ~25' but systematic underestimation
of left ventricular volume up to 40% '23' remains a
basic problem. The estimation of left ventricular volume by echocardiography becomes much more difficult during exercise when respiratory motions interfere with adequate echocardiographic record-ings. Several other problems limit echocardio-graphic volume determination: only in a minority of patients is it possible to record the true apex of the left ventricle due to the anatomic limitations (echo-window), 2D-echocardiography provides only a tomographic section of the left ventricle (and not the maximal outer border as with angio-cardiography) and temporal as well as spatial resolution is inferior to angiocardiography.
Thus, digital subtraction angiocardiography appears to be superior to radionuclide ven-triculography and echocardiography with regard to temporal and spatial resolution and accuracy of left ventricular volume determination during exer-cise. Possible drawbacks of digital subtraction angiography are motion artifacts at high work loads; furthermore, repeated contrast agent injec-tion may change basic haemodynamics per se in contrast to radionuclide ventriculography or echo-cardiography. The reported data are limited to one angiographic projection (RAO) which might be problematic in some patients with posterior asynergic regions. However, future applications of digital subtraction angiocardiography will possibly include the LAO projection as well when special subtraction modes solve the problem of left atrial overlap.
The costs are a difficult factor to evaluate. They are comparable to those involved with stress radionuclide ventriculography. Because the exam-ination procedure is similar to conventional angio-cardiography the personnel and installations of the catheterization laboratory can be used without additional expenditure during free hours between routine examinations. The costs for our digital image processing system range from $70 000 to S80 000. The currently used system is very versatile and is also used for other image processing applications at our institute.
In summary, we can conclude that digital sub-traction cineangiocardiography allows accurate determination of left ventricular function both at rest and during exercise. The combination of mask mode subtraction and time interval difference seems to be the best subtraction technique for left ventricular contour detection.
Digital subtraction cineangiocardiography 509
References
[1] Felix R, Eichstaedt H, Kempter H et al. A comparison of conventional contrast ventriculography and digital subtraction ventriculography. Clin Cardiol 1983; 6: 265-76.
[2] Kronenberg HW, Price RR, Smith CW et al. Evalu-ation of left ventricular performance using digital subtraction angiography. Am J Cardiol 1983; 51: 837-42.
[3] Lauber A, Fischbach T, Jehle J et al. Digital subtrac-tion angiocardiography: accuracy of determinasubtrac-tion of left ventricular volumes using intravenous injection of contrast medium. Z. Kardiol 1983; 72: 262-7.
[4] Nichols AB, Martin EC, Fles TP et al. Validation of the angiographic accuracy of digital left ventriculography. Am J Cardiol 1983; 51: 224-30.
[5] Nissen SE, Booth D, Waters J, Fassas T, DeMaria AN. Evaluation of left ventricular contractile pattern by intravenous digital subtraction ventriculography: comparison with cineangiography and assessment of interobserver variability. Am J Cardiol 1983; 52: 1293-8.
[6] Norris SL, Slutsky RA, Mancini GJ et al. Comparison of digital intravenous ventriculography with direct left ventriculography for quantitation of left ventricular volumes and ejection fractions. Am J Cardiol 1983; 51: 1399-403.
[7] Tobis J, Nacioglu O, Johnston WD et al. Left ven-tricular imaging with digital subtraction angiography using intravenous contrast injection and fluoroscopic exposure levels. Am Heart J. 1982; 104: 20-7. [8] Vas R, Diamond GA, Forrester JS, Whiting JS, Swan
HJC. Computer enhancement of direct and venous-injected left ventricular contrast angiography. Am Heart J 1981: 102; 719-28.
[9] Brennecke R, Brown TK, Buersch J, Heintzen PH. Digital processing of videoangiocardiographic image series using a minicomputer. In: Computers in cardi-ology. St. Louis, 1976: 255-260.
[10] Brody WR. Digital subtraction angiography. IEEE Trans Nuc Sci 1982; 29: 1176-80.
[11] Kruger RA, Mistretta CA, Houk TL et al. Real-time computerized fluoroscopic cardiac imaging. In: Non-invasive cardiovascular measurements. Proc SPIE, 1978; 167: 77-82.
[12] Shaw CG, Ergun DL, Kruger RA et al. Intravenous angiography using computerized fluoroscopy. IEEE Trans Nuc Sci 1980; 27: 1042-6.
[ 13] Spiller P, Fischbach T, Jehle J et al. Reliability of digital subtraction angiocardiography for the estimation of left ventricular function during exercise. Z Kardiol 1983; 72: 681-7.
[14] Goldberg HL, Moses JW, Borer JS et al. Exercise left ventriculography utilizing intravenous digital angio-graphy. J Am Coll Cardiol 1983; 2: 1092-8.
[15] Henrici P. Essentials of numerical analysis. New York: John Wiley, 1982: 260-74.
[16] Sandier H, Dodge HT. Angiographic methods for determination of left ventricular geometry and volume. In: Mirsky I, Ghista DN, Sandier H, eds. Cardiac mechanics. New York: John Wiley, 1974: 141-70. [17] Dehmer GJ, Firth BG, Lewis SE, Willerson JT, Hillis
LD. Direct measurement of cardiac output by gated equilibrium blood pool scintigraphy: validation of scintigraphic volume measurements by a nongeometric technique. Am J Cardiol 1981; 47: 1061-7.
[18] Dehmer GJ, Firth BG, Hillis LD et al. Alterations in left ventricular volumes and ejection fraction at rest and during exercise in patients with aortic regurgitation. Am J Cardiol 1981; 48: 17-27.
[19] Slutsky R, Karliner J, Ricci D et al. Left ventricular volumes by gated equilibrium radionuclide angio-graphy: a new method. Circulation 1979; 60: 556-64. [20] Massie BM, Kramer BL, Gertz EW, Henderson SG.
Radionuclide measurements of left ventricular volume: comparison of geometric and counts-based methods. Circulation 1982; 65: 725-30.
[21] Parrish MD, Graham TP, Born ML, Jones JP, Boncek RJ, Partain CL. Radionuclide ventriculography for assessment of absolute right and left ventricular volumes in children. Circulation 1982; 66: 811-19. [22] Maurer AH, Siegel JA, Denenberg BS et al. Absolute
left ventricular volume from gated blood pool imaging with use of esophageal transmission measurement. Am J Cardiol 1983; 51: 853-8.
[23] Carr KW, Engler RL, Forsythe JR, Johnson AD, Gosink B. Measurement of left ventricular ejection fraction by mechanical cross-sectional echocardio-graphy. Circulation 1979; 59: 1196-206.
[24] Schiller NB, Acquatella H, Ports TA et al. Left ven-tricular volume from paired biplane two-dimensional echocardiography. Circulation 1979; 60: 547-55. [25] Jenni R, Vieli A, Hess O, Anliker M, Krayenbuehl HP.
Estimation of left ventricular volume from apical orthogonal 2-D echocardiograms. Eur Heart J 1981; 2: 217-25.