République Algérienne Démocratique et Populaire
Ministère de l’Enseignement Supérieur et de la Recherche Scientifique
Université Hadj Lakhdar Batna
Faculté de Technologie
Département d’Électronique
Mémoire
Présenté pour l’obtention du diplôme de
MAGISTER en Électronique
OPTION
Traitement du Signal
Par
Asma BOUNOUARA
Thème
QRS Detection In ECG Signals
Soutenu devant le jury composé de :
Dr. Moussa BENYOUCEF Professeur. Université de Batna Président Dr. Nabil BENOUDJIT Professeur. Université de Batna Rapporteur Dr. Noureddine GHOGGALI Maitre de conférences. Université de Batna Co-rapporteur Dr. Abdelhamid BENAKCHA Professeur. Université de Biskra Examinateur Dr. Redha BENZID Professeur. Université de Batna Examinateur
People.s Democratic Republic of Algeria
Ministry of Higher Education and Scientific Research
University of Batna 02
Faculty of Technology
Department of Electronics
A Dissertation
Presented
in partial fulfilment of the requirement
for the degree of
Magister
In Electronics
OPTION:
Signal processing
By
Asma BOUNOUARA
QRS Detection In ECG Signals
Examination committee
Dr. Moussa BENYOUCEF Professor. University of Batna President Dr. Nabil BENOUDJIT Professor. University of Batna supervisor Dr. Noureddine GHOGGALI Maître de conferences. University of Batna Co-supervisor Dr. Abdelhamid BENAKCHA Professor. University of Biskra reviewer Dr. Redha BENZID Professor. University of Batna reviewer
Table of Contents
Acknowledgment
Abstract
List of figures
List of tables
Introduction
01CHAPTER I
Basic notions of cardiology
04Introduction 04
I Anatomy and physiology of the heart 04
I.1 Location of the Heart 04
I.2 Anatomy of the Heart 05
I.2.1 The heart’s chambers 05
I.2.2 The heart’s valves 06
I.3 Blood circulation System 07
I.4 The cardiac cycle 08
I.4.1 Atrial Contraction 10
I.4.2 Isovolumetric Contraction 10
I.4.3 Rapid Ejection 11
I.4.4 Reduced Ejection 12
I.4.5 Isovolumetric Relaxation 12
I.4.6 Rapid Filling 13
I.4.7 Reduced Filling 14
Conclusion 14
CHAPTER II
The Electrocardiogram
15Introduction 15
II.1 Definition 15
II.2 History of Electrocardiography 15
II.3 Leads in ECG 16
II.4 Origin of electrical current in the heart 18 II.4.1 Flow of Electrical Current 18 II.4.2 Impulse origin and atrial depolarization 18 II.4.3 Septal depolarization 19 II.4.4 Apical and early ventricular depolarization 19 II.4.5 Late ventricular depolarization 19 II.4.6 Ventricular repolarization 20 II.4.7 The whole cardiac cycle 20
II.5 The ECG components 21
II.5.1 The Isoelectric Line (baseline) 22
II.5.2 The P wave 22
II.5.3 The PR segment 23
II.5.4 The PR interval 23
II. 5.5 The QRS complex 24
II.5.6 R-R interval 25
II.5.7 The T wave 25
II.6 Noise in ECG signal 27 II.6.1 Power line interferences 27
II.6.2 Baseline drift 27
II.6.3 Movement artifacts 27
II.6.4 Muscle contraction (EMG) 27 II.7 Steps in ECG Analysis 27
Conclusion 28
CHAPTER III
Algorithm of Detection
29Introduction
29 III.1 Structure of the QRS detection Algorithm 29
III.2 The ECG signal filtering 30
III.2.1 Design Techniques of FIR and IIR Filters 31
III.2.2 A comparison between IIR and FIR filters
33III.3 State of the art 34
III.4 Adapted Solution 38
III.4.1 Pan and Tompkins Algorithm methods 38 III.4.2 The bandpass filter 39 III.4.3 The derivative filter 42 III.4.4 The squaring function 43 III.4.5 Moving window integrator 44 III.4.6 QRS detection using Adaptive thresholds 45 III.4.7 The searchback technique 46
conclusion 47
CHAPTER IV
Results and Discussion
49Introduction
48 IV.1 Presentation of the database 48 IV.2 Files in the MIT/BIH database 49 IV.3 Power spectrum of the ECG 49
IV.4 QRS Detection Algorithm 50
IV.5 results obtained by the implementation of Pan and Tompkins filter blocks 53 IV.5 .1 The bandpass filter 53 IV.5 .2 Derivative filter 55
IV.5.3 Squaring function 55
IV.5.3 Moving window integrator 56
IV.6.1 Fiducial mark (Find Peaks) 57
IV.6.2 Thresholding 57
IV.6.3 Searchback for missed QRS complexes 58 IV.6.4 Elimination of multiple detection 58 IV.6.5 T wave discrimination 58
IV.6.6 The final stage 59
IV.7 The influence of the width of the moving window integrator 61 IV.8 The influence of the Fiducial mark 63
conclusion 69
Conclusion and Future work
71Acknowledgment
Firstly, I thank Allah, the Most High, for the opportunity He gave me to study, to research and to write this dissertation. Thank Allah, my outmost thanks, for giving me the ability, the strength, attitude and motivation through this research and to complete this work. I wish to express my special gratitude to my supervisors Professor Nabil BENOUDJIT and
Dr. Noureddine GHOGGALI for accepting supervise me as a student at the Department of
Electronics. I am sincerely grateful for your guidance, wisdom, and specially your endless patients in dealing with me throughout all these years. It is difficult to overstate my gratitude to you, with your enthusiasm, your inspiration, and your great efforts make this approach easier. Many thanks to you for assisting me throughout my thesis-writing period; you provided encouragement, sound advice, and lots of good ideas. Thank you for believing me and for giving me good advice, support and freedom along the way.
I would like to thank Professor Moussa BENYOUSSEF from University of Batna for being president of the examination committee. I would like to thank my oral thesis committee members, Professor Redha BENZID from University of Batna, Dr. Abdelhamid
BENAKCHA from University of Biskra for accepting the examination of this thesis.
I would like to thank all my friends, colleagues and the staff at the Department of Electronics, University of Batna for their help along the realisation of this work.
My deep gratitude is due,
to my parents
for their devotion, sacrifices, continuous guidance, encouragement, support, and prayers for my whole life. Thanks are due,to my
husband
,my brothers and my sister
for their cooperation and help. I also want tothank all my immediate and extended family members
for all their love and support.Abstract
The Electrocardiogram ECG is a fundamental part of cardiovascular assessment. It is an essential tool for investigating cardiac arrhythmias and is also useful in diagnosing cardiac disorders such as myocardial infarction. The importance of the electrical activity of the heart has attracted attention of many scientists in the domain of diagnostic pathology in the myocardium due to the fact that theirs electrical activity can be the source of a wealth of valuable information on the state structure and function of the cardiovascular system. Because the QRS complex is the major feature in ECG signal, we applied Pan and Tompkins algorithm to detect the location of the R-peak in the ECG signal and later we try to improve as an improvement to this, we belive that the well choose of certain free parameter described in the original paper will results in an increase of the detection capability.
Keywords : ECG, R-peaks, Pan and Tompkins.
Résumé
L'électrocardiogramme ECG est un élément fondamental de l'évaluation cardiovasculaire système. C’est un outil essentiel pour examiner les arythmies cardiaques et également utile dans le diagnostic des troubles cardiaques comme l'infarctus du myocarde. L'importance de l'activité électrique du cœur a attiré l'attention de nombreux scientifiques dans le domaine de la pathologie de diagnostic dans le myocarde due au fait que leur activité électrique peut être la source de plusieurs informations précieuses sur la structure de l'état et le fonctionnement du système cardiovasculaire. Parce que le complexe QRS est la caractéristique majeure du signal ECG, nous avons appliqué Pan et Tompkins algorithme pour détecter l'emplacement de R-pic dans le signal ECG. Comme amélioreation pour ce dernier, nous croyant que le choix judicieux de certain parametr decrit dans le papier original aurra un impact positif en term de detection .
Mots-clés: ECG, R-pic, Pan et Tompkins.
ﺺﺨﻠﻤﻟا
ﻂﯿﻄﺨﺘﻟا ﺐﻠﻘﻠﻟ ﺔﯿﺋﺎﺑﺮﮭﻜﻟا ECG ﻮھ ءﺰﺟ ﻲﺳﺎﺳأ ﻦﻣ ﻢﯿﯿﻘﺗ ﻞﻤﻋ ﺐﻠﻘﻟا ﺔﯿﻋوﻷاو ﺔﯾﻮﻣﺪﻟا . ﻮھو ةادأ ﺔﯿﺳﺎﺳأ ﻖﯿﻘﺤﺘﻠﻟ ﻲﻓ مﺪﻋ مﺎﻈﺘﻧا تﺎﺑﺮﺿ ﺐﻠﻘﻟا ﺪﯿﻔﻣو ﺎﻀﯾأ ﻲﻓ ﺺﯿﺨﺸﺗ تﺎﺑاﺮﻄﺿا ﺐﻠﻘﻟا ﻞﺜﻣ ءﺎﺸﺘﺣا ﺔﻠﻀﻋ ﺐﻠﻘﻟا . طﺎﺸﻨﻟا ﻲﺋﺎﺑﺮﮭﻜﻟا ﺐﻠﻘﻠﻟ بﺬﺟ مﺎﻤﺘھا ﺪﯾﺪﻌﻟا ﻦﻣ ءﺎﻤﻠﻌﻟا ﻲﻓ لﺎﺠﻣ ﺺﯿﺨﺸﺘﻟا ﻲﺿﺮﻤﻟا ﻲﻓ ﺔﻠﻀﻋ ﺐﻠﻘﻟا و ﻊﺟﺮﯾ ﻚﻟذ ﻰﻟإ ﺔﻘﯿﻘﺣ نأ طﺎﺸﻨﻟا ﻲﺋﺎﺑﺮﮭﻜﻟا ﻦﻜﻤﯾ نأ نﻮﻜﯾ ارﺪﺼﻣ ﺪﯾﺪﻌﻠﻟ ﻦﻣ تﺎﻣﻮﻠﻌﻤﻟا ﺔﻤﯿﻘﻟا ﻦﻋ ﺔﻟﺎﺣ ﺔﻔﯿظو مﺎﻈﻧ ﺐﻠﻘﻟا ﺔﯿﻋوﻷاو ﺔﯾﻮﻣﺪﻟا . ﺪﻌﯾو ﻊﻤﺠﻣ QRS ﺔﯿﺻﺎﺧ ﺔﯿﺴﯿﺋر ﻲﻓ ةرﺎﺷإ ECG ، ﺎﻨﻘﺒط ﺔﯿﻣزراﻮﺧ Pan و Tompkins ﻒﺸﻜﻠﻟ ﻦﻋ نﺎﻜﻣ دﻮﺟو R -رذ ةو ﻲﻓ ةرﺎﺷإ ECG . ﺎﻤﻛ لوﺎﺤﺗ ﻦﯿﺴﺤﺗ ةرﺪﻘﻟا ﻰﻠﻋ ﻒﺸﻜﻟا ﻦﻋ هﺬھ ،ﺔﯿﻣزراﻮﺨﻟا ﻊﻤﺠﻣ ﻦﻋ ﻒﺸﻜﻟا ﺞﺋﺎﺘﻧ تﺎﺒﺛإ ﺎﻨﻟوﺎﺣ QRS ﻲﻓ ﺔﯿﻣزراﻮﺨﻟا هﺬھ لﺎﻘﻤﻟا ﻲﻓ ﺔﺑﻮﺘﻜﻤﻟا ةﺮﺤﻟا ﺮﯿﯾﺎﻌﻤﻟا ﺾﻌﺑ ﺮﯿﯿﻐﺑ ﺎﻨﻤﻗ ﻲﻠﺻﻻا ىدأ ﺎﻤﻣ ﻰﻟإ ةدﺎﯾز ﻲﻓ ةرﺪﻘﻟا ﻰﻠﻋ ﻒﺸﻛ ﻊﻤﺠﻣ QRS . تﺎﻤﻠﻜﻟا - ﺔﯿﺣﺎﺘﻔﻤﻟا : Pan و Tompkins ، R ةورذ ، ECGLIST OF FIGURES
General Introduction
Figure I: Normal ECG with the waves that is consisted noted... 1
Chapter I
Figure I. 1: Location of the heart in the thorax. It is bounded by the diaphragm, lungs, esophagus, descending aorta, and sternum... 5Figure 1.2: the heart's chambers... 6
Figure 1.3: The heart's valves... 7
Figure 1.4: The Circulation System... 8
Figure 1.5: The cardiac cycle... 9
Figure 1.6: Atrial contraction... 10
Figure 1.7: Isovolumetric contraction... 11
Figure 1.8: Rapid ejection... 12
Figure 1.9: Reduced ejection... 12
Figure 1.10: Isovolumentric relaxation... 13
Figure 1.11: Rapid filling... 13
Figure 1.12: Reduced filling (diastasis)... 14
Chapter II
Figure 2.1: Position of Einthoven leads... 16Figure 2.2: Einthoven leads and Goldberger leads position... 17
Figure 2.3:standard ECG Wilson leads position (V1, V2 ...V6)... 17
Figure 2.4: Flow of electrical current... 18
Figure 2.5: Atrial depolarization... 18
Figure 2.6: Septal depolarization... 19
Figure 2.7: Apical and early ventricular depolarization... 19
Figure 2.8: Late ventricular depolarization... 20
Figure 2.9: Ventricular repolarization... 20
Figure 2.10: The whole cardiac cycle... 21
Figure 2.11: Schematic representation of normal ECG waveform... 21
Figure 2.12: Baseline or Isoelectric Line... 22
Figure 2.13: P wave... 22
Figure 2.14: The PR segment... 23
Figure 2.15: The PR Interval... 23
Figure 2.16: The QRS complex... 24
Figure 2.17: Various QRS complex Morphologies... 25
Figure 2.18: R-R interval... 26
Figure 2.19: T wave... 26
Chapter III
Figure 3.1: The common structure of the QRS detectors... 30
Figure 3.2: FIR Filter Structure... 32
Figure 3.3 IIR Filter Structure... 32
Figure 3.4: Block filter stages of the QRS detector using pan and Tompkins algorithm ECG is the input signal; z (n) is the time-averaged signal... 38
Figure 3.5: Amplitude response; Phase response of the low-pass filter... 40
Figure 3.6: The high-pass filter is implemented by subtracting a low-pass filter from an all-pass filter with delay... 41
Figure 3.7: Amplitude response; Phase response of the High pass filter... 42
Figure 3.8: Amplitude response; Phase response of the derivative filter... 43
Figure 3.9: The relationship of a QRS complex to the moving integration waveform. (a) ECG signal. (b) Output of moving window integrator. QS: QRS width. W: width of the integrator window... 44
Chapter IV
Figure 4.1 Relative power spectrum of QRS complex, P and T waves, muscle noise and motion artifacts... 50Figure 4.2: The QRS Detection Procedure... 52
Figure 4.3: Original input ECG signals 100.dat... 53
Figure 4.4: Low-pass filtered ECG signal... 54
Figure 4.5: High-pass filtered ECG signal... 54
Figure 4.6: ECG signal after bandpass filtering and differentiation... 55
Figure 4.7: ECG signal after squaring function... 56
Figure 4.8 Signal after moving window integration... 56
Figure 4.9: comparative of some between the better cases obtained and Pan and Tompkins results... 60
Figure 4.10: The variation of the peaks detected based on the length of MWI in the record 105... 61
Figure 4.11: The variation of the peaks detected based on the length of MWI in the record 108... 62
Figure 4.12: The variation of the peaks detected based on the length of MWI in the record 201... 62
Figure 4.13: The variation of the peaks detected based on the length of MWI in the record 202... 63
Figure 4.14: The variation of the peaks detected based on the min distance (FP) in the record 108... 64
Figure 4.15: The variation of the peaks detected based on the min distance (FP) in the record 203... 64
Figure 4.16: The variation of the peaks detected based on the min distance (FP) in the record 106... 65
Figure 4.17: The variation of the peaks detected based on the min distance (FP) in the record 207... 65
LIST OF TABLES
Chapter IV
Table 4.1 Results obtained in term of detection... 60 Table 4.2 Results of evaluation QRS detection using MIT/BIH database in the first 30s 68 Table 4.3 Results of evaluation QRS detection using MIT/BIH database... 69 Table 4.4 Results of evaluation QRS detection using MIT/BIH database... 69
Introduction
1
Introduction
Electrocardiography
The heart is one of the most important and critical organ in the human body, thus the need to develop a method for automatic monitoring its functionality is extremely important. Electroca-rdiography is considered to be one of the most powerful diagnostic tools in medicine that is periodically used for the evaluation of the functionality of the heart. The electrocardiogram (ECG) is the traditional method for non-invasive interpretation of the electrical activity of the heart in real-time. The electrical cardiac signals are recorded by mean of external sensors, by connecting electrodes to the surface of the skin of the patient’s thorax. The electrical currents stimulate the cardiac muscle and cause the contractions and relaxations of the heart [1]. The electrical signals sensed by the sensors are sent to the ECG device, which records them as feature waves. Different waves reflect the activity of different areas of the heart which generate the respective flowing electrical current. Figure 1 shows a schematic representation of normal ECG and its diverse waves.
Figure 1 Normal ECG with the waves that is consisted noted.
Characteristics of normal electrocardiogram
A normal ECG consists of P wave, a QRS complex, and T wave. The P wave is generated by electric currents produced by the depolarization of the atria before their contraction, while the QRS complex is caused by electric currents produced by the depolarization of the ventricles prior to their contraction, during the extending of the depolarization in the ventricular myocardium [2]. The QRS complex commonly consist of three different waves, the Q, R and S waves it’s worth noting that both the P wave, and the waves that form the QRS complex, are depolarization waves. The electric currents produced during recovery of the ventricles from the state of depolarization are the causative factor of the T wave. This process takes place in the ventricular myocardium 0.25s to 0.35s after the depolarization. The T wave has the peculiarity to be the wave of repolarization.
Introduction
2
Why is the ECG important?
The ECG has been established as the most common and easiest way for accurate and rapid diagnosis and management of numerous cardiovascular incidents. A significant number of patients treated in the emergency room (ER) and in the intensive care unit (ICU), present with cardiovascular complaints. In those cases, the needs of early, accurate diagnosis as well as rapid, appropriate therapy reinforce the importance of electrocardiography. Some examples of incidents that are ideally managed with an ECG are chest pain (presenting ST segment elevation), acute myocardial infarction, acute coronary syndrome, arrhythmias, and even suspected pulmonary embolism [2].
Principal methods for ECG analysis
Nowadays digital electrocardiography is a well established practice, after many years of significant improvement. Many algorithms have been proposed over years to tackle the issue of the QRS detection in the ECG signal and classification. Because the QRS complex is the most significant waveform the ECG detection is the first step in every automated algorithm for ECG analysis owing to their characteristic shape, the QRS complexes serve as reference point for the automatic heart rate detection analysis and feature extraction. The QRS complex detection has been a research topic for more than many years. Numerous new approaches have been proposed in the literature, in order to find the best automatic QRS detection method [3].
Artifacts in the ECG signal
Unfortunately the acquired of the ECG signal does not only include the useful components derived from the electrical functionality of the heart, but very often contain artifacts that can interfere the signal and result in a degradation/loss of the quality of the signal. Sometimes, these artifacts might even present with morphology which are similar to the ECG [4]. The most commonly found noises in the ECG are:
1. Power line interference. 2. Baseline drift.
3. Muscle contraction (EMG). 4. Movement artifacts.
The influence of artifacts in the ECG signal significantly makes its analysis difficult if not impossible. This occurs because there is a high overlap between the artifacts and the signal, scarce work has been done on artifacts detection and removal and thus the literature found on this subject
Introduction
3
is rather limited. In general those methods can only minimize the influence of some artifacts, but in the majority of the cases they are enable the totally remove the artifacts.
Purpose and motivation
The purpose of this thesis was to analyze the ECG signal and more specifically, to apply the method described by the Pan and Tompkins algorithm for the detection of the QRS complexes. To avoid erroneous results, at first the QRS identification should goes to detection and removal phase from the ECG signal, so that the QRS detection would be more robust.
The ECG data used for this work was found in the PhysioNet library (http://physionet.org). This physiological database provided by the collaboration between Massachusetts Institute of Technology and Boston’s Beth Israel Hospital (MIT/BIH). The MIT/BIH arrhythmia database contains 48 half hour of two channel ambulatory ECG recording, obtained from 47 subjects studied by the BIH arrhythmia laboratory .The subjects were 25 men aged between 32 and 89 years and 22 women aged between 23 and 89 years. This database contains lots of labelled artifacts by human experts, which interfere with the normal and abnormal ECG signals.
The adopted method for successful artifacts detection and removal and then QRS complex detection, was achieved by linear filtering, non-linear transformation and decision rule algorithm. The first step is to use a digital band pass filter to eliminate all the high frequency and to reduces false detections caused by the various artifacts present in ECG signals, in the next step is to differentiated the filtered signal to get information about the slope of the QRS complex, the non-linear transformation is the squared step, it used to amplify the output of derivation stage and finally computed integral of each moving window to quantify QRS and non-QRS. And an adaptive thresholds is done for both band pass and integrated signal to improve the of the QRS detection.
The outline of our work plan includes four chapters;the first chapter will be devoted to the basic notion of the main element of the cardiovascular system, the heart. The second chapter is assigned to acquisition of the electrocardiogram and the most component of ECG signal. Chapter three discusses the adapted solution of the QRS complex detection algorithm (Pan and Tompkins algorithm). We finished this modest work by reporting the results of the filtering phase performed on the ECG signals of the standard database MIT/BIH and the results of the QRS complex detection by the implemented algorithm. We finished this work by a conclusion and a suggesting of some ideas in the future work.
Chapter I Basic notions of cardiology
4
Chapter I
Basic notions of cardiology
Introduction
The human heart located in the mediastinum, is the central element of the cardiovascular system. It is protected by the bony structures of the sternum anteriorly, the spinal column posteriorly and rib cage, is a muscle that works continuously, it can be considered as a pump that pumps blood throughout the body by means of a coordinated contraction. The contraction is generated by an electrical signal activation, which is spread by a wave of bioelectricity that propagates in a coordinated manner throughout the heart.
Under normal conditions, the sinoatrial node initiates an electrical impulse that propagates through the atria to the atrioventricular node, where a delay permits ventricular filling before the electrical impulse proceeds through the specialized His-Purkinje conduction system that spreads the electrical signal throughout the ventricles. This electrical impulse propagates through the heart and elevates the voltage at each cell, producing an action potential, during which a surge in intracellular calcium initiates the mechanical contraction. The normal rhythm is altered when one or more spiral waves of electrical activity appear. These waves are life-threatening because they behave as high-frequency sources and underlie complex cardiac electrical dynamics such as tachycardia and fibrillation [5]. We present in the next section the general functioning of the cardiovascular system and the basic notions of cardiology.
I Anatomy and physiology of the heart
I.1 Location of the Heart
In the cardiovascular system the human heart is the most important element, which
is named a muscle infarction. It is the organ that supplies blood and oxygen to all parts of the body. It is located in the chest between the lungs behind, the sternum and above the diaphragm. It is surrounded by the pericardium. Its size is about that of a fist, and its weight is about 250-300 g. Its center is located about 1.5 cm to the left of the midsagittal plane. Located above the heart are the great vessels: the superior and inferior vena cava, the pulmonary artery and vein, as well as the aorta. The aortic arch lies behind the heart.
Chapter I Basic notions of cardiology
5
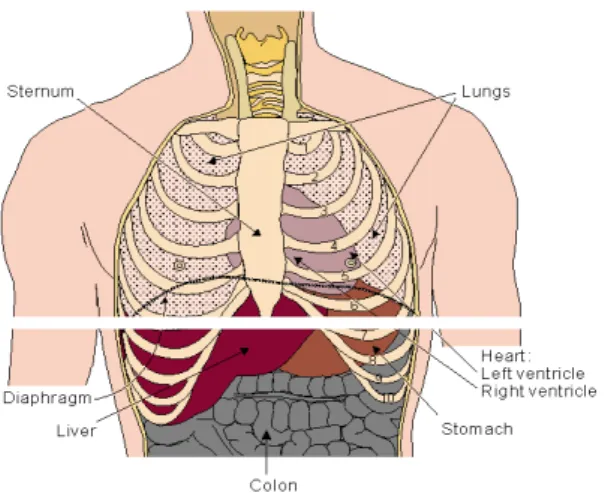
The esophagus and the spine lie further behind the heart. An overall view is given in Figure 1.1 [6].
Figure 1.1 Location of the heart in the thorax. It is bounded by the diaphragm, lungs,
esophagus, descending aorta, and sternum.
I.2 Anatomy of the Heart
I.2.1 The heart's chambers
The walls of the heart are composed of cardiac muscle, called myocardium. It also has striations similar to skeletal muscle. It consists of four chambers that work in pairs: the right atrium, the right ventricle, the left atrium, and the left ventricle. The right ventricle is the lower right chamber of the heart. During the normal cardiac cycle, the right ventricle receives deoxygenated blood as the right atrium contracts. During this process the pulmonary valve is closed, allowing the right ventricle to fill. Once both ventricles are full, they contract. As the right ventricle contracts, the tricuspid valve closes and the pulmonary valve opens. The closure of the tricuspid valve prevents blood from returning to the right atrium, and the opening of the pulmonary valve allows the blood to flow into the pulmonary artery toward the lungs for oxygenation of the blood. The right and left ventricles contract simultaneously; however, because the right ventricle is thinner than the left, it produces a lower pressure than the left when contracting. This lower pressure is sufficient to pump the deoxygenated blood the short distance to the lungs. Left ventricle is the lower left chamber of the heart. During the normal cardiac cycle, the left ventricle receives oxygenated blood through the mitral valve from the left atrium as it contracts. At the same time, the aortic valve leading to the aorta is closed, allowing the ventricle to fill with blood. Once both ventricles are full, they contract. As the left ventricle contracts, the mitral valve closes and the aortic valve opens. The closure of the mitral valve prevents
Chapter I Basic notions of cardiology
6
blood from returning to the left atrium, and the opening of the aortic valve allows the blood to flow into the aorta and from there throughout the body. The left and right ventricles contract simultaneously; however, because the left ventricle is thicker than the right, it produces a higher pressure than the right when contracting. This higher pressure is necessary to pump the oxygenated blood throughout the body. Right atrium is the upper right chamber of the heart. During the normal cardiac cycle, the right atrium receives deoxygenated blood from the body (blood from the head and upper body arrives through the superior vena cava, while blood from the legs and lower torso arrives through the inferior vena cava). Once both atria are full, they contract, and the deoxygenated blood from the right atrium flows into the right ventricle through the open tricuspid valve. Left atrium is the upper left chamber of the heart. During the normal cardiac cycle, the left atrium receives oxygenated blood from the lungs through the pulmonary veins. Once both atria are full, they contract, and the oxygenated blood from the left atrium flows into the left ventricle through the open mitral valve [1].Figure 1.2 shows the heart's chambers.
Figure 1.2 the heart's chambers.
I.2.2 The heart's valves
A group of four valves controls the flow of blood within the heart. These valves prevent blood moving in the wrong direction through the heart. The valves are located between each atrium and ventricle and in the two arteries that empty blood from the ventricle [4].
Aortic Valve: also called a semi-lunar valve separates the left ventricle from the aorta. As the ventricles contract, it opens to allow the oxygenated blood collected in the left
Chapter I Basic notions of cardiology
7
ventricle to flow throughout the body. It closes as the ventricles relax, preventing blood from returning to the heart. Valves on the heart’s left side need to withstand much higher pressures than those on the right side. Sometimes they can wear out and leak or become thick and stiff.
Mitral Valve: also called Bicuspid separates the left atrium from the left ventricle. It opens to allow the oxygenated blood collected in the left atrium to flow into the left ventricle. It closes as the left ventricle contracts, preventing blood from flowing backwards to the left atrium and thereby forcing it to exit through the aortic valve into the aorta. The mitral valve has tiny cords attached to the walls of the ventricles. This helps support the valve’s small flaps or leaflets.
Pulmonary Valve: separates the right ventricle from the pulmonary artery. As the ventricles contract, it opens to allow the deoxygenated blood collected in the right ventricle to flow to the lungs. It closes as the ventricles relax, preventing blood from returning to the heart.
Tricuspid Valve: Located between the right atrium and the right ventricle, the tricuspid valve is the first valve that blood encounters as it enters the heart. When open, it allows the deoxygenated blood collected in the right atrium to flow into the right ventricle. It closes as the right ventricle contracts, preventing blood from flowing backwards to the right atrium, thereby forcing it to exit through the pulmonary valve into the pulmonary artery. Figure 1.3 shows the heart's valves.
Figure 1.3 The heart's valves.
I.3The blood circulation System
The major vessels of the heart are the large arteries and veins that attach to the atria, ventricles and transport blood to and from the systemic circulatory system and pulmonary
Chapter I Basic notions of cardiology
8
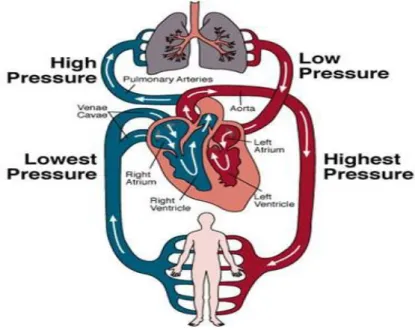
circulation system. Blood is delivered to the right atrium from the systemic circulatory system by two veins. The superior vena cava transport oxygen-depleted blood from the upper extremities, heard and neck. The inferior vena cava transport oxygen-depleted blood from the thorax, abdomen and lower extremities. Blood exits the right ventricles through the pulmonary trunk artery. Approximately two inches superior to the base of the heart, this vessel branches into the left and right pulmonary arteries, which transport blood into the lungs. The left pulmonary veins and right pulmonary veins return oxygen-ated blood from the lungs to the left atrium. Blood passes from the left atrium into the left ventricle and then is pumped into the systemic circulatory system through a large elastic artery called the aorta [4]. An overall view of the blood circulation system is given in Figure 1.4, in which the red circulatory system indicates the flow of oxygenated blood coming from the lungs, flowing into the left atrium of the heart, and pumped out to the body by the left ventricle. The blue circulatory system indicates the flow of blood low in oxygen coming from the body, returning to the right atrium of the heart and pumped out to the lungs by the right ventricle.
Figure 1.4 The Circulation System.
I.4 The cardiac cycle
The cardiac cycle is a period from the beginning of one heart beat to the beginning of the next one .A single cycle of cardiac activity can be divided into two basic phases
Chapter I Basic notions of cardiology
9
Figure 1.5 The cardiac cycle.
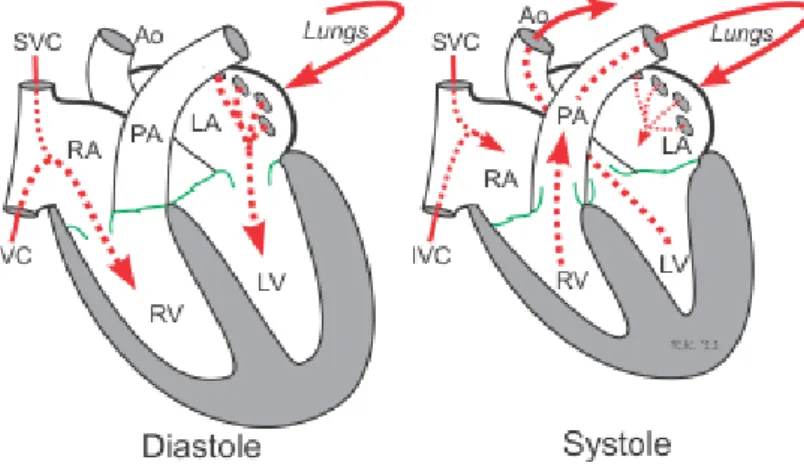
Diastole represents the period of time when the ventricles are relaxed (not contracting).Throughout most of this period, blood is passively flowing from the left atrium (LA) and right atrium (RA) into the left ventricle (LV) and right ventricle (RV), respectively. The blood flows through atrioventricular valves (mitral and tricuspid) that separate the atria from the ventricles. The RA receives venous blood from the body through the superior vena cava (SVC) and inferior vena cava (IVC). The LA receives oxygenated blood from lungs through four pulmonary veins that enter the LA. At the end of diastole, both atria contract, this propels an additional amount of blood into the ventricles.
Systole represents the time during which the left and right ventricles contract and eject blood into the aorta and pulmonary artery, respectively. During systole, the aortic and pulmonic valves open to permit ejection into the aorta and pulmonary artery. The atrioventricular valves are closed during systole, therefore no blood is entering the ventricles; however, blood continues to enter the atria though the vena cavae and pulmonary veins [7].
The duration of the cardiac cycle is inversely proportional to the heart rate. The cardiac cycle duration increases with a decrease in the heart rate and on the other hand it shortens with increasing heart rate. At a normal heart rate of 75 beats per minute, one cardiac cycle lasts 0.8 second. Under resting conditions, systole occupies
⅓
and diastole⅔
of the cardiac cycle duration. At an increasing heart rate (e.g. during an intensive muscle work), the duration of diastole decreases much more then the duration of systole.Chapter I Basic notions of cardiology
10
To analyze these two phases in more detail, the cardiac cycle is usually divided into seven phases [8].
I.4.1 Atrial Contraction (Phase 1)
This is the first stage of the cardiac cycle which represents electrical depolarization of the atria. Atrial depolarization then causes contraction of the atrial musculature. As the atria contract, the pressure within the atrial chambers increases, which forces more blood flow across the open atrioventricular (AV) valves, leading to a rapid flow of blood into the ventricles. Blood does not flow back into the vena cava because of inertial effects of the venous return and because the wave of contraction through the atria moves toward the AV valve, as shown in Figure 1.6 [1]. Atrial contraction normally accounts for about 10% of left ventricular filling when a person is at rest because most of ventricular filling occurs prior to atrial contraction as blood passively flows from the pulmonary veins, into the left atrium, then into the left ventricle through the open mitral valve. At high heart rates, however, the atrial contraction may account for up to 40% of ventricular filling. The atrial contribution to ventricular filling varies inversely with duration of ventricular diastole and directly with atrial contractility [7].
Figure 1.6 Atrial contraction. I.4.2 Isovolumetric Contraction (Phase 2)
All Valves Closed
This phase of the cardiac cycle begins with the triggering of excitation-contraction coupling, myocyte contraction and a rapid increase in interventricular pressure. Early in this phase, the rate of pressure development becomes maximal. This is referred to as the maximal variation of the amount quantity of the movement (dP/dt) [1].
Chapter I Basic notions of cardiology
11
During the time period between the closure of the AV valves and the opening of the aortic and pulmonic valves, ventricular pressure rises rapidly without a change in ventricular volume (i.e. no ejection occurs).
Ventricular volume does not change because all valves are closed during this stage. Contraction, therefore, is said to be "isovolumic" or "isovolumetric". Individual myocyte contraction, however, is not necessarily isometric because individual myocyte are undergoing length changes. Therefore, ventricular chamber geometry changes considerably as the heart becomes more spheroid in shape; circumference increases and atrial base-to- apex length decreases as giving in Figure 1.7 [7].
Figure 1.7 Isovolumetric contraction.
I.4.3 Rapid Ejection (Phase 3)
This phase represents the initial and rapid ejection of blood into the aorta and pulmonary arteries from the left and right ventricles, respectively. Ejection begins when the intraventricular pressures exceed the pressures within the aorta and pulmonary artery, which causes the aortic and pulmonic valves to open. Blood is ejected because the total energy of the blood within the ventricle exceeds the total energy of blood within the aorta. In other words, there is an energy gradient to propel blood into the aorta and pulmonary artery from their respective ventricles. During this stage, ventricular pressure normally exceeds outflow tract pressure by a few mmHg. This pressure gradient across the valve is ordinarily low because of the relatively large valve opening (i.e., low resistance). Maximal outflow velocity is reached early in the ejection stage, and maximal (systolic) aortic and pulmonary artery pressures are achieved [1].
Left atrial pressure initially a decrease as the atrial base is pulled downward, expanding the atrial chamber. Blood continues to flow into the atria from their respective venous inflow tracts and the atrial pressures begin to rise, and continue to rise until the AV valves open at the end of phase 5 as shown the Figure 1.8 [8].
Chapter I Basic notions of cardiology
12
Figure 1.8 Rapid ejection. I.4.4 Reduced Ejection (Phase 4)
Approximately 200 ms after the beginning of ventricular contraction, ventricular repolarization occurs. Repolarization leads to a decline in ventricular active tension and therefore the rate of ejection (ventricular emptying) falls [1].
Ventricular pressure falls slightly below outflow tract pressure; however, outward flow still occurs due to kinetic (or inertial) energy of the blood. Left atrial and right atrial pressures gradually rise due to continued venous return from the lungs and from the systemic circulation, respectively as shown the Figure 1.9 [7].
Figure 1.9 Reduced ejection. I.4.5 Isovolumetric Relaxation (Phase 5)
All Valves Closed
When the intraventricular pressures fall sufficiently at the end of phase 4, the aortic and pulmonic valves abruptly close (aortic proceeds pulmonic). Valve closure is associated with a small backflow of blood into the ventricles and a characteristic notch the aortic and pulmonary artery pressure tracings [1].
After valve closure, the aortic and pulmonary artery pressures raise slightly following by a slow decline in pressure.
Chapter I Basic notions of cardiology
13
The rate of pressure decline in the ventricles is determined by the rate of relaxation of the muscle fibers, which is termed lusitropy. This relaxation is regulated largely by the sarcoplasmic reticulums that are responsible for rapidly re-sequestering calcium following contraction as given in the Figure 1.10 [7].
Figure 1.10 Isovolumentric relaxation. I.4.6 Rapid Filling (Phase 6)
AV Valves Open
As the ventricles continue to relax at the end of phase 5, the intraventricular pressures will at some point fall below their respective atrial pressures. When this occurs, the AV valves rapidly open and ventricular filling begins [1]. Despite the inflow of blood from the atria, intraventricular pressure continues to briefly fall because the ventricles are still undergoing relaxation.
Once the ventricles are completely relaxed, their pressures will slowly rise as they fill with blood from the atria as given in the Figure 1.11 [7].
Chapter I Basic notions of cardiology
14 I.4.7 Reduced Filling (Phase 7)
AV Valves Open
As the ventricles continue to fill with blood and expand, they become less compliant and the intraventricular pressures rise. This reduces the pressure gradient across the AV valves so that the rate of filling falls [1].In normal resting hearts, the ventricle is about 90% filled by the end of this phase. In other words, about 90% of ventricular filling occurs before atrial contraction (phase 1) [7]. Aortic pressure and pulmonary arterial pressures continue to fall during this period as given in the Figure 1.12.
Figure 1.12 Reduced filling (diastasis).
Conclusion
The importance of the electrical activity of the heart has attracted attention of many scientists in the domain of diagnostic pathology in the myocardium due to the fact that theirs electrical activity can be the source of a wealth of valuable information on the state structure and function of the cardiovascular system, hence the need for a tool for exploring and recording the electrical activity in order to exploit it easily. Recording and representation of this electrical activity will be discussed in the next chapter.
Chapter II The Electrocardiogram
15
Chapter II
The
Electrocardiogram
Introduction
Electrocardiogram (ECG) is a fundamental part of cardiovascular assessment. It is an essential tool for investigating cardiac arrhythmias and is also useful in diagnosing cardiac disorders such as myocardial infarction. We present in this chapter the principle of the electrocardiogram (ECG) and its properties.
II.1 Definition
The electrocardiogram (ECG) deals with the electrical activity of the heart, which composed of series of waves ordered into some repeatable pattern. The ECG signals are obtained by connecting especially designed electrodes to the surface of the body.The height of the tracing represents millivolts while the width of the ECG represents a time interval.
The acquisition of the electrocardiogram generally consists of set of equipments which are the following:
A set of electrodes designed to be applied in direct contact of the patient. An amplification system of the signals coming from the electrodes. A recording device.
A system of graphic recording.
II.2 History of Electrocardiography
In 1887, the British physiologist Augustus Waller discovered it was possible to record heart activity from the skin’s surface [10]. He used an instrument called a capillary electro- meter to trace heart signals onto photographic plates. Then the Dutch physiologist Willem Einthoven was inspired by Waller’s experiments [11]. In 1902 he developed an instrument to record traces of the heart’s activity. His string galvanometer was critical to the manufacture of early electrocardiograph machines in 1908. Early ECG machines were cumbersome and hard to use. Einthoven’s first machine required five people to operate. The person monitored had to place each limb in a bucket of salt water, so it was impracti- cal for patient use. Improvements such as electrodes attached to the skin’s surface meant machines became smaller, portable and
Chapter II The Electrocardiogram
16
more reliable. Physiologists such as Thomas Lewis helped ECG machines gain acceptance in hospitals during the 1920 [12]. Computerised ECG machines now enable continuous heart monitoring.
II.3 Leads in ECG
In ECG recording, different electrodes detect the electrical activity of the heart and ECG recorders compare these activities. This is called “a lead”. Each lead gives a different view of the electrical activity of the heart, and so each ECG pattern will be different.
Bipolar leads use a single positive and a single negative electrode between which electrical potentials are measured. Unipolar leads have a single positive recording electrode and a combination of the other electrodes as a composite negative electrode. There are two most types of ECG recording systems; 5-leads and 12-leads [13].
In the 5-lead systems, the electrodes are properly attached with the wires labelled ‘LA’ and ‘RA’ connected to the left and right arms, and those labelled ‘LL’ and ‘RL’ to the left and right legs, respectively. They coarsely form an equilateral triangle (with the heart at the center) which is called as Einthoven's triangle. Lead I: records potentials between the left and right arm, Lead II: between the right arm and left leg, and Lead III: those between the left arm and left leg. AVL points to the left arm.AVR points to the right arm AVF points to the feet (The capital A stands for "augmented" and V for "voltage"), as shown in Figure 2.1
Chapter II The Electrocardiogram
17
In 12-lead ECG system is the frequently used clinical ECG system and it covers the 5-lead system. It consists of 12 5-leads which are called I, II, III, aVR, aVL, aVF, V1, V2, V3, V4, V5, V6. Particularly, I, II, III are three bipolar leads (Einthoven leads). Three unipolar leads aVR, aVL, aVF are called Goldberger leads. Einthoven leads and Goldberger leads are positioned in the frontal plane relative to the heart as shown in Figure 2.2. Using the axial reference and these six leads (I, II, III, aVR, aVL, aVF), defining the direction of an electrical vector at a given time could be simple. Additionally, Wilson leads which are denoted by V1 - V6 are unipolar chest leads and they are placed on the left side of the thorax in a nearly horizontal plane [12], these are shown in Figure 2.3 where V1: 4th intercostal space, right sternal edge. V2: 4th intercostal space, left sternal edge. V3: between the 2nd and 4th electrodes. V4: 5th intercostal space in the midclavicular line. V5: on 5th rib, anterior axillary line. V6: in the midaxillary line.
Figure 2.2 Einthoven leads and Goldberger leads position.
Chapter II The Electrocardiogram
18
II.4 Origin of electrical current in the heart
II.4.1 Flow of Electrical Current
As reported in the first chapter that the heart is located in the middle of the chest to the left of the mediastinum and the sinoatrial (SA) node is located in the top of the right atrium, the atrioventricular (AV) node is located in the bottom of the atrium, and the bundle branches conduct through the septum and ventricles. Because of this normal flow, the direction of the electrical flow (vector) is mainly downward, from right to left as shown in Figure 2.4 [14].
Figure 2.4 Flow of electrical current. II.4.2 Impulse origin and atrial depolarization
When the SA node, a pacemaker cell, fires of an impulse, the impulse travels down and toward the right and left atria. The direction -or vector - of this flow is shown in Figure 2.5.The electrical flow is translated to the ECG as the P waveform is relatively small, normally between 1.5 and 2.5 mm in width and less than 3 mm in height [14].
Chapter II The Electrocardiogram
19 II.4.3 Septal depolarization
The electrical flow stops briefly at the AV node, and then travels quickly down the common bundle (Bundle of His) and through the right and left bundle branches to the interventricular septum.The depolarization of the septum causes a small negative deflection a q wave in some leads [14].
Figure 2.6 Septal depolarization. II.4.4 Apical and early ventricular depolarization
After depolarizing the septum, the impulse moves downward and to the left. These results in a large waveform called R wave [14].
Figure 2.7 Apical and early ventricular depolarization. II.4.5 Late ventricular depolarization
The final stage of depolarization takes place in the furthest stretches of the ventricle. The electrical stimulus moves upward, resulting in either a taller R wave or a smaller S wave [14].
Chapter II The Electrocardiogram
20
Figure 2.8 Late ventricular depolarization. II.4.6 Ventricular repolarization
Finally, the electrical stimulus is completed, ending depolarization. The ions in the cells move back into their normal resting positions, from top to bottom, causing the T wave [14].
Figure 2.9 Ventricular repolarization.
II.4.7 The whole cardiac cycle
The whole results of the phases in the cardiac cycle are: 1. Atrial depolarization (P wave).
2. Septal depolarization (Q wave). 3. Early ventricular depolarization (R). 4. Late ventricular depolarization (S wave). 5. Ventricular repolarization (T wave).
Chapter II The Electrocardiogram
21
Figure 2.10 The whole cardiac cycle.
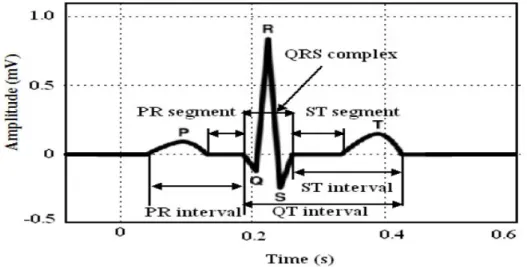
II.5 The ECG components
The ECG signal consists of waves, intervals and segments. The three basic waves are P, QRS and T. These waves correspond to the far field induced by specific electrical on the cardiac surface. In a representation of normal ECG waveform generally are:
•A wave is every deflection on the ECG. • A segment is the region between two waves.
• An interval includes one segment and one or more waves.
Figure 2.11 Schematic representation of normal ECG waveform.
The polarity and the shape of the ECG constituent waves are different depending on lead that is used. Usually ECG signals are contaminated by various kinds of noise. Various types of noise contaminated the ECG are described in the next passage.
Chapter II The Electrocardiogram
22 I.5.1 The Isoelectric Line (baseline)
There is a part of the normal ECG rhythm that is electrically neutral there is nothing electrically happening in the heart during that period. This is called the “isoelectric” line. This is a straight line passing from the end of the T wave and the beginning of the next P wave this is shown in Figure 2.12.
Figure 2.12 Baseline or Isoelectric Line. II.5.2 The P wave
The P wave on the ECG signal , marks thedepolarization and contraction of the right and left atria , the amplitude level of this voltage signal wave is low (approximately 1 mV ) [15].
Figure 2.13 P wave.
Chapter II The Electrocardiogram
23 II.5.3 The PR segment
The PR segment is the line between the end of the P wave and the beginning of the QRS complex. The PR segment signifies the time taken to conduct through the slow AV junction. This delay allows for atrial kick [15].
Figure 2.14 The PR segment II.5.4 The PR interval
The PR interval is measured from the start of the P wave to the start of the QRS complex. While it might appear obvious that this is indeed a PQ interval, a Q wave is not always present on an ECG tracing. For consistency, the term is PR interval has been adopted whether a Q wave exists or not [15].
Figure 2.15 The PR Interval. PR
Chapter II The Electrocardiogram
24 II. 5.5 The QRS complex
The QRS complex is the largest voltage deflection of approximately 10–20 mV but may vary in size depending on age, and gender. The voltage amplitude of QRS complex may also give information about the cardiac disease [13]. Duration of the QRS complex indicates the time for the ventricles to depolarize and may give information about conduction problems in the ventricles such as bundle branch block. The normal depolarization of the ventricles is illustrated in Figure 2.16.
Figure 2.16 The QRS complex.
Three distinct waveforms are often present in a normal QRS complex representing ventricular depolarization. Depolarization of the ventricular septum begins first from left part of the heart to the right. This early depolarization causes a small downward deflection called a Q wave. A Q wave is the first negative deflection of the QRS complex that is not preceded by a R wave. A normal Q wave is narrow and small in amplitude.
Following the depolarization of the interventricular septum, an R wave is the first positive deflection of the QRS complex., an S wave is the first wave after the R wave that dips below the baseline (isoelectric line) [15]. Various QRS Complex morphologies are represented in Figure 2.17.
.
Chapter II The Electrocardiogram
25
Figure 2.17 Various QRS complex Morphologies
As a convention all these different morphologies are defined as QRS complexes as shown in the figure2.17 [15] the classification of each one are:
QRS-1 demonstrates the labelling convention for subsequent positive deflections above the baseline after the R wave. This second deflection is labelled R’. Note that a third upright deflection would be labelled R’’ (R double prime).
QRS complex -2-4 are all normal QRS complexes of different shapes. QRS complex -3 is a biphasic QRS complex would be labelled RS. The QRS complex -5 is a QS complex.
II.5.6 R-R interval
The RR interval is the time between QRS complexes as shows Figure 2.18. The instantaneous heart rate can be calculated from the time between any two QRS complexes. The drawback of this method is that the calculated heart rate can be quite a bit different from the measured pulse even in a normal person due to variations in the heart rate associated with respiration (the sinus arrhythmia).
II.5.7 The T wave
A T wave usually follows every QRS complex. The T wave corresponds to the repolarisation of the ventricle. While ventricular depolarization occurs rapidly producing a tall QRS complex, ventricular repolarisation is spread over a longer interval, resulting in a shorter and broader T wave as shows Figure 2.19. Abnormally shaped T waves can indicate acute cardiac ischemia, electrolyte imbalances, and cardiac disease related medication [15].
Chapter II The Electrocardiogram
26
Figure 2.18 R-R interval
Figure 2.19 T wave II.5.8 The U wave
Occasionally, another wave, the U wave, is recorded immediately following the T wave and before the P wave. The U wave has yet to be fully explained but current studies suggest it represents a final stage of repolarisation of certain ventricular cells in the middle of the myocardium. The U wave will most often be oriented in the same direction as the T wave [15]
Chapter II The Electrocardiogram
27
II.6 Noises in ECG Signal
Generally the recorded ECG signal suffer from noises originating from various sources
and artifacts that can be within the frequency band of ECG signal, which may change the characteristics of ECG signal. Hence it is difficult to extract useful information of the signal. The corruption of ECG signal is due to following major noises.
II.6.1 Power line interferences
It is produced due to environment of experiment where it is surrounded by electromagnetic waves. Its frequency range is 50-60Hz with some random initial phase.A 60 Hz notch filter can be used remove the power line interferences [16].
II.6.2 Baseline drift
Baseline drift may be caused in chest-lead ECG signals by coughing or breathing with large movement of the chest, or when an arm or leg is moved in the case of limb-lead ECG acquisition [16]. Base-line drift can sometimes caused by variations in temperature and bias in the instrumentation and amplifiers. Its frequency range generally 0.5Hz. To remove baseline drift a high pass filter with cut-off frequency 0.5Hz is used [16].
II.6.3 Movement artifacts
Motion artifacts are transient baseline change due to electrode skin impedance with electrode motion. It can generate larger amplitude signal in ECG waveform [10]. The peak amplitude of this artifact is 500 percent of Peak to Peak ECG amplitude and its duration is about 100–500 ms [12]. An adaptive filter can be used to remove the interference of motion artifacts.
II.6.4 Muscle contraction (EMG)
The EMG is caused by muscular contraction, which generates microvolt-range electrical signal. Such physiological interference may be minimized by strict instructions and self-control. EMG noise is assumed to be zero mean Gaussian noise.
II.7 Steps in ECG Analysis
The major steps in the analysis of the ECG signals are:
Noise elimination from ECG using noise filter technique. Cardiac cycle detection by detecting QRS complex.
Detection of significant characteristic points in ECG signal. Formulation of characteristic feature set.
Chapter II The Electrocardiogram
28
Conclusion
In classical clinical routine faced a problem in diagnostic of the ECG signal, we mean the QRS complex waves detection is done in manual fashion. In general, this is acceptable when the length of the ECG signal is small witch is not the case in the most of the situation .In order to overcome this problem Pan and Tompkins propose a solution to extract automatically the QRS complex from the ECG signal . The different steps of this algorithm will be explained in the next chapter.
Chapter III Algorithm of Detection
29
Chapter III
Algorithm of Detection
Introduction
The detection of QRS complex is the first step towards automated computer-based ECG signal analysis. All the required features from ECG are extracted from the filtered ECG signal. The basic and essential component for feature extraction is the detection of the QRS complex i.e. locating the R peak for each beat of the signal. Once the R peak is determined, all other characteristic peaks on the ECG signal are determined with reference to the R peak. Thus an accurate detection of the QRS complex of the ECG signal is a crucial task in ECG analysis [18]. In the literature several techniques are reported to improve the accuracy of QRS complex detection from the ECG signal because the exact detection of QRS complex is difficult, as the ECG signal is contaminated with different types of noise like electrode motion, power-line interferences, baseline wander, muscles noise etc. [19]. Pan and Tompkins pioneered a technique where, the detection of QRS complex was achieved by linear filtering, non-linear transformation and decision rule algorithm [20]. In another method the QRS complex of the ECG signal was found out using multi rate signal processing and filter banks [21]. The QRS complex can be found after finding the R-peak by differential operation in ECG signal. The first differentiation of ECG signal and its Hilbert transform is used to find the location of R-peak in the ECG signal [22].
III.1 Structure of the QRS detection algorithm
The majority of the proposed algorithms to process the problem of the automatic QRS detection in the ECG signals, they share the same common structure. We can say that they are based on two stage steps, the first phase is the preprocessing stage of the ECG signal and the second phase is Decision stage. The common scheme is shown in the following Figure.
Chapter III Algorithm of Detection
30
Figure 3.1 The common structure of the QRS detectors.
The preprocessing stage generally for the ECG signal is to automate the analysis of noises present in signal are needed to be considered and eliminated for the accurate signal analysis and diagnosis. Electrocardiogram (ECG) can be corrupted by various types of noise such as power line interference, electrode contact noise, motion artifacts, EMG noise, instrumentation noise, wandering baseline as described in chapter II. The ECG signal embedded in these noises is very hard to correctly interpret for diagnosis. To obtain a distortion less, accurate and error free signals several filters technique are using.
Decision stage is the final step in the QRS detection algorithm, different methods are used to extract correctly the location of the R peaks in the ECG signal. The majority of algorithms use the adaptive thresholding [23].
III.2 The ECG signal filtering
The filtering techniques are primarily used for preprocessing of the ECG signal and have been implemented in a wide variety of systems for ECG analysis. To reduce and remove the noises, digital software filters are widely used in biomedical signal processing [24].
Analog filters can deal with the noises, but they introduce nonlinear phase shifts and depend on the instrumentation such as resistance, temperature and design. Analogue filter characteristics are typically fixed by the circuit design and component values. If we wish to change the filter characteristics we would have to make major modifications to the circuit. In comparison digital filters characteristics can be changed very easily by simply changing the algorithm embedded into the processor. Digital filters are more precise and less error with more advantages over analog filters. Filters have two uses: signal separation and signal restoration. Signal separation is needed when a signal has been contaminated with interference, noise, or other signals. For example, imagine a device for measuring the electrical activity of a baby's heart (EKG) while still in the womb. The raw signal will likely be corrupted by the breathing and heartbeat of the mother. A filter might be used to separate these signals so that they can be individually analysed [17].
QRS location
Preprocessing stage Decision stage
Chapter III Algorithm of Detection
31
Digital filters are classified either as Finite Impulse Response (FIR) filters or Infinite Impulse response (IIR) filters, depending on the form of unit pulse response of the system. In the FIR system, the impulse response is of finite duration whereas in the IIR system, the impulse response is of infinite duration. IIR filters are usually implemented using structures having feedback, that’s why the present response of IIR filter is a function of present and past values of the excitation as well as the past value of the response. But the response of the FIR filter usually implemented using structures having no feedback so the response depends only on the present and past values of the input only [16].
III.2.1 Design Techniques of FIR and IIR Filters
The FIR filter is implemented in a non-recursive way which guarantees a stable filter. FIR filter design mainly consists of two parts:
Approximation part Realization part
In the approximation stage, the specifications of the filters are taken and a transfer function is generated. In approximation, first an ideal frequency response is taken of length N (N represents the order of the FIR filter). Then a method or algorithm is selected for the implementation of the filter transfer function.
In the realization part, a structure is chosen to implement the transfer function i.e. in the form of circuit diagram or a program. There are essentially three well-known methods for FIR filter design namely:
The window method
The frequency sampling technique Fourier series method
The equations below show the input output relation of the filter and transfer function of the FIR filter:
Chapter III Algorithm of Detection
32
The first filter designed for the task of removing the noise from original signal is an FIR filter. A filter lends itself quite well to this task considering that we are interested in removing a very specific, narrow band of frequencies [25].
Figure 3.2 FIR Filter Structure
The center frequency of the filter, F0 was chosen to be at exactly 60Hz and the bandwidth
ΔF=4Hz.
Figure 3.3 IIR Filter Structure
An IIR filter offers the very best of what FIR filters have to offer; very high attenuation with a low order. The filter presented is of order two and has only one coefficient. These properties lend themselves to being a light computational load [26].
Z-1 Z-1 Z-1 ∑ ∑ ∑ IN Out bn b2 b1 b0 ∑ ∑ Z-1 Z-1 IN OUT