HAL Id: hal-01109533
https://hal-mines-paristech.archives-ouvertes.fr/hal-01109533
Submitted on 26 Jan 2015HAL is a multi-disciplinary open access archive for the deposit and dissemination of sci-entific research documents, whether they are pub-lished or not. The documents may come from teaching and research institutions in France or abroad, or from public or private research centers.
L’archive ouverte pluridisciplinaire HAL, est destinée au dépôt et à la diffusion de documents scientifiques de niveau recherche, publiés ou non, émanant des établissements d’enseignement et de recherche français ou étrangers, des laboratoires publics ou privés.
and buckling loading
Pongsak Nimdum, Jacques Renard
To cite this version:
Pongsak Nimdum, Jacques Renard. Use of acoustic emission to discriminate damage modes in carbon fibre reinforced epoxy laminate during tensile and buckling loading. ECCM 15 - 15th European Conference on Composite Materials, Jun 2012, Venise, Italy. 8 p. �hal-01109533�
USE OF ACOUSTIC EMISSION TO DISCRIMINATE DAMAGE
MODES IN CARBON FIBRE REINFORCED EPOXY LAMINATE
DURING TENSILE AND BUCKLING LOADING
P. Nimdum*, J. Renard
Centre des matériaux P. M. Fourt, Mines-Paris Tech, CNRS UMR 7633,BP 87, F-91003 Evry cedex *pongsak.nimdum@mines-paristech.fr
Keywords: acoustic emission, buckling loading, damage mechanisms
Abstract
The purpose of this work is to use acoustic emission signal parameters to identify and characterize the various damage mechanisms in composite and composite-antenna-structures during tensile and buckling loading. The wave form, FFT diagram, peak power, frequency centroid, peak frequency, absolute energy, average frequency, duration and amplitude were used for discriminate the acoustic emission signals, enabling a correlation with the damage mechanisms modes: fibre breakage, interfacial debonding fibre/matrix, micro and macro matrix cracking, delamination onset (microdelamination) and propagation of delamination (macrodelamination). These results open perspectives for real-time damage monitoring in complex composite material.
1 Introduction
Advanced composite materials have been incorporated in increasing amounts in lightweight design of sports utility, pressure vessel and other primary/secondary structures in aerospace industry (25% for A380) due to their excellent specific strength and stiffness in comparison to conventional materials.
In recent years, non-destructive testing (NDT) have seen developed for monitoring of damage accumulation in composite materials. Among the different techniques, acoustic emission (AE) is one of the primary technologies used for the identification of different types of failure in-service monitoring. AE is an efficient method for real time monitoring, damage growth in both structural components and laboratory specimens.
Damage mechanisms up to failure are rather complex in composite laminates. One reason is that several damages phenomena (matrix cracking, delamination, fibre breakage, fibre/matrix debonding, fibre pull-out, etc.) are acting alone or coupled. Many researches proposed to use several parameters such as amplitudes and/or frequency to discriminate damage mechanisms. Gong et al. [1] showed that the discrimination of glass/epoxy composite by using amplitude distribution can be divided into five categories: 33 to 45 dB for matrix cracking, 46 to 58 for delamination growth, 59 to 68 dB for fibre/matrix debonding, 69 to 86 dB for fibre pull-out and 87 to 100 dB for fibre breakage. However, this classification can not validate for carbon/epoxy composite. Beside that many workers [2,3] showed clearly that the amplitude discrimination parameter of each damage types depends on a typical tests condition such as tensile and bending. The assignment by using AE amplitude makes uncertain. Therefore, new parameters were proposed. De Groot et al. [4] found that the classification in carbon/epoxy
composite material using average frequency can be divided into four types: the matrix cracking (90 - 180 kHz), the debonding of fibre/matrix (240 to 310 kHz), the fibre pull-out (180 to 240 kHz) and the fibre breakage (>300 kHz). In the similar way, Russell and Hennek [5] showed that the matrix cracking in graphite/epoxy composites generate frequency between 50 and 150 kHz. Another way of frequency analysis was proposed in previous research using FFT (Fast Fourier Transform) [6,7]. They found that peak amplitude of frequency response for matrix cracking, debonding and fibre breakage in graphite/epoxy composite are 140, 300 and 405 kHz, respectively.
However the acoustic signatures of damage events are rather scattered and depend on AE system in particularly AE sensor. Consequently, there is no universal signature for damaging events. Moreover the wing of aircraft in which the antenna system is holding on is generally subjected to bending loading. Therefore, one or several parameters identified in tensile loading are not valid for complex structure and different loads applied.
For this reason, in this study, the multivariable parameters as wave form, FFT diagram, peak power, frequency centroid, absolute energy, average frequency, peak frequency, duration, amplitude and theirs peak density will used to discriminate damage mechanisms. In order to investigate each damage mechanism and the loading type effect, the tensile tests in different stacking sequences and one stacking sequence of buckling test were performed. Finally, AE clustering will validated in composite antenna system specimen submitted to buckling loading.
2 Materials and testing methods
2.1 Materials
In this study, two types of material have been investigated: composite material, composite-antenna-structure. First, the composite material was carried out on carbon (T700)/epoxy (M21). The density of carbon fibre is 1.8 g/cm3 and that of the epoxy resin is 1.2 g/cm3. The volume fraction of carbon fibre was 58%. All of the specimens in tensile test of (0°8), (90°8),
(45°8), (0°2,±90°2)S, (90°2,0°2)S, (0°2,±20°2)S, (90°2,±45°2,0°2)S and (0°2,±45°2,90°2)S
laminated with 0.125 mm for one ply thickness were 20x250 mm2. Each of these types is expected to generate preferentially certain damage modes during applied loading: fibre breakage, debonding between fibre and matrix, matrix cracking, delamination. All of the specimens were cut from plates (300x300 mm2) using a diamond wheel saw. The specimens were used aluminium tab in order to reduce the signal from the gripe during loading. In the same manner as tensile test, the similar dimension of (0°2,±45°2,90°2)S laminate without
aluminium tab was perform in buckling test. A second material was the composite-antenna-structure. This material compose of (0°2,±45°2,90°2)S laminated and antenna system
(metamaterial) (Fig. 1(a)). The similar dimension as the tensile test was studied to subject to buckling loading.
(a) (b)
2.2 Acoustic emission (AE) system and AE parameters
Acoustic emission was continuously monitored during the tensile tests by using a MISTRAS data acquisition system of Physical Acoustics Corporation (PAC) with a 40 dB pre-amplification. Environmental noise was filtered using a threshold of 40 dB. AE measurements were achieved by using two resonant micro-80 PAC sensors which have a large range of resonance (200 kHz-1MHz), and a peak resonance about 300 kHz, coupled on the faces of the samples. The nominal distance between sensors in tensile test and buckling test for composite material were 60 mm and 100 mm for semi-structure with and without antenna system allowing the linear localisation of AE sources. The coupling between the surface of composite and ceramic sensor was not only provided a gel or silicone grease but also the sensors were held in place with a mechanical device in order to ensure applied with a constant pressure and thickness film of gel.
After the installation of the transducers, a pencil lead break procedure [8] was used to simulate AE signals in the calibration of each test. Preliminary measurements allowed us to set up the acquisition parameters for our materials: PDT (Peak Definition Time = 50 s), HDT (Hit Definition Time = 100 us), HTL (Hit Lockout Time = 200 s). We note that these parameters depend on the material properties. The velocity of wave propagation was found to be equal to 9600, 2550, 3500, 6700, 8250 and 5400 m/s for (0°8), (90°8), (45°8), (0°2,±90°2)S,
(0°2,±20°2)S, (0°2,±45°2,90°2)S , respectively.
On each signal, we recorded waveforms and parameters which were calculated from the waveforms (rise time, duration, amplitude, average frequency, energy etc...). After recording the waveforms, we used the NOESIS software to recalculate for clarify these parameters and to calculate other parameters. This software has many advantages for more accurate to discriminate AE signal.
In this study, multivariable parameters (seven parameters) both time and frequency domains were used in order to discriminate for each damage mechanism. The discrimination parameters can be divided into three groups. First, it is frequency approach which consist of average frequency (kHz), frequency centroid (kHz), peak frequency (kHz) and then, it is energy approach which consist of amplitude (dB), peak power (dB) and absolute energy (aJ, atto Joules = 10-18). Finally, it is duration time (sec).
The frequency centroid (kHz) (also known as the first moment of inertia) results from a performing a real-time FFT and carrying out the follow calculation:
(
) (
)
(
)
∑
∑
− = − = 1 0 1 0 * N n N n Magnitude Frequency Magnitude (1)In the similar way, the peak power (dB) is also calculated according to power spectrum of FFT signal. The average frequency (kHz) is the number of the AE counts divided by the duration time, while peak frequency is the frequency which is high magnitude in FFT diagram. The absolute energy (aJ, atto Joules = 10-18) is strongly related to the source energy and is defined as integral of the squared voltage signal divided by the reference resistance (10k ) over the duration of AE waveform.
2.3 Testing methods
Generally the wing of aircraft in which the antenna system is holding on is subjected to bending loading which one in tensile and another one in compression. To simplify the damage and AE analysis, in this study, two groups of materials were investigated: composite material under tensile and buckling loading and composite-antenna-systems under buckling loading.
First, the composite tensile tests were performed at room temperature using hydraulic machine with low crosshead speed (0.2 mm/min) in order to avoid the saturation of EA system. Step loading was performed by using CDD camera and two sensors Micro-80 of AE with 60 mm distance in order to monitor progressive damages accumulation (Figure 1(b)). A continuous loading was also performed to investigate the loading effect condition. Before each test, the edges of specimens were polished.
In case of bending loading case, buckling tests were performed in order to avoid parasite signals due to contact load point during three or four point bending flexural test. When specimen is subjected to longitudinal forced, it will suddenly shift to one side and buckle before attaining the admissible compressive strain (Figure 2). Besides, the rubber plate was mounted on metal plate to reduce the parasite noise due to contact load point. In the similar manner with bending loading, the buckling test occur one side of specimen in tensile and another side in compression. Buckling test in composite and composite-antenna-structures specimens were performed with cross-head speed 1 mm/min with four sensors of Micro-80. Two sensors (Ch-3 and Ch-4) mounted on rubber material nearly the end of specimen were used to detect signal due to the friction between the specimen and rubber material. While two sensors (Ch-1 and Ch2) were used to detect the AE events of damage developed.
Figure 2. Experimental setup in buckling loading 3 Experimental results and discussion
By previous study [9] showed that the mechanical behaviour of composite material obtained by tensile loading showed quasi-linear up to failure. This raison is quit difficult to understand damage mechanism when we consider only stress-strain relation. Consequently, AE response during tensile loading were analysed and we found that a good agreement between damage evolution obtained by experimental observation and AE hits accumulated on (08), (90°8),
(45°8), (0°2,90°2)S, (90°2,0°2)S, (0°2,±45°2,90°2)S and (90°2,±45°2,0°2)S laminates. Matrix
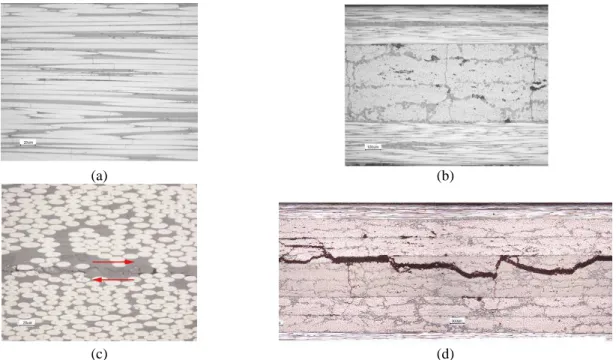
cracking, fibre breakage, fibre/matrix debonding and delamination can be found (Figure 3). The fibre breakage and the delamination occured primary in (0°8) and (0°2,±20°2)S laminates,
respectively. While, (0°2,90°2)S and (90°2,0°2)S laminates provoked the matrix cracking.
Finally, all of the damages in above can be observed in (0°2,±45°2,90°2)S and (90°2,±45°2,0°2)S
laminates. The more detail of damages and AE results in tensile loading of composite material were presented in ref. [9]. Concerning to buckling test, the similar damage can be found as the tensile test. We found that damage mechanisms were developed not only in tensile side but also in compression side (Figure 4). Moreover, other damages such as splitting also occurred during buckling loading.
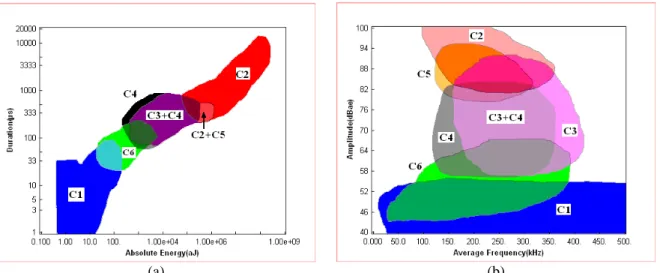
Fig. 5 shows the classification of AE parameters for each damage in composite material: fibre breakage (C1), matrix macro-cracking (C2), matrix micro-cracking (C3), micro-delamination
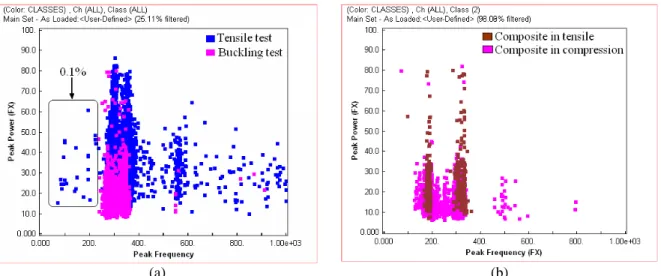
or delaminate onset (C4), macro delamination and longitudinal matrix cracking (C5) and interfacial debonding (C6). Note that the splitting in bucking test represents between C2 and C5 class. We found that similar nature of AE signals of composite material can be found during tensile and buckling loading (Figure 6(a)). Also, most of them have the peak frequency which is higher than 300 kHz (Figure 7). We found that the fibre break showed low amplitude (<60dB), while ply cracking, macro delamination and splitting showed high amplitude (>80dB). The delamination onset and the fibre/matrix debonding showed intermediate amplitude. Note that AE signals with high amplitude also represented high peak power.
In composite-antenna-structure specimen subjected in buckling test, only composite side (in tensile or compression) can be observed the damage developed (Figure 8). These damages are similar with the composite specimen. Furthermore, composite/antenna systems debonding also occurred in both case (see in Figure 8 for composite in tensile). Although AE response of absolute energy as a function of duration in composite-antenna-systems is similar with composite material under tensile and buckling loading (Figure 6(b)), but peak frequency is different. In present of antenna systems joined by adhesive layer provoked the low peak frequency (<300 kHz). We found that 25% and 50% of AE events represent in low peak frequency in tensile and compression side, respectively. Due to high attenuation in polymer material; consequently, no signal can not be detect during damage occurred in polymer. In this reason, we suppose that the low peak frequency signal provide from the debonding between composite and antenna systems. However, this hypothesis is able to verify in adhesive joint test by using special fixture so called Arcan-Mines fixture. Beside, in case of composite in tensile side, more detected signals can obtain to compare with another one. This phenomenon is corresponding to damage developed which many damage occurred when the composite specimen subjected in tensile side. While, the splitting associated with cluster of fibre break were primary in case of composite in compression side.
(a) (b)
(c) (d)
Figure 3. Damages observed under tensile test: (a) fibre breakage in (08) laminate, (b) ply cracking in (02,902)S ° ° laminate, (c) delamination in (0°2,±20°2)S laminate and (d) damages developed in (02, 452,902)S
° °
(a)
(b)
(c)
Figure 4. Damage mechanisms in buckling loading: (a) compression side and (b) tension side (c) damage in thickness direction
(a) (b)
Figure 5. Classifications of damage in composite material by using tensile loading
(a) (b)
Figure 6. AE signal response of buckling test of composite material (a) and buckling test in composite-antenna-system under tensile in composite side (b) to comparison with tensile loading
(a) (b)
Figure 7. Peak frequency under tensile and buckling loading in composite case (a) and buckling loading in composite-antenna-system (b)
(a) (b)
Figure 8. Damages developed of composite-antenna-structures under buckling loading: (a) debonding occurred in tensile side and (b) no damage occur in compression side
4 Conclusion
The results from the tensile tests generated preferentially a certain damage mode of composite material: fibre breakage (0°), matrix cracking (0°2,±90°2)S, (90°2,0°2)S, interfacial
delamination (0°2,±20°2)S, fibre/matrix debonding (0°2,±90°2)S, (90°2,0°2)S). Regarding the
buckling test of composite specimen, similar damages as tensile tests can be found. Moreover, the splitting crack propagation both in tensile and compression side of specimen was also observed. In composite-antenna-structure specimen, the similar damage can observe but only in composite part tensile or in compression side. Furthermore, composite/antenna-structures debonding occurred both case of composite-antenna-structures buckling test.
The multivariable method is available to discriminate on each damage in composite material both tensile test and bucking test. Finally, the validation of AE clustering has been carried out on composite antenna specimen under buckling loading. The fibre breakage represented low amplitude, absolute energy and duration while the matrix cracking, the macro delamination and the splitting showed high amplitude, absolute energy and duration. Damage modes of AE clustering showed a good correlation with experimental results. In addition, low peak frequency was found in buckling test of composite-antenna-systems. We suppose that this low peak frequency is corresponding to adhesive debonding of composite and antenna systems..
ACKNOWLEDGMENTS
We gratefully acknowledge the Ministry of industry for supporting the project MSIE (Smart Materials and Structures for electromagnetic applications) and Aeronautics, Space and on-boards systems competitiveness cluster ASTech, for its support all along the project.
References
[1] Gong X.L., Laksimi A., Benzeghagh M.L. Nouvelle approach de l’émission acoustique et son application à l’identification des mécanismes d’endommagement dans les matériaux composite. Revue des composites et des matériaux avancés, vol. 8(1), pp. 179-205 (1998).
[2] Eckles W., Awerbuch J. Monitoring Acoustique Emission in cross-ply graphite/epoxy laminates during fatigue loading. Journal of Reinforces plastics Composites, vol. 7, pp. 265-28 (1988).
[3] Gustafson C.G., Selden R.B. Monitoring fatigue damage in CFRP using acoustic emission and radiographic techniques in delamination and debonding of materials. W. S. Jonhson Ed. ASTM STP 876, pp. 448-464 (1985).
[4] De Groot P.J., Wijnen P.A.M., Janssen R.B.F. Real-time frequency determination of acoustic emission for different fracture mechanisms in carbon/epoxy composites.
Composites Science and Technology, vol. 55, pp. 405-412 (1995).
[5] Russell S.S., Henneke E. G. Signature analysis of acoustic emission from graphite/epoxy composites. Interim report, NASA Grant NSG 1238, Report NO. VPI-E-77-22 (1977). [6] Woo S.C., Goo N.S. Analysis of bending process for piezoelectric composite actuators
using dominant frequency bands by acoustic emission. Composites Sciences and
Technology, vol. 67, pp. 1499-1508 (2007).
[7] Bussiba A., Kupiec M., Ifergane S., Piat R., Böhlke T. Damage evolution and Fracture event sequence in various composite by acoustic emission techniques. Composites
Sciences and Technology, vol. 18, pp. 1144-1155 (2008).
[8] Nielsen A. Acoustic emission source based on pencil lead breaking. The Danish Welding
Institute Publication, vol. 15 (1980).
[9] Nimdum P., Renard J. L’émission acoustique comme contrôle de santé des structures en matériaux composites. Revue des composites et des matériaux avancés, vol. 19, pp. 283 – 317 (2009).

![[PDF] Cours programmation Excel en VBA Perfectionnement | Cours informatique](data:image/gif;base64,R0lGODlhAQABAIAAAP///wAAACH5BAEAAAAALAAAAAABAAEAAAICRAEAOw==)