HAL Id: hal-01840640
https://hal-amu.archives-ouvertes.fr/hal-01840640
Submitted on 16 Jul 2018
HAL is a multi-disciplinary open access
archive for the deposit and dissemination of
sci-entific research documents, whether they are
pub-lished or not. The documents may come from
teaching and research institutions in France or
abroad, or from public or private research centers.
L’archive ouverte pluridisciplinaire HAL, est
destinée au dépôt et à la diffusion de documents
scientifiques de niveau recherche, publiés ou non,
émanant des établissements d’enseignement et de
recherche français ou étrangers, des laboratoires
publics ou privés.
The large-scale anomalous microwave emission revisited
by WMAP
Guilaine Lagache
To cite this version:
Guilaine Lagache. The large-scale anomalous microwave emission revisited by WMAP. Astronomy
and Astrophysics - A&A, EDP Sciences, 2003, 405 (3), pp.813 - 819. �10.1051/0004-6361:20030545�.
�hal-01840640�
A&A 405, 813–819 (2003) DOI: 10.1051/0004-6361:20030545 c ESO 2003
Astronomy
&
Astrophysics
The large-scale anomalous microwave emission
revisited by
WMAP
?
G. Lagache
??IAS, Bˆat. 121, Universit´e Paris-Sud, 91435 Orsay, France Received 24 March 2003/ Accepted 8 April 2003
Abstract.We present a new study of the high latitude galactic contributions to the millimeter sky, based on an analysis of the WMAP data combined with several templates of dust emission (DIRBE/COBE and FIRAS/COBE) and gas tracers (HI and Hα). To study the IR to millimeter properties of the diffuse sky at high galactic latitude, we concentrate on the emission correlated with the HI gas. We compute the emission spectrum of the dust/free-free/synchrotron components associated with HI gas from low to large column densities. A significant residual WMAP emission over the free-free, synchrotron and the dust contributions is found from 3.2 to 9.1 mm. We show that this residual WMAP emission (normalised to 1020atoms/cm2) (1)
exhibits a constant spectrum from 3.2 to 9.1 mm and (2) significantly decreases in amplitude when NHIincreases, contrary to
the HI-normalised far-infrared emission which stays rather constant. It is thus very likely that the residual WMAP emission is not associated with the Large Grain dust component. The decrease in amplitude with increasing opacity ressembles in fact to the decrease of the transiently heated dust grain emission observed in dense interstellar clouds. This is supported by an observed decrease of the HI-normalised 60µm emission with HI column densities. Although this result should be interpreted with care due to residual zodiacal contaminations at 60µm, it suggests that the WMAP excess emission is associated with the small transiently heated dust particles. On the possible models of this so-called “anomalous microwave emission” linked to the small dust particles are the spinning dust and the excess millimeter emission of the small grains, due to the cold temperatures they can reach between two successive impacts with photons.
Key words.ISM: general – cosmology: miscellaneous – radio continuum: general
1. Introduction
At millimeter wavelengths, one of the major challenges in high sensitivity Cosmic Microwave Background (CMB) anisotropy study is to determine the fraction of the observed signal due to diffuse galactic foregrounds. Three different components have been firmly identified at high latitudes (|b| > 10◦): thermal dust emission, synchrotron and free-free. Dust emission dom-inates the far-infrared surveys. Its spatial distribution and fre-quency dependence are quite well-determined for wavelengths shorter than∼800 µm. Above ∼800 µm, present data currently do not give any strong constraints. So far, dust emission es-timates in the millimeter range are thus an extrapolation of what is known at shorter wavelengths. Synchrotron radiation dominates radio-frequency surveys, but Banday & Wolfendale (1991) and Bennett et al. (1992) showed that the spectral index steepens with frequency and exhibits spatial variations which are poorly known. Free-free emission has a well-determined spectral behavior and templates are now available thanks to the WHAM Hαsurvey of the northern sky (Reynolds et al. 1998;
? The Wilkinson Microwave Anisotropy Probe (WMAP) is the result of a partnership between Princeton University and NASA’s Goddard Space Flight Center.
?? e-mail: [email protected]
Haffner 1999) and the SHASSA Hαsurvey of the southern sky (Gaustad et al. 2001).
Cross-correlations of CMB data with far-infrared maps have revealed the existence of a microwave emission com-ponent (the so-called “anomalous microwave emission”) with spatial distribution traced by these maps. This component has a spectral index suggestive of free-free emission and so has been first interpreted as free-free emission (Kogut et al. 1996). However, Kogut (1999) showed in small parts of the sky that were covered by Hα data that the microwave emission was consistently brighter than the free-free emission traced by Hα. Thus, the correlated component cannot be due to free-free emission alone. This is confirmed more recently by Banday et al. (2003) also using COBE/DMR data.
Recent works suggest that this anomalous far-infrared cor-related component originates from spinning dust grain emis-sion (Draine & Lazarian 1998a; De Oliveira-Costa et al. 1999, 2002), tentatively detected at 5, 8 and 10 GHz by Finkbeiner et al. (2002). An alternative explanation is provided by ther-mal fluctuations in the magnetization of interstellar grains causing magnetic dipole radiation (Draine & Lazarian 1999). However, very recently, Bennett et al. (2003) using WMAP data do not find any evidence for the anomalous microwave emis-sion. Their foreground component model comprises only free-free, synchrotron and thermal dust emission, and the observed
814 G. Lagache: The “anomalous” microwave emission revisiting by WMAP galactic emission matches the model to<1%. Note that in their
global analysis, they are dominated by the brightest parts of the sky i.e. the galactic plane and the high latitude dense interstellar clouds. Thus, results may not apply to the most diffuse regions. We present in this paper a new study of the galactic con-tributions to the millimeter sky, based on an analysis of the
WMAP data combined with several templates of dust
emis-sion (DIRBE/COBE and FIRAS/COBE) and gas tracers (HI and Hα). We focus only on the high latitude regions where the results are easier to interpret in term of physical prop-erties of dust and where CMB analysis are performed. The paper is organised as follows. We first present the data we use together with their preparation (Sect. 2). We then derive the spectrum (from 100 µm to 10 mm) of the HI-correlated component (Sect. 3.1) and show that there exists a resid-ual microwave emission (over free-free, synchrotron and far-infrared dust emission) whose HI-normalised amplitude de-creases when the HI column density inde-creases but without any significant spectral variations (Sect. 3.2). We then discuss the results in Sect. 4.
2. Data-sets used and their preparation
2.1. COBE data
The COBE satellite was developed by NASA’s Goddard Space Flight Center to measure the diffuse infrared and microwave radiation from the early universe to the limits set by our astro-physical environment. It was launched November 18, 1989 and carried three instruments:
– a Far Infrared Absolute Spectrophotometer (FIRAS) to
compare the spectrum of the cosmic microwave back-ground radiation with a precise blackbody (at each sky po-sition, with an angular resolution of 7◦, we have one spec-trum from 1 to 97 cm−1);
– a Differential Microwave Radiometer (DMR) to map the
cosmic radiation (at 31, 53, 90 GHz with a 7◦beam);
– a Diffuse Infrared Background Experiment (DIRBE) to
search for the cosmic infrared background radiation (10 photometric bands from 1 to 240µm with an angular resolution of 400).
COBE data are presented in a quadrilateralized spherical
pro-jection (the so-called COBE Quadrilateralized Spherical Cube, CSC), an approximately equal-area projection in which the ce-lestial sphere is projected onto an inscribed cube. The DIRBE convention is to divide each cube face into 256× 256 pixels; thus all sky-maps have 256× 256 × 6 = 393 216 pixels. Each pixel is approximatively 0.32◦on a side. For FIRAS and DMR, each cube face is 32×32 pixels leading to a total of 6144 pixels (of∼2.6◦).
We use the so-called (i) “Sky Maps and Analyzed Science Data Sets” DMR Data (ii) “Galactic Dust Continuum Spectra and Interstellar Dust Parameters” FIRAS data, that give the residual sky spectrum after modelled emission from the CMB, zodiacal emission, and interstellar lines have been subtracted. (iii) DIRBE “Zodi-Subtracted Mission
Average (ZSMA) Maps” for which the zodiacal light intensi-ties were subtracted week by week and the residual intensity values were averaged to create Maps. All COBE data are avail-abe at http://lambda.gsfc.nasa.gov/product/cobe
2.2. Gas tracers
The HI data we used are those of the Leiden/Dwingeloo sur-vey which covers the entire sky down toδ = −30◦with a grid spacing of 300in both l and b. The 360half power beam width of the Dwingeloo 25 m telescope provides 21 cm maps at an angular resolution which closely matches that of the DIRBE maps. Details of the observations and correction procedures are given by Hartmann (1994) and by Hartmann & Burton (1997). It should be noted that in this data-set special care was taken for the removal of far sidelobes emission which makes it particu-larly suitable for high latitude studies. We derive the HI column densities using 1 K km s−1= 1.82×10¹⁸H cm−2(optically thin
emission).
Thanks to the WHAM survey of the northern sky (Reynolds et al. 1998; Haffner 1999) and the SHASSA survey of the south-ern sky (Gaustad et al. 2001), it is now possible to have a whole sky map of the Hα emission (Dickinson et al. 2003; Finkbeiner 2003). Since the HI maps cover the sky down to
δ = −30◦, the Hα emission we use is our analysis is mostly given by the WHAM survey. WHAM provides a 12 km s−1 ve-locity resolution with one-degree angular resolution down to sensitivity limits of 0.2 R (1 R= 106/4π ph cm−2s−1sr−1) in a 30 second exposure. The one-degree angular resolution nicely matches the DIRBE resolution. We use the Hα map and the conversion factors to free-free emission (using Te = 8000 K)
from Finkbeiner (2003) to derive templates of free-free emis-sion. Since we work only on high latitude regions, the Hα emis-sion has not been corrected for extinction (the dust absorption is likely to be very small, less than 5%). The free-free tem-plates are used to derive a well-understood contribution to the millimeter channels.
2.3. Synchrotron templates
Synchrotron emission arises from relativistic cosmic ray elec-trons spiralling in the galactic magnetic field. This emission dominates surveys at radio frequencies. The only all-sky map at low frequencies that probe the synchrotron emission is the 408 MHz survey of Haslam et al. (1982). For many years, this map has been used to predict the synchrotron emission in the millimeter channels, assuming a frequency dependence with a constant spectral index of about 2.75. However, Bennett et al. (2003) have shown that the synchrotron spectral index exhibit strong spatial variations and is steeper in the WMAP bands than at radio frequencies. We thus use the WMAP synchrotron maps derived by Bennett et al. (2003) using the Maximum Entropy Method as frequency dependent well-determined synchrotron templates.
2.4. WMAP data
The WMAP1 (Wilkinson Microwave Anisotropy Probe) mis-sion, designed to determine the geometry, content, and evo-lution of the universe, has successfully provided full sky maps at 23, 33, 41, 61 and 94 GHz at respectively 13.2, 39.6, 30.6, 21 and 13.20 FWHM resolution with unprecedent sensitivity. A detailed description of the delivered data-sets for the first 12 months of operation of WMAP is given in the WMAP: explanatory Supplement (editor M. Limon et al., Greenbelt, MD: NASA/GSFC). The data we use are the first-year “Smoothed I maps” which are the temperature maps at each frequency, smoothed to a common resolution of 1 degree. Data are delivered in the HEALPix2format with Nside= 256.
2.5. Data preparation
All the data have to be put in the same projection and at the same resolution. The resolution is set by the FIRAS experiment since it is the lowest resolution of our data-sets (7◦). All data but DMR and FIRAS are thus converted in the DIRBE CSC for-mat and then convolved with the FIRAS beam and degraded to the FIRAS CSC resolution (see Lagache 2003 for more details). We have removed for each data-set the cosecant law vari-ation (1) to avoid the obvious large scale correlvari-ations between all galactic components concentrated in the disc and (2) to be consistent with the WMAP data that measure only differentially on the sky and thus does not measure the largest angular scales. We restrict our analysis to|b| > 15◦and exclude the Small and Large Magellanic clouds, together with theρ-Ophiucus complex. We also remove cold molecular complexes (as the Taurus cloud), and regions where the dust is locally heated by nearby stars (like the HII regions) following Lagache et al. (1998). We stress out that this latter pixel selection, although necessary to keep in the analysis only diffuse parts of the sky, does not change the results and conclusions of the paper.
3. Analysing the data
3.1. Deriving the HI-correlated component spectrum The HI-correlated dust emission is the dominant component at high galactic latitude at infrared/far-infrared/submillimeter wavelengths (except in the very low HI column density regions where the Cosmic Infrared Background becomes an important contribution, e.g. Lagache et al. 1999). One way to study the in-frared to millimeter properties of the diffuse sky at high galactic latitude is therefore to concentrate on the emission correlated with the HI gas. We search here for the spatial/spectral vari-ations of the infrared to millimeter emission with the HI gas column densities.
To compute the emission spectrum of the component as-sociated with HI gas from low to large column densities, we use a differential method that removes, within statistical variance, any residual infrared emission that is not correlated
1 http://lambda.gsfc.nasa.gov/product/map/ 2 http://www.eso.org/science/healpix
with the HI gas such as an isotropic component. We first se-lect sky pixels according to their HI column density and sort them into sets of pixels bracketed by selected values of NHI.
Correlated HI emission spectra are then computed for each set of pixel k using the equation:
Fν(k)= < F >k− < F >0
< NHI>k− < NHI>0
(1) where< F >icorresponds to the mean emission computed for
the set of pixels i, and<NHI >ito the mean HI column density
for the same set of pixels. Note that all the data-sets used here are cosecant-law subtracted (see Sect. 2.5).
To keep high signal-to-noise ratio, only 5 sets of pixels are considered here, with increasing NHI. The first set (labeled “0”
in Eq. (1)), serves as the “reference” set and corresponds to the lowest column density regions (representing∼5% of the sky). We are thus left with 4 sets of pixels k with increasing NHI
and derive accordingly four mean spectra Fν(k). The sets of pixels are selected on the cosecant-law removed HI emission that can be negative. For reference, the total mean HI column density (i.e. non cosecant-law subtracted) for the 4 bins are 3.3, 4.1, 5.6 and 9.9 × 10²⁰at/cm2. By construction, the spectra are
normalised to 1020 at/cm2. Note that F in Eq. (1) represents
alternatively the DIRBE, FIRAS, DMR, WMAP, free-free and synchrotron data.
3.2. Results
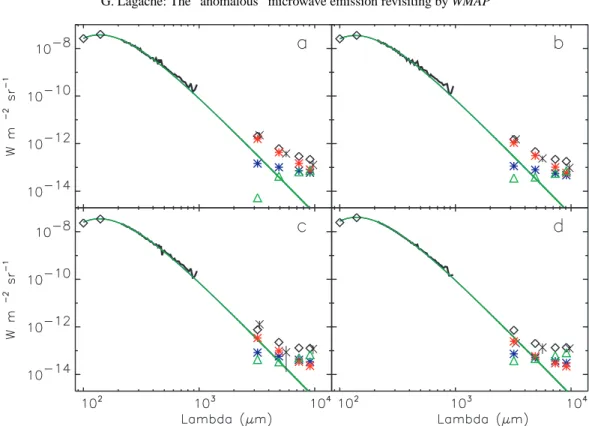
The four spectra are presented in Fig. 1 with the DIRBE data points at 100 and 140µm, the FIRAS spectra (displayed only between 210 and 1000µm), the DMR data points at 90, 53 and 31 GHz and the WMAP data points at 3.2, 4.9, 7.3 and 9.1 mm (all these data points are in black in Fig. 1). A zoom on the millimeter part of the figure is presented in Fig. 2. We fit the
DIRBE 100, 140µm and FIRAS spectra (200 < λ < 500 µm)
with a modified Planck curve with aν2emissivity law (the
re-sult of the fit is displayed in Fig. 1 and 2). We know that this fit is inconsistent with FIRAS data below∼500 GHz where an ex-cess component is detected (Reach et al. 1995; Finkbeiner et al. 1999). However, discussing this component is not the goal of this paper. We only concentrate on the millimeter part on the spectra and how it relates to the far-infrared emission. It is im-portant to note that this far-infrared dust emission has a stable spectrum, not changing with increasing opacity (Lagache et al. 1999). In this framework, theν2 modified black body is well
representative and useful for comparison between spectral far-infrared and millimeter shapes3. This far-infrared dust emission
extrapolated at millimeter wavelengths will be called the “sta-ble thermal dust component”.
First, we see in Fig. 2 that there is a strong millimeter ex-cess (with both DMR and WMAP data) with respect to the sta-ble thermal dust component (i.e. theν2 modified black body).
This excess decreases significantly (by a factor of about 5 at 3.2 mm) when the HI column density increases, although the far-infrared emission remains nearly constant (at the∼6%
3 The way we are fiting the far-infrared stable component is not
816 G. Lagache: The “anomalous” microwave emission revisiting by WMAP
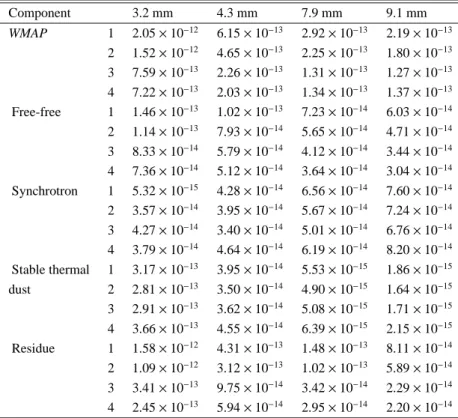
Table 1. WMAP, free-free, synchrotron and stable thermal dust component emission (in W/m2/sr, normalised to 1020at/cm2) in the four HI bins
together with the residual emission (which is equal to WMAP – Free-free – Synchrotron – Stable thermal dust). The mean total HI column densities are 3.3, 4.1, 5.6 and 9.9 × 10²⁰at/cm2for the bin 1, 2, 3 and 4 respectively.
Component 3.2 mm 4.3 mm 7.9 mm 9.1 mm WMAP 1 2.05 × 10⁻¹² 6.15 × 10⁻¹³ 2.92 × 10⁻¹³ 2.19 × 10⁻¹³ 2 1.52 × 10⁻¹² 4.65 × 10⁻¹³ 2.25 × 10⁻¹³ 1.80 × 10⁻¹³ 3 7.59 × 10⁻¹³ 2.26 × 10⁻¹³ 1.31 × 10⁻¹³ 1.27 × 10⁻¹³ 4 7.22 × 10⁻¹³ 2.03 × 10⁻¹³ 1.34 × 10⁻¹³ 1.37 × 10⁻¹³ Free-free 1 1.46 × 10⁻¹³ 1.02 × 10⁻¹³ 7.23 × 10⁻¹⁴ 6.03 × 10⁻¹⁴ 2 1.14 × 10⁻¹³ 7.93 × 10⁻¹⁴ 5.65 × 10⁻¹⁴ 4.71 × 10⁻¹⁴ 3 8.33 × 10⁻¹⁴ 5.79 × 10⁻¹⁴ 4.12 × 10⁻¹⁴ 3.44 × 10⁻¹⁴ 4 7.36 × 10⁻¹⁴ 5.12 × 10⁻¹⁴ 3.64 × 10⁻¹⁴ 3.04 × 10⁻¹⁴ Synchrotron 1 5.32 × 10⁻¹⁵ 4.28 × 10⁻¹⁴ 6.56 × 10⁻¹⁴ 7.60 × 10⁻¹⁴ 2 3.57 × 10⁻¹⁴ 3.95 × 10⁻¹⁴ 5.67 × 10⁻¹⁴ 7.24 × 10⁻¹⁴ 3 4.27 × 10⁻¹⁴ 3.40 × 10⁻¹⁴ 5.01 × 10⁻¹⁴ 6.76 × 10⁻¹⁴ 4 3.79 × 10⁻¹⁴ 4.64 × 10⁻¹⁴ 6.19 × 10⁻¹⁴ 8.20 × 10⁻¹⁴ Stable thermal 1 3.17 × 10⁻¹³ 3.95 × 10⁻¹⁴ 5.53 × 10⁻¹⁵ 1.86 × 10⁻¹⁵ dust 2 2.81 × 10⁻¹³ 3.50 × 10⁻¹⁴ 4.90 × 10⁻¹⁵ 1.64 × 10⁻¹⁵ 3 2.91 × 10⁻¹³ 3.62 × 10⁻¹⁴ 5.08 × 10⁻¹⁵ 1.71 × 10⁻¹⁵ 4 3.66 × 10⁻¹³ 4.55 × 10⁻¹⁴ 6.39 × 10⁻¹⁵ 2.15 × 10⁻¹⁵ Residue 1 1.58 × 10⁻¹² 4.31 × 10⁻¹³ 1.48 × 10⁻¹³ 8.11 × 10⁻¹⁴ 2 1.09 × 10⁻¹² 3.12 × 10⁻¹³ 1.02 × 10⁻¹³ 5.89 × 10⁻¹⁴ 3 3.41 × 10⁻¹³ 9.75 × 10⁻¹⁴ 3.42 × 10⁻¹⁴ 2.29 × 10⁻¹⁴ 4 2.45 × 10⁻¹³ 5.94 × 10⁻¹⁴ 2.95 × 10⁻¹⁴ 2.20 × 10⁻¹⁴
level). The far-infrared emission is dominated by the so-called Large Grain dust component. The millimeter excess, which changes rapidely with opacity, is thus not likely associated with this dust component.
We can go further by removing to the WMAP emission the corresponding free-free, synchrotron and stable thermal dust component contribution. The residual WMAP emission is shown in Figs. 1 and 2 (red stars) and detailed in Table 1. First, at each frequency, the residual emission exhibits a strong de-crease (by about a factor of 5) with HI column densities (from bin 1 to 4). Second, the residual emission decreases from 3.2 to 9.1 mm in each HI bin. In Fig. 3 are shown the WMAP resid-ual emissions for the 4 bins at 3.2, 4.9, 7.3 and 9.1 mm, nor-malised to the 90 GHz DMR residual emission (the 31 and 53 GHz DMR residual emissions have also been computed but are not displayed to avoid confusion. Results, although more noisy, are in very good agreement with WMAP). This figure shows that we do not detect any significant variations in the spectral shape of the residual emission4. Thus, the HI-normalised residual emission, although decreasing in ampli-tude with the HI column density, has a constant spectrum.
4. Discussion
To account for the galactic energy emitted from the mid-infrared to the submillimeter, it is necessary to have a broad dust size distribution from large grains down to large
4 This however will have to be quantified when smoothed WMAP
data with error bars will be available.
molecules. For example, D´esert et al. (1990) (see also Draine & Anderson 1985; Puget et al. 1995; Weiland et al. 1986; Siebenmorgen & Kr¨ugel 1992; Dwek et al. 1997 and more re-cently Li & Draine 2001) have proposed a consistent interpreta-tion of both the infrared emission in diffuse HI clouds and the interstellar extinction curve using a model with three compo-nents: PAHs (Policyclic Aromatic Hydrocarbons), Very Small Grains (VSGs) and Large Grains. PAHs and VSGs are small enough (a≤ 10 nm) to experience significant temperature fluc-tuations after photon absorption. They emit over a wide range of temperatures and dominate the emission forλ ≤ 60 µm. The Large Grain component is the more traditional dust component historically inferred from optical studies. These grains are in equilibrium with the incident radiation field with a tempera-ture of about 17 K in the diffuse atomic medium (Boulanger et al. 1996). The Large Grain dust component is expected, at long wavelengths, to be proportional to the total amount of solid material. The large spatial variations of the infrared spec-trum over the wavelenghts range 12–60µm have been inter-preted as changes in the abundance of small grains (Boulanger et al. 1990; Laureijs et al. 1991; Bernard et al. 1993; Abergel et al. 1994). In particular, strong deficits of the transiently heated grains emitted at 60µm are observed in dense inter-stellar clouds, these deficits being explained by grain-grain co-agulation processes (e.g. Stepnik et al. 2003).
It has been shown in Sect. 3.2 that the HI-normalised resid-ual WMAP emission (i.e. the excess above free-free and syn-chrotron contributions and the stable thermal dust component) is well traced at large scale by the HI gas and (1) exhibits a
Fig. 1. Spectrum of the HI-correlated component normalised to 1020at/cm2(with increasing N(HI) from a) to d). The black diamonds at 100
and 140µm are the DIRBE data, the black curve is the FIRAS spectrum, the black crosses with error bars are the DMR data and the black triangles at 3.2, 4.9, 7.3 and 9.1 mm are the WMAP data. Also displayed are the free-free and synchrotron contributions (blue stars and green triangles respectively). The green continous line is the result of a fit of the DIRBE 100, 140µm and FIRAS spectra (200 < λ < 500 µm) with a modified Planck curve with aν2emissivity law (the so-called stable thermal dust component). The residual WMAP emission (which is the WMAP-free-free – synchrotron – stable thermal dust component) is shown as red stars.
Fig. 2. Zoom on the millimeter part of Fig. 1. Symbols and colors are the same as in Fig. 1. Added is the residual WMAP emission after having
818 G. Lagache: The “anomalous” microwave emission revisiting by WMAP
Table 2. Excess residual emission (νRν) at 3.2, 4.9, 7.3 and 9.1 mm with 240, 140, 100 associated brightnesses (in W/m2/sr, normalised to
1020at/cm2) for the 4 HI bins. The 60µm brightness is given for |β| > 3◦and|β| > 15◦to show that the decrease may not be due to any residual zodical light emission. Also given are the 60µm brightnesses corresponding to the Very Small Grains dust component only (we have removed from the 60µm emission, I(60 µm), the best ν2modified black body fit done on the Large Grain dust component).
HI bin 1 HI bin 2 HI bin 3 HI bin 4 νRν(3.2 mm) 1.58 × 10⁻¹² 1.09 × 10⁻¹² 3.41 × 10⁻¹³ 2.45 × 10⁻¹³ νRν(4.9 mm) 4.31 × 10⁻¹³ 3.12 × 10⁻¹³ 9.75 × 10⁻¹⁴ 5.94 × 10⁻¹⁴ νRν(7.3 mm) 1.48 × 10⁻¹³ 1.02 × 10⁻¹³ 3.42 × 10⁻¹⁴ 2.95 × 10⁻¹⁴ νRν(9.1 mm) 8.11 × 10⁻¹⁴ 5.89 × 10⁻¹⁴ 2.29 × 10⁻¹⁴ 2.20 × 10⁻¹⁴ νIν(240µm) 1.81 × 10⁻⁸ 1.63 × 10⁻⁸ 1.59 × 10⁻⁸ 1.83 × 10⁻⁸ νIν(140µm) 3.90 × 10⁻⁸ 3.54 × 10⁻⁸ 3.41 × 10⁻⁸ 3.90 × 10⁻⁸ νIν(100µm) 2.61 × 10⁻⁸ 2.54 × 10⁻⁸ 2.31 × 10⁻⁸ 2.43 × 10⁻⁸ νIν(60µm) |β| > 3◦ 1.16 × 10⁻⁸ 9.37 × 10⁻⁹ 7.18 × 10⁻⁹ 6.48 × 10⁻⁹ νIνVSG(60µm) |β| > 3◦ 9.24 × 10⁻⁹ 6.98 × 10⁻⁹ 4.94 × 10⁻⁹ 4.21 × 10⁻⁹ νIν(60µm) |β| > 15◦ 9.34 × 10⁻⁹ 7.23 × 10⁻⁹ 4.57 × 10⁻⁹ 4.92 × 10⁻⁹ νIνVSG(60µm) |β| > 15◦ 7.01 × 10⁻⁹ 4.83 × 10⁻⁹ 2.32 × 10⁻⁹ 2.65 × 10⁻⁹
constant spectrum from 3.2 to 9.1 mm but (2) significantly de-creases in amplitude when NHI increases, contrary to the
far-infrared emission (associated with the so-called stable thermal dust component) which stays rather constant (cf. Table 2). It is thus very likely that the residual WMAP emission is not asso-ciated with the Large Grain dust component. The decrease in amplitude ressembles in fact to the decrease of the PAH/VSGs emission observed in dense interstellar clouds. By extrapolat-ing the PAH/VSGs behaviour from dense interstellar clouds to the diffuse medium, we may expect, when increasing the HI column density, to decrease the PAH and VSGs propor-tion and thus the HI-normalised mid-infrared emission. If this is true, then the PAH/VSGs HI-correlated emission should de-crease with HI column densities. This dede-crease, if present, is very hard to observe in the mid-infrared due to the strong resid-ual interplanetary dust emission at large scale. On the DIRBE bands, only the 60µm may be used. We have computed for the 4 HI bins the 60 µm HI-correlated emission with two differ-ent cuts in ecliptic latitude (|β| > 3◦ and|β| > 15◦). Although the absolute level of the 60 µm HI-correlated emission varies for the 2 cuts, we observe nearly the same significant decrease of the HI-normalised 60 µm emission with the HI column density (cf. Table 2). The 60 µm band may be contaminated by the Large Grain emission (30 to 40%, e.g. D´esert et al. 1990). Therefore, we remove to the 60µm emission the Large Grain contamination using the bestν2modified black body fit
(Fig. 1). The observed decrease at 60µm becomes even larger (Table 2). Although this result should be interpreted with care due to the zodiacal contamination at 60 µm, it suggests that the WMAP residual emission is associated with the small tran-siently heated particles.
The previous results suggest the anomalous microwave component is associated with the transiently heated dust par-ticles, but its exact physical mechanism remains to be found. On the possible models of the anomalous emission linked to the transiently heated particles are:
– The “spinning-dust” which is the rotational emission from
very small dust grains (Draine & Lazarian, 1998a, 1998b). However, although the spinning dut emission is in good
Fig. 3. HI-normalised residual WMAP emission at 3.2 (red), 4.9
(green), 7.3 (blue) and 9.1 (magenta) mm. All spectra are normalised on the DMR 90 GHz residual emission for the first HI bin (black points with error bars). The HI column density increases from bin 1 to 4 (from 3.3 to 9.9 × 10²⁰at/cm2). No significant variations in the
spec-tral shape of the residual emission is detected.
agreement with the WMAP emission at 7.3 and 9.1 mm, it is inconsistent with the 3.2 mm emission.
– The VSGs long-wavelength emission. VSGs are transiently
heated when an ultraviolet photon is absorbed. The mean interval between successive ultraviolet photons is longer than the cooling time and thus, between 2 impacts, the tem-perature of the particles is very low (but is at least the CMB temperature). Such particles could therefore emit signifi-cant emission in the millimeter channels.
The models have large uncertainties linked to the unknown properties of the small particles. It is therefore very difficult to predict the exact contribution of the two in the millimeter.
Acknowledgements. The author thanks the WMAP team for having
provided to the community beautiful data. Many thanks to J.-L. Puget and F. Boulanger for having carefully read this paper and for fruit-ful discussions. Thanks also to J.-P. Bernard for his help in the data manipulation.
References
Abergel, A., Boulanger, F., Mizuno, A., & Fukui, Y. 1994, ApJ, 423, L59
Banday A. J., & Wolfendale, A. W. 1991, MNRAS, 248, 705 Banday, A. J., Dickinson, C., Davies, R. D., et al. 2003, MNRAS,
submitted
Bernard, J. P., Boulanger, F., & Puget, J.-L., 1993, ApJ, 277, 609 Bennett, C. L., Smoot, G. F., & Hinshaw, G. 1992, 396, L7 Bennett, C. L., Hill, R. S., Hinshaw, G., et al. 2003, ApJ, submitted Boulanger, F., Abergel, A., Bernard, J.-P., et al. 1996, A&A, 312, 256 Boulanger, F., Falgarone, E., Puget, J.-L., & Helou, G. 1990, ApJ, 364,
136
D´esert, F.-X., Boulanger, F., & Puget, J.-L. 1990, A&A, 327, 215 De Oliveira-Costa, A., Tegmark, M., Gutierrez, C., et al. 1999, ApJ,
527, L9
De Oliveira-Costa, A., Tegmark, M., Finkbeiner, D., et al. 2002, ApJ, 567, 363
Dickinson, C., Davies, R. D., & Davis, R. J. 2003, MNRAS, 341, 369 Draine, B. T., & Anderson, N. 1985, ApJ, 292, 494
Draine, B. T., & Lazarian, A. 1998a, ApJ, 494, L19 Draine, B. T., & Lazarian, A. 1998b, ApJ, 508, 157 Draine, B. T., & Lazarian, A. 1999, ApJ, 512, 740
Dwek, E., Arendt, R. G., Fixsen, D. J., et al. 1997, ApJ, 475, 565 Finkbeiner, D., Davis, M., & Schlegel, D. J. 1999, ApJ, 524, 867 Finkbeiner, D., Schlegel, D. J, Frank, C., & Heiles, C. 2002, ApJ, 566,
898
Finkbeiner, D. 2003, ApJS, 146, 407
Gaustad, J. E., Mc Cullough, P. R., Rosing, W. R., & Buren, D. V. 2001, PASP, 113, 1326
Haffner, L. M. 1999, Ph.D. Thesis, University of Wisconsin Hartmann, D. 1994, Ph.D. Thesis, University of Leiden
Hartmann, D., & Burton, W. B. 1997, Atlas of galactic neutral hydro-gen (Cambridge, New-York: Cambridge University Press), ISBN 0521471117
Haslam, C. G. T., Salter, C. J., Stoffel, H., & Wilson, W. 1982, A&AS, 47, 1
Kogut, A., Banday, A. J., Bennett, C. L., et al. 1996, ApJ, 460, 1 Kogut, A. 1999, in Microwave Foregrounds, ed. A. De Oliveira Costa,
& M. Tegmark, ASP Conf. Ser., 181, 91
Lagache, G., Abergel, A., Boulanger, F., & Puget, J.-L. 1998, A&A, 333, 709
Lagache, G., Abergel, A., Boulanger, F., et al., 1999, A&A, 344, 322 Lagache, G. 2003, Absolute photometric calibration of Planck/HFI
high-frequency channels on the Galaxy: Application to Archeops data, A&A, submitted
Laurejis, R. J., Clark, F. O., & Prusti, T. 1991, ApJ, 372, 185 Li, A., & Draine, B. T. 2001, ApJ, 554, 778
Puget, J. L., L´eger, A., & Boulanger, F. 1985, A&A, 142, L19 Reach, W. T., Dwek, E., Fixsen, D. J., et al. 1995, ApJ, 451, 188 Reynolds, R. J., Tufte, S. L., Haffner, L. M., et al. 1998, PASA, 15, 14 Siebenmorgen, R., & Kr¨ugel, E. 1992, A&A, 259, 614
Stepnik, B., Abergel, A., Bernard, J.-P., et al. 2003, A&A, 398, 551 Weiland, J. L., Blitz, L., Dwek, E., et al. 1986, ApJ, 306, L101