Identifying Clusters and/or Small-Size Quantum Dots in Colloidal CdSe Ensembles with Optical Spectroscopy
Lijia Li,† Meng Zhang,II Nelson Rowell,‡ Theo Kreouzis,§ Hongsong Fan,† Qiyu Yu,,⊥ Wen Huang, Xiaoqin Chen,*,† Kui Yu*,†,II,⊥
†Engineering Research Center in Biomaterials, Sichuan University, Chengdu, Sichuan, 610065, People’s Republic of China
IIInstitute of Atomic and Molecular Physics, Sichuan University, Chengdu, Sichuan, 610065, People’s Republic of China
‡Metrology Research Centre, National Research Council Canada, Ottawa, Ontario K1A 0R6, Canada
§School of Physics and Astronomy, Queen Mary University of London, London, E1 4NS, United Kingdom
College of Materials Science and Engineering,
Sichuan University of Science and Engineering, Zigong 643000, China
Laboratory of Ethnopharmacology, West China School of Medicine, West China Hospital, Sichuan University, Chengdu, Sichuan, 610065, People’s Republic of China
⊥State Key Laboratory of Polymer Materials Engineering, Chengdu, Sichuan, 610065, People’s Republic of China
*Correspondence and requests for materials should be addressed to X. C. (email: [email protected]) or K. Y. (email: [email protected])
Table of Contents
Experimental Methods S2
Figure S1-1a Literature summary for optical absorption and PL spectra of typical CdSe QDs S5 Figure S1-1b Literature summary for optical absorption and PL spectra of typical CdSe clusters S6 Table S1a Literature summary for UV and PL peak positions of typical CdSe QDs S7 Table S1b Literature summary for UV and PL peak positions of typical CdSe clusters S8
Figure S1-2 Evolution of optical absorption and emission of Batches a and b samples S9 Figure S1-3 Figure S1-2 Batch a reaction but without HPPh2 S10
Figure S2-1 Additional PLE spectra of Samples 3 to 5 from Figure S1-2 Batch a S11 Table S2 Comparison of Reference 6 Cluster-437 and our Cluster-437 S12 Figure S2-2a Figure S1-2 Batch a reaction at temperatures of 205 to 225 C S13 Figure S2-2b Optical characterization spectra of Figure S2-2a Samples 1 to 3 S14
Figure S3 Additional PLE spectra of Samples 3 to 5 from Figure S1-2 Batch b S16
Figure S4-1 Optical properties of 20 sequential samples of Figure S1-2 Batch a at 185 C S17 Figure S4-2 Optical properties of 8 sequential samples of Figure S1-2 Batch a at 175 C S18 Figure S4-3 Optical properties of 14 sequential samples ofFigure S1-2 Batch a at 195 C S19 Figure S4-4 Optical properties of 13 sequential samples of Figure S1-2 Batch b at 230 C S20
Figure S5-1a Background subtraction for Figure 2 absorption spectra S21 Figure S5-1b Comparison of three background subtraction functions S22 Table S3 Detailed parameters for the deconvolution shown in Figure 5 S23 Figure S5-2 Figure 5 deconvolution returned absorbance height values for Figure 2 samples S24
EXPERIMENTAL METHODS
Chemicals. All chemicals, including cadmium oxide (CdO, 99.99%, Aldrich), oleic acid (OA, 90%, Aldrich), 1-octadecene (1-ODE, 90%, Aldrich), diphenylphosphine (HPPh2, 98%, Aldrich), selenium powder (Se, 99.5%, Alfa Aesar), toluene (Tol, 99.5%, Chendu Kelong), nitrogen gas (N2, 99.99%, Chengdu Taiyu gas Co. Ltd.) were used as received without further purification unless stated otherwise.
Synthesis and Characterization.
Preparation of Cd precursor Cd(OA)2. CdO (0.7704 g, 6.00 mmol), OA (3.728 g, 13.20
mmol), and ODE (5.000 g) were mixed in a 50 mL three-necked flask under stirring. The resulting mixture was evacuated and filled with N2. This procedure was repeated for three times at room temperature, and the mixture was then evacuated for 30 min until no bubbles were observed. The reaction mixture was then heated to 240 C under a N2 atmosphere to obtain a transparent and colorless solution. Under a N2 atmosphere, the mixture was cooled to 110 C and evacuated at this temperature for two hours. The resulting solution was further cooled to room temperature under N2 for storage and further use as the Cd precursor Cd(OA)2 stock solution. The procedure was used before.1-3
Batch a synthesis for CdSe Clusters. For a typical synthesis of Batch a products, the Cd(OA)2 stock solution (0.950 g, with 0.60 mmol Cd), and ODE (4.0382 g) were added to a 50 mL three-necked reaction flask equipped with a condenser. The mixture was degassed and filled with N2 at room temperature, the procedure of which was repeated three times before heating to 40 C under N2. HPPh2 (30 L, 0.15 mmol) was added after the addition of Se powder (0.0118 g, 0.15 mmol) at 40 C. The total weight of the reaction mixture was about 5.00 g. Similar synthetic recipes can be found elsewhere.1-3 The resulting solution was kept at 40 C for 10 min before heating to 100 C. The reaction was then conducted at a
temperature-increasing mode or at a constant temperature mode. For the former, the reaction temperature was increased further from 100 to 220 C with steps of 20 C. Each temperature was held for 10 min, and a sample was extracted before increasing the
stepwise way from 100 to 160 C in consistent with the former mode, and then heated to a specific temperature such as 185 C for sampling.
Batch b synthesis for CdSe small-size QDs. For a typical synthesis of Batch B products, the Cd(OA)2 stock solution (0.2375 g, with 0.15 mmol Cd) and ODE (4.7507 g) were added to a 50 mL three-necked reaction flask equipped with a condenser. The mixture was evacuated and filled with N2 at room temperature, and this procedure was repeated three times. Se powder (0.0118 g, 0.15 mmol) was added after the mixture was at 40C under N2. The total weight of the reaction mixture was about 5.00 g. Similar synthetic recipes (with the
discussion on the Cd to Se feed molar ratio effect) can be found elsewhere;4 relative low Cd to Se feed molar ratios were reported to favor the formation of QDs instead of clusters. The resulting mixture was kept at 40 C for 10 min and the reaction temperature was heated up to temperatures above 200 C for production.
Optical measurements. An aliquot (20 or 25 L as indicated) of the extracted as-synthesized sample was dispersed in 3.0 mL of toluene. The absorption spectra were collected using a TECHCOMP UV 2310 II and Hitachi UH4150 ultraviolet-visible (UV-Vis) spectrometer with 1 nm interval. The photoluminescence emission (PL) and
photoluminescence excitation (PLE) spectra were recorded with a 1 nm interval on an ANGDONG F380 spectrometer. It is noteworthy that PLE has been applied to analyze the electronic structures of various single-wall carbon nanotubes (SWCNTs) which co-exist in a product.5 For colloidal semiconductor binary clusters, we demonstrate that PLE is also useful.
(1) Yu, K. CdSe Magic-Sized Nuclei, Magic-Sized Nanoclusters and Regular Nanocrystals: Monomer Effects on Nucleation and Growth. Adv. Mater. 2012, 24, 1123–1132.
(2) Yu, K.; Liu, X.; Zeng, Q.; Leek, D. M.; Ouyang, J.; Whitmore, K. M.; Ripmeester, J. A.; Tao, Y.; Yang, M. Effect of Tertiary and Secondary Phosphines on Low-Temperature
Formation of Quantum Dots. Angew. Chem. Int. Ed. 2013, 52, 4823–4828.
(3) Yu, K.; Liu, X.; Qi T.; Yang, H.; Whitfield, D. M.; Chen, Q. Y.; Huisman, E. J. C.; Hu, C. General low-temperature reaction pathway from precursors to monomers before nucleation of compound semiconductor nanocrystals. Nat. Commun. 2016, 7, 12223.
Chem. C 2008, 112, 13805–13811.
(5) Nanot, S.; Hároz, E. H.; Kim, J.; Hauge, R. H.; Kono, J. Optoelectronic Properties of Single-Wall Carbon Nanotubes. Adv. Mater. 2012, 24, 4977–4994.
Figure S1-1a. Optical spectra of CdSe QDs reported are reproduced here, with a from Reference 4 Figure 1a (Angew. Chem. Int. Ed. 2005, 44, 6712 –6715), b from Reference 4 Figure 1b (Angew. Chem. Int. Ed. 2005, 44, 6712 –6715), c from Reference 7 Figure 2 (ACS Omega 2018, 3, 5399−5405),
d from Reference 7 Figure 8a (ACS Omega 2018, 3, 5399−5405), and e from Reference 12 Figure 1 (J. Phys. Chem. C 2009, 113, 19468–19474).
For sequential CdSe QD samples extracted from one reaction batch, the peak positions of their bandgap absorption and emission display continuous redshift usually. For Ref 7 (c and d), the UV peaks are at about 437 nm (blue traces), while the relatively narrow PL peaks are at about 470 nm (red traces).
Figure S1-1b. Optical spectra of CdSe clusters reported are reproduced here, with a from Reference 6 Figure 3A (Nanoscale 2018, 10, 18238–18248),
b from Reference 17 Figure 3 (Phys. Chem. Chem. Phys. 1998, 102, 85–95), c from Reference 18 Figure 1 (Adv. Mater. 2007, 19, 548-552),
d from Reference 19 Figure 8 (J. Phys. Chem. C 2009, 113, 8701–8709), e from Reference 20 Figure 4 (Chem. Mater. 2011, 23, 3114–3119),
f from Reference 21 Figure 1a (J. Am. Chem. Soc. 2012, 134, 17298−17305), and g from Reference 21 Figure 1b (J. Am. Chem. Soc. 2012, 134, 17298−17305).
The evident discontinuous feature of evolution of the peak positions has been associated to the presence of CdSe clusters instead of QDs. Clearly, for the Ref 6 two ensembles (black and red traces), clusters and QDs coexist. By a side note, the present study illustrates that for those small-size CdSe ensembles which exhibit single bandgap absorption peaks, it is possible that clusters are contained and contribute to trap emission mainly (when both bandgap and trap emission is observed).
Table S1a. Peak positions (nm) of UV and PL of the literature reported CdSe QDs.
Dimethylcadmium (Cd(Me)2); tri-n-octylphosphine selenide (TOPSe); bis(trimethylsilyl)selenium (TMS)2Se; tri-n-octylphosphine oxide (TOPO); cadmium oxide (CdO); hexylphosphonic acid (HPA); tetradecylphosphonic acid (TDPA); cadmium myristate (Cd(MA)2);
1-octadecene (ODE);
octadecyl phosphonic acid (ODPA);
oleic acid (OA);
Table S1b. Peak positions (nm) of UV and PL of the literature reported CdSe clusers.
For the reactions and medium:
Ref 17: Cd(OAc)2 + (TMS)2Se; ethanol, 3-aminopropyltriethoxy-silane (AMEO), tributylphosphine (TBP), etc
Ref 18: CdO/nonanoic acid + TOPSe; dodecylamine (DDA) + nonanoic acid + TOP; Ref 19: Cadmium stearate + TOPSe; hexadecylamine (HDA), 1-dodecanethiol (DDT); Ref 20: CdO/benzoic acid + diphenylphosphine selenide (SePPh2H) or SeTOP; toluene +
benzoic acid + DDA;
Ref 21: CdO/diisooctylphosphinic acid + dicyclohexylphosphine selenide; tetradecane; Ref 22: Cd(OA)2 + SePPh2H; ODE;
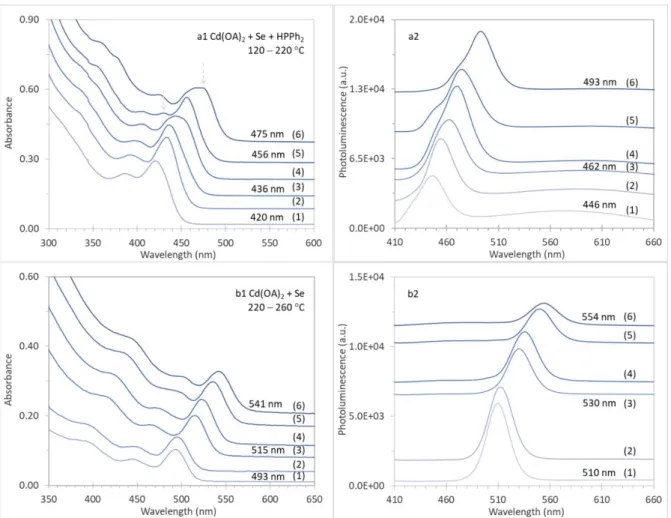
Figure S1-2. Evolution of the optical absorption (left panel) and emission (right panel, excited at 400 nm) of CdSe samples (25 μL (a) or 20 μL (b) in 3.0 mL of toluene). There were six samples extracted from each of the two reactions of Cd(OA)2 + Se + HPPh2 (a) and Cd(OA)2 + Se (b) in ODE, which had a Se concentration of 30 mmol/kg in ODE with a total weight of 5.0 g and the feed ratios of 4Cd(OA)2 (0.60 mmol) to 1Se (0.15 mmol) to 1HPPh2 (0.15 mmol) for Batch a and 1Cd(OA)2 (0.15 mmol) to 1Se (0.15 mmol) for Batch b. For Batch a, the addition of HPPh2 was right after that of Se powder at 40 C. Both reactions were held at 40 C for 10 min; afterwards, the reaction temperature was increased. For Batch a, when the temperature was held for 10 min at (1) 120, (2) 140, (3) 160, (4) 180, (5) 200, and (6) 220 C, samples were taken. For Batch b, samples were extracted when the temperature was held at 220 C for 10 (1) and 30 min (2), 240 C for 10 (3) and 30 min (4), and 260 C for 10 (5) and 30 min (6). Regarding the continuous redshift of the peak positions and fwhm, the optical spectra of two reaction samples are similar, and are comparable to those collected
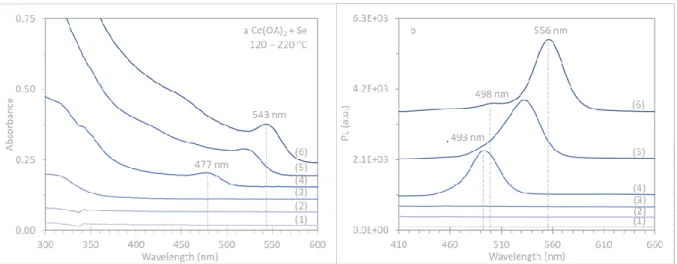
Figure S1-3. Batch a reaction presented in Figure S1-2 was repeated but without the use of HPPh2. Evolution of the optical absorption (left) and emission (right, excited at 400 nm) of CdSe samples (25 μL in 3.0 mL of toluene) extracted from Cd(OA)2 + Se reaction in ODE with the feed molar ratio of 4Cd (0.60 mmol) to 1Se (0.15 mmol). After held at 40 C for 10 min, the reaction temperature was increased and six samples were collected from the batch, when the temperature was held for 10 min at (1) 120, (2) 140, (3) 160, (4) 180, (5) 200, and (6) 220 C. It seems that the nucleation and growth of QDs are promoted without HPPh2, whereas clusters are suppressed. We attributed the difference between Figure S1-2a and
Figure S1-3 reactions to be related to the reactivity, which is relatively high for the former with HPPh2.
Figure S2-1. Additional PLE spectra collected for Sample 3 (a), 4 (b), 5 (c) (from Batch a shown in Figure S1), and presented in a similar format as that of Figure 2. Normalized absorption (gray dashed traces), emission (gray traces, with excitation wavelength of 400 nm), and PLE (blue traces). In addition to Clusters-437 and -453, Sample 3 also had Cluster-429, whereas Samples 4 and 5 had Cluster-467.
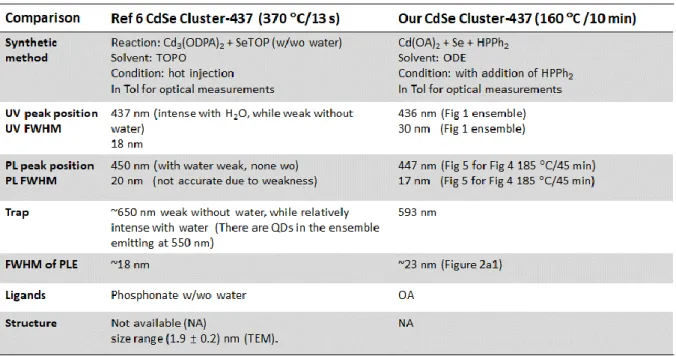
Table S2. Comparison of Cluster-437 in Reference 6 (Nanoscale 2018, 10, 18238–18248) and in the present work.
Figure S2-2a. To endorse Cluster-467, we performed another synthesis of Batch a, but with samples taken at higher temperatures in the range from 205 to 225 C with a step of 10 C. Evolution of the optical absorption (a, left) and emission (b, right, excited at 400 nm)
(spectra offset) of CdSe samples extracted from Batch a, which addresses the Cd(OA)2 + Se + HPPh2 reaction in ODE with the feed molar ratio of 4Cd (0.60 mmol) to 1Se (0.15 mmol). After held at 40 C for 10 min, the reaction temperature was increased and six samples were collected from the batch at (1) 205 C/0 min, (2) 205 C/30 min, (3) 215 C/0 min, (4) 215 C/30 min, (5) 225 C/0 min, and (6) 225 C/30 min. Thus, the six samples were taken after the temperatures were reached and held for 0 and 30 min. An aliquot of 25 μL of each as-synthesized sample was dispersed in 3.0 mL of Tol.
A redshift in absorption is seen from 459 (Sample 1 205 C/0 min) to 496 nm (Sample 6 225 C/30 min), and that of the corresponding PL from 479 to 513 nm. For each sample, the PL peak is asymmetric. Sample 2 (205 C/30 min) displayed two absorption peaks at 462 and 478 nm, the positions of which were close to those of Samples 1 and 3 (215 C/0 min), respectively.
Again, PLE was performed for the first three samples (Figure S2-2b). It appears that the population ratio of Cluster-467 and Cluster-482 decreased from Samples 1 to 3, similar to the decrease of the population ratio of Cluster-437 and Cluster-453 from Samples 3 to 5 (of
Figure S2-2b. Normalized PLE (blue traces, with corresponding emission wavelengths indicated by dashed blue arrows), optical absorption (gray dashed traces), and PL (gray traces excited at 400 nm) spectra collected from Samples 1 (left panel), 2 (middle panel), and 3 (right panel) which are presented in Figure S2-2a. The population increase of Cluster-482 from Samples 1 to 2 resulted to the presence of the red-side shoulder of the Sample 2 absorption. Cluster-467 contributes to the trap PL detected in each sample, but Cluster-482 does not.
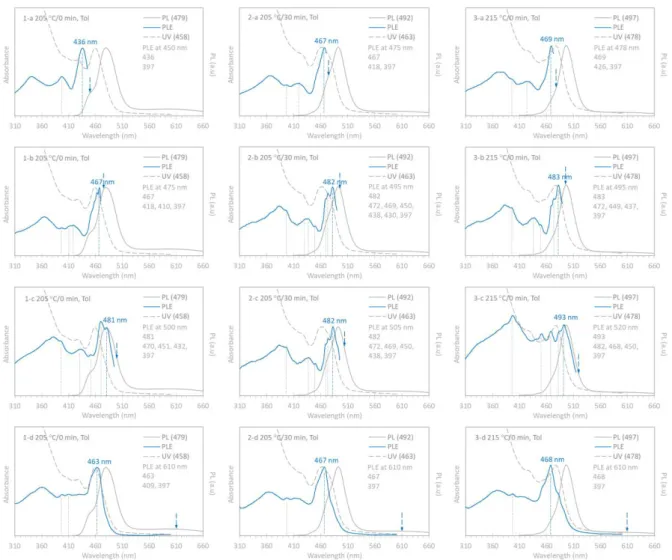
For Sample 1 (205 C/0 min), its PLE spectra display the lowest energy peaks at 436, 467, and 481 nm, when the emission was set at 450 (1-a), 475 (1-b), and 500 (1-c) nm,
respectively. When the emission was set at 610 nm (1-d), the PLE shows a peak that is quite similar to the corresponding absorption peak with the lowest energy. It seems that Sample 1 contains Clusters-437, -467, and -482, the first two of which were also presented in Figures 2
For Sample 2 (205 C/30 min), with the emission at 475 (2-a), 495 (2-b), and 505 (2-c) nm, its PLE spectra show the lowest energy peaks at 467, 482 and 482 nm, respectively. For the trap emission at 610 nm (2-d), the PLE spectrum shows again, a peak which is similar to the corresponding absorption peak. It seems that Sample 2 contains Clusters-467 and -482.
For Sample 3 (215 C/0 min), when the emission was placed at 478 (3-a), 495 (3-b), and 520 (3-c) nm, the lowest energy peaks of the PLE spectra are at 469, 483, and 493 nm, respectively. Interestingly, for the emission at 610 nm (3-d), the PLE peak does not overlap well with the absorption peak. The three types of Clusters-467, -482, and -492 were presented in Sample 3.
The PLE spectra of Samples 1 to Sample 3 remained their lowest energy peak positions at 467 and 482 nm. Thus, the three samples had Clusters-467 and -482 rather than QDs.
Based on the cluster identification, we provide our comprehension for the change of the optical properties from Samples 1 to 3 shown in Figures S2-2a. It seems that the population ratio of 467 to 482 decreased from Samples 1 to 3, similar to that of Cluster-437 to Cluster-453 from Samples 3 to 5 (from Figure S1-2 Batch a).
Figure S3. Additional PLE spectra collected for Sample 3 (a), 4 (b), 5 (c) (from Batch b shown in Figure S1-2) with emission were set at the blue side of the PL peaks. The presentation format is identical to that of Figure 3, with normalized absorption (gray dashed traces), emission (gray traces, with excitation wavelength of 400 nm), and PLE (blue traces). Here, the PLE spectra of Samples 3 to 5 matched well with the blue side of the lowest energy peaks of the corresponding absorption.
Figure S4-1. Evolution of the optical absorption (top panel) and emission (excited at 400 nm, bottom panel) of the twenty CdSe samples sequentially extracted from the Figure S1-2a
reaction of Cd(OA)2 + Se + HPPh2 at a constant temperature of 185 C. The spectra without and with offset are shown in the left and right panels respectively. The samples were extracted at 10 s (1), 2 (2), 4 (3), 6 (4), 8 (5), 10 (6), 15 (7), 20 (8), 25 (9), 30 (10), 35 (11), 45 (12), 60 (13), 75 (14), 90 (15), 105 (16), 120 (17), 135 (18), 150 (19), and 180 min (20). An aliquot (25 μL) of each sample was dispersed in toluene (3.0 mL) for the measurement. A quantized growth pattern is evident. From 20 (Sample 8) to 75 min (Sample 14), the
Figure S4-2. Evolution of the optical absorption without (left) and with (right) offset of the eight CdSe samples sequentially extracted from the Figure S1-2a reaction of Cd(OA)2 + Se + HPPh2 at a constant temperature of 175 C. The reaction periods at 175 C were 10 s (1), 5 min (2), 13 min (3), 23 min (4), 37 min (5), 52 min (6), 82 min (7), and 117 min (8). An aliquot (25 μL) of each sample was dispersed in toluene (3.0 mL) for the measurement. A quantized growth pattern is evident. Cluster-437 seemed to last for at least 117 min as monitored.
Figure S4-3. Evolution of absorption (top panel) and emission (bottom panel, excited at 400 nm) of the CdSe samples extracted from the Figure S1-2a reaction of Cd(OA)2 + Se + HPPh2, but at a relatively high temperature of 195 C. The spectra without and with offset are shown in the left and right panels, respectively. Fourteen samples were extracted at the reaction period of 10 s (1), 2 (2), 4 (3), 6 (4), 8 (5), 10 (6), 15 (7), 20 (8), 30 (9), 45 (10), 60 (11), 90 (12), 120 (13), and 150 min (14). An aliquot (25 μL) of each sample was dispersed in toluene (3.0 mL) for the measurement. At first, Cluster-437 evolved but might last only up to 10 min (Sample 6 with absorption peaking at 431 and 456 nm, and PL peaking at 450 and 473 nm). A quantized growth pattern seems to be observed.
Figure S4-4. Evolution of absorption (top panel) and emission (bottom panel, excited at 400 nm) of the CdSe samples extracted from the Figure S1-2 Batch b reaction of Cd(OA)2 + Se at a constant temperature of 230 C. The spectra without and with offset are shown in the left and right panels, respectively. Thirteen samples were extracted at the reaction period of 10 s (1), 2 (2), 4 (3), 6 (4), 8 (5), 10 (6), 15 (7), 20 (8), 25 (9), 30 (10), 35 (11), 45 (12), and 60 min (13). An aliquot (25 μL) of each sample was dispersed in toluene (3.0 mL) for the
Figure S5-1a. Our mathematical treatments for the subtraction of the cubic background (dashed traces). For the three optical absorption spectra presented in Figure 2, the resulting absorption spectra after the subtraction are shown in Figure 5.
Figure S5-1b. Comparison of the background subtraction for the absorption spectrum of Sample 160 C/10 min shown in Figure 2, with three mathematical functions which are parabolic (red trace), cubic (green trace), and exponential (blue trace). The absorption data used were between 350 and 370 nm, as well as between 480 and 500.
For the three background-subtracted spectra shown in the top part, multiple peak fitting was carried out, using the fixed peak positions of 429, 437 and 453 nm, together with their fixed fwhm of 20 nm. The values of the fitted parameters are shown in the bottom part, which includes also the returned peak height, fwhm for the 406 nm peak, and chi-squared values. The parameters highlighted in blue are fix parameters, while the rest parameters are free ones. The background subtraction with the three mathematical functions appears to be good. According to the smallest chi-squared value obtained, the cubic background
Table S3. Detailed parameters for the deconvolution presented in Figure 5. Parameters with blue background are fixed, while those with white background are free.
Figure S5-2. The returned values of the height of absorbance from Figure 5 deconvolution suggest that Cluster-437 was the majority for Sample 160 C/10 min, and Cluster-453 increased in population in Sample 180 C/10 min and dominated in Sample 200 C/10 min. This is in agreement with our conclusion for the study presented in Figure 2 for the three samples.