S1
Electronic Supplementary Material for
Prediction of P-Glycoprotein Inhibitors with Machine Learning Classification Models and 3D-RISM-KH Theory Based Solvation Energy Descriptors
Vijaya Kumar Hinge,1,# Dipankar Roy,1,# Andriy Kovalenko1,2,*
1 Department of Mechanical Engineering, University of Alberta 10-203 Donadeo Innovation Centre for Engineering, 9211-116 Street NW, Edmonton, Alberta T6G 1H9, Canada
2 Nanotechnology Research Centre, 11421 Saskatchewan Drive, Edmonton, Alberta T6G 2M9, Canada # Equal authorship
Corresponding Author
Contents: Descriptors used for model-23d, model-5d, and model-4d; performance indices of different classification schemes based on model; machine learning methods.
S2
Table S1. Descriptors used for model-23dDescriptor Details Descriptor Details
Exchem_Octanol Excess chemical potential in
octanol nHBAcc_Lipinski
number of H-bond acceptor as per Lipinski
Exchem_water Excess chemical potential in
water MW molecular weight
naAromAtom Number of aromatic atoms PMV_Octanol Partial molar volume in octanol
apol Sum of atomic polarization PMV_chcl3 Partial molar volume in
chloroform PMV_cyclohexane Partial molar volume in
cyclohexane nAromBond number of aromatic bonds
TopoPSA Topological polar surface area
(TPSA) nAtom number of atoms
PMV_hexadec Partial molar volume in
Hexadecane Exchem_hexadec
Excess chemical potential in hexadecane
Zagreb Zagreb number PetitjeanNumber Petitjean Number
McGowan_Volume McGowan Volume PMV_Water Partial molar volume in water
bpol Difference of bonded atom
polarizabilities Exchem_chcl3
Excess chemical potential in chloroform
nHBDon_Lipinski number of H-bond donor as per
Lipinski nHeavyAtom Number of heavy atom
Exchem_cyclohexane Excess chemical potential in cyclohexane
S3
Table S2. Descriptors used for model-5dDescriptor Details
Exchem_Octanol Excess chemical potential in octanol Exchem_water Excess chemical potential in water
NaAromAtom Number of aromatic atoms
Apol Sum of atomic polarization
S4
Table S3. Descriptors used for model-4dDescriptor Details
Exchem_Octanol Excess chemical potential in octanol Exchem_water Excess chemical potential in water
naAromAtom Number of aromatic atoms
S5
Table S4. Performance indicesa of different classification schemes based on prediction model-23d for the test set of PgP± compounds. Model-23d is developed with 23 molecular descriptors (Table S1).
StatisticalMethod Accuracy Precision Sensitivity Specificity F1-Score
GBM Method Run A 0.840 0.866 0.819 0.862 0.842 Run B 0.852 0.879 0.831 0.875 0.854 Run C 0.858 0.871 0.855 0.862 0.863 Run D 0.865 0.844 0.910 0.816 0.875 Run E 0.840 0.844 0.849 0.829 0.847 GLM Method Run A 0.714 0.739 0.699 0.730 0.718 Run B 0.509 0.530 0.536 0.480 0.533 Run C 0.519 0.542 0.506 0.533 0.523 Run D 0.547 0.570 0.542 0.553 0.556 Run E 0.481 0.503 0.464 0.500 0.483 SVM Method Run A 0.965 0.975 0.958 0.974 0.967 Run B 0.969 0.970 0.970 0.967 0.970 Run C 0.962 0.964 0.964 0.961 0.964 Run D 0.965 0.959 0.976 0.954 0.967 Run E 0.956 0.952 0.964 0.947 0.958 Weighted kNN Method Run A 0.874 0.871 0.892 0.855 0.881
S6
Run B 0.858 0.854 0.880 0.836 0.866
Run C 0.884 0.873 0.910 0.855 0.891
Run D 0.852 0.815 0.923 0.770 0.868
Run E 0.852 0.848 0.873 0.829 0.861
a For a measure of percentage of accuracy indices, please multiply individual values by 100%. The performance indices are calculated as follows: Accuracy = (TP + TN) / (TP + TN + FP + FN); Precision = TP / (TP + FP); Sensitivity = TP / (TP + FN); Specificity = TN / (TN + FP); F1-Score = 2× (Precision × Sensitivity) / (Precision + Sensitivity). TP = True Positive, TN = True Negative, FP = False Positive, FN = False Negative.
S7
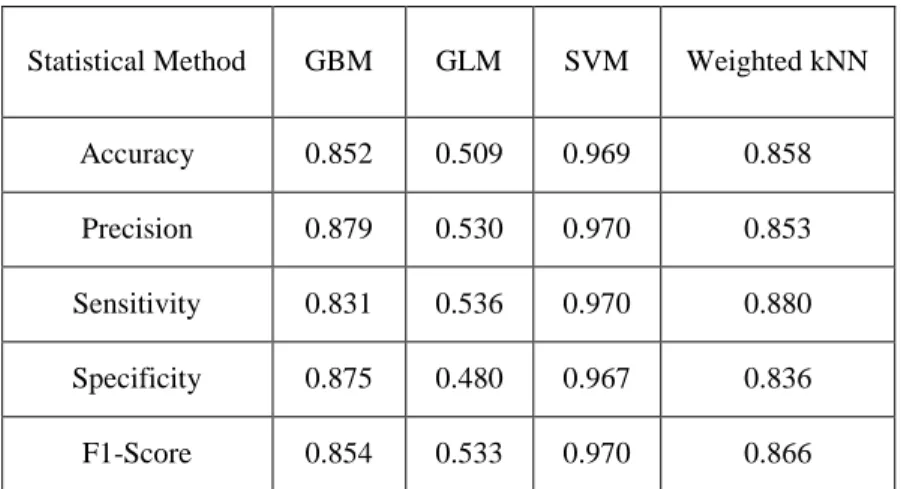
Table S5. Performance indicesa (with the best accuracy and precision) of different classification schemes based on prediction model-23d for the test set of PgP± compounds. The best accuracy and precision are taken from run A to E of Table S4 in the ESM.
StatisticalMethod GBM GLM SVM Weighted kNN
Accuracy 0.852 0.509 0.969 0.858
Precision 0.879 0.530 0.970 0.853
Sensitivity 0.831 0.536 0.970 0.880
Specificity 0.875 0.480 0.967 0.836
F1-Score 0.854 0.533 0.970 0.866
a For a measure of percentage of accuracy indices, please multiply individual values by 100%. Please see the footnote in Table S4 for the definitions of the performance indices used.
S8
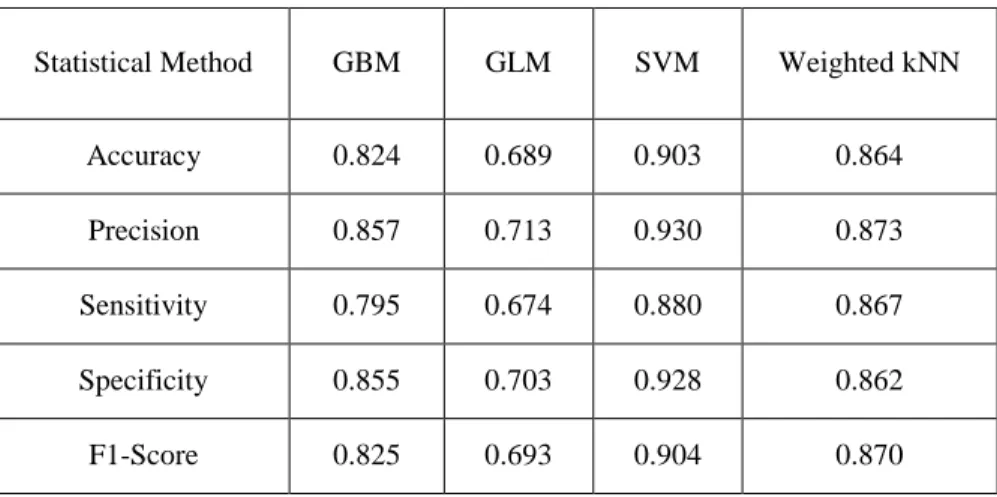
Table S6. Performance indicesa of different classification schemes based on prediction model-5d for the test set of PgP± compounds. Model-5d is developed with only five molecular descriptors (Table S2).
StatisticalMethod GBM GLM SVM Weighted kNN
Accuracy 0.824 0.689 0.903 0.864
Precision 0.857 0.713 0.930 0.873
Sensitivity 0.795 0.674 0.880 0.867
Specificity 0.855 0.703 0.928 0.862
F1-Score 0.825 0.693 0.904 0.870
a For a measure of percentage of accuracy indices, please multiply individual values by 100%. Please see the footnote in Table S4 (ESM) for the definitions of the performance indices used.
S9
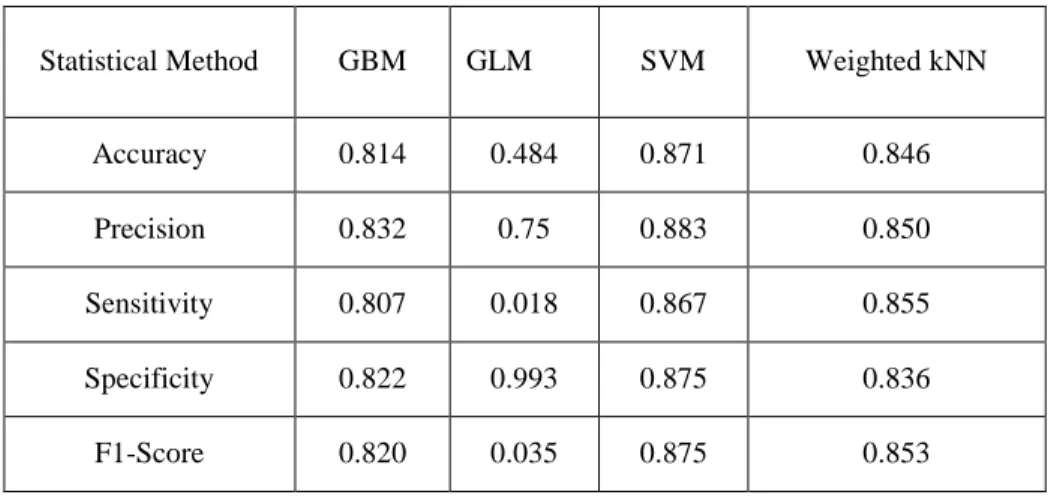
Table S7. Performance indicesa of different classification schemes based on prediction model-4d for the test set of PgP± compounds. Model-5d is developed with only four molecular descriptors (Table S3).
StatisticalMethod GBM GLM SVM Weighted kNN
Accuracy 0.814 0.484 0.871 0.846
Precision 0.832 0.75 0.883 0.850
Sensitivity 0.807 0.018 0.867 0.855
Specificity 0.822 0.993 0.875 0.836
F1-Score 0.820 0.035 0.875 0.853
a For a measure of percentage of accuracy indices, please multiply individual values by 100%. Please see the footnote in Table S4 (ESM) for the definitions of the performance indices used.
S10
Full Citation of Reference 45:Frisch, M. J.; Trucks, G. W.; Schlegel, H. B.; Scuseria, G. E.; Robb, M. A.; Cheeseman, J. R.; Scalmani, G.; Barone, V.; Petersson, G. A.; Nakatsuji, H.; Li, X.; Caricato, M.; Marenich, A. V.; Bloino, J.; Janesko, B. G.; Gomperts, R.; Mennucci, B.; Hratchian, H. P.; Ortiz, J. V.; Izmaylov, A. F.; Sonnenberg, J. L.; Williams; ; Ding, F.; Lipparini, F.; Egidi, F.; Goings, J.; Peng, B.; Petrone, A.; Henderson, T.; Ranasinghe, D.; Zakrzewski, V. G.; Gao, J.; Rega, N.; Zheng, G.; Liang, W.; Hada, M.; Ehara, M.; Toyota, K.; Fukuda, R.; Hasegawa, J.; Ishida, M.; Nakajima, T.; Honda, Y.; Kitao, O.; Nakai, H.; Vreven, T.; Throssell, K.; Montgomery, J. A., Jr.; Peralta, J. E.; Ogliaro, F.; Bearpark, M. J.; Heyd, J. J.; Brothers, E. N.; Kudin, K. N.; Staroverov, V. N.; Keith, T. A.; Kobayashi, R.; Normand, J.; Raghavachari, K.; Rendell, A. P.; Burant, J. C.; Iyengar, S. S.; Tomasi, J.; Cossi, M.; Millam, J. M.; Klene, M.; Adamo, C.; Cammi, R.; Ochterski, J. W.; Martin, R. L.; Morokuma, K.; Farkas, O.; Foresman, J. B.; Fox, D. J. et al. Gaussian16, revision B.01; Gaussian Inc.: Wallingford, CT, 2016.
Complete Citation for Reference 46:
Case, D. A.; Ben-Shalom, I. Y.; Brozell, S. R.; Cerutti, D. S.; Cheatham, T. E., III.; Cruzeiro, V. W. D.; Darden, T. A.; Duke, R. E.; Ghoreishi, D.; Gilson, M. K., et al.; Gohlke, H.; Goetz, A. W.; Greene, D.; Harris, R.; Homeyer, N.; Izadi, S.; Kovalenko, A.; Kurtzman, T.; Lee, T. S.; LeGrand, S.; Li, P.; Lin, C.; Liu, J.; Luchko, T.; Luo, R.; Mermelstein, D. J.; Merz, K. M.; Miao, Y.; Monard, G.; Nguyen, C.; Nguyen, H.; Omelyan, I.; Onufriev, A.; Pan, F.; Qi, R.; Roe, D. R.; Roitberg, A.; Sagui, C.; Schott-Verdugo, S.; Shen, J.; Simmerling, C. L.; Smith, J.; Salomon-Ferrer, R.; Swails, J.; Walker, R. C.; Wang, J.; Wei, H.; Wolf, R. M.; Wu, X.; Xiao, L.; York, D. M.; Kollman, P. A. AMBER; University of California: San Francisco, 2018.
S11
S1. Machine Learning Methods:Support vector machines (SVM): SVM is a supervised learning technique branch of machine learning, and is applied to both classification and regression problems. The superiority of the SVM model over conventional neural networks is due to the structure risk management principle adopted in it. There are several kernel functions available for SVM to transform data into a dimension with a clear division between classes. We have tested linear kernel, Gaussian type radial basis kernel, ANOVA radial basis kernel, and polynomial kernel types to find the best kernel for our classification problem. The best solution was obtained with the Gaussian type radial basis kernel.
Weighted
-Nearest Neighbor (kNN): kNN is a nonlinear approach initiated with the choice of a set of variables,
randomly, to obtain the best solution. The optimization of selection is done by leave-one-out cross validation, where each point is removed and predicted as an average of k-nearest points (i.e. molecules, for QSAR analysis). The weighted version of kNN is modified over the original implementation by adding weights to the Euclidean distance of the nearest neighbors based on proximity.[1]Gradient boost machines (GBM): This technique is similar to random Forest, as an ensemble learner, for performing supervised machine learning tasks.[2] It differs from RF as the loss function is minimized iteratively to find the best tree model.
Generalized linear models (GLM): This is an improved version over ordinary least square regression for non-continuous data with the assumptions that the residuals are normally distributed, and a linear relationship exists between the target and model parameters, using a form of maximum likelihood estimation.[3]
References:
1. Gou J, Du L, Zhang Y, Xiong T (2012) J. Info. Comput. Sci. 9:1429–1436.
2. James G, Witten D, Hastie T, Tibshirani R Tree-Based Methods. In An Introduction to Statistical Learning: with Applications in R; James, G., Witten, D., Hastie, T., Tibshirani, R., Eds.; Springer New York: New York, NY, 2013; pp 303–335.
S12
S2. Model validation:The performance of different statistical methods adopted in this manuscript is calculated via construction of a confusion matrix comparing the reported PgP inhibitor (1/0) against predicted PgP non-inhibitors (1/0) for each methods and models. The confusion matrix consists of the most important performance indicators: true positive (TP), false positive (FP), true negative (TN) and false negative (FN) counts. This information is used to calculate accuracy, sensitivity, precision, and specificity of each models and methods, using the following mathematical relations:
Accuracy = (TP + TN) / (TP + TN + FP + FN) Precision = TP / (TP + FP)
Sensitivity = TP / (TP + FN) Specificity = TN / (TN + FP)
Another performance index, F1-score, is also used for evaluation purposes in this work.[4] F1-score is a measure of accuracy of a model that combines model accuracy with sensitivity. A perfect model has an F1-score of 1, while the same for a failure is 0.
References:
4. Powers DMW (2011) Evaluation: From Precision, Recall and F-measure to ROC, Informedness, Markedness & Correlation. J. Machine Learning Technol. 2:37–63.