Publisher’s version / Version de l'éditeur:
Vous avez des questions? Nous pouvons vous aider. Pour communiquer directement avec un auteur, consultez la première page de la revue dans laquelle son article a été publié afin de trouver ses coordonnées. Si vous n’arrivez pas à les repérer, communiquez avec nous à [email protected].
Questions? Contact the NRC Publications Archive team at
[email protected]. If you wish to email the authors directly, please see the first page of the publication for their contact information.
https://publications-cnrc.canada.ca/fra/droits
L’accès à ce site Web et l’utilisation de son contenu sont assujettis aux conditions présentées dans le site LISEZ CES CONDITIONS ATTENTIVEMENT AVANT D’UTILISER CE SITE WEB.
Proceedings of the International Thermal Spray Conference 2019, 2019-05-29
READ THESE TERMS AND CONDITIONS CAREFULLY BEFORE USING THIS WEBSITE. https://nrc-publications.canada.ca/eng/copyright
NRC Publications Archive Record / Notice des Archives des publications du CNRC :
https://nrc-publications.canada.ca/eng/view/object/?id=1e043e75-7632-43a5-88f4-0d020891de34
https://publications-cnrc.canada.ca/fra/voir/objet/?id=1e043e75-7632-43a5-88f4-0d020891de34
NRC Publications Archive
Archives des publications du CNRC
This publication could be one of several versions: author’s original, accepted manuscript or the publisher’s version. / La version de cette publication peut être l’une des suivantes : la version prépublication de l’auteur, la version acceptée du manuscrit ou la version de l’éditeur.
Access and use of this website and the material on it are subject to the Terms and Conditions set forth at
Environmental, economical and performance impacts of Ar/H2 & N2/H2
plasma sprayed YSZ TBCs
Lima, Rogerio; Guerreiro, Bruno; Curry, Nicholas; Leitner, Matthias; Komer,
Karl
Environmental, Economical and Performance Impacts of Ar/H
2& N
2/H
2Plasma Sprayed YSZ TBCs
Rogerio S. Lima and Bruno M. H. Guerreiro
National Research Council of Canada, Boucherville, QC, Canada
Nicholas Curry, Matthias Leitner and Karl Körner
Treibacher Industrie AG, Althofen, Austria
Abstract
Since the 1970s the Ar/H2 plasma has been the standard APS gas system employed to deposit YSZ TBCs for the gas turbine industry, particularly regarding the legacy plasma spray torches. Although much less costly and yielding higher YSZ deposition efficiency (DE) levels, N2/H2 plasmas did not become the main stream plasma system. This N2/H2 issue occurred likely due to problems like preliminary APS torch Cu-nozzle erosion (Cu contamination on TBCs) and the tendency to produce denser coatings; potentially leading to TBCs exhibiting higher thermal conductivity (TC) and lower thermal cycle lifetimes. However, in the 21st century, environmental impact and economical aspects are becoming paramount. In addition, the introduction of new technologies (e.g., W-lined Cu nozzles, particle T & V sensors and computer-controlled automation) has increased dramatically the stability and reproducibility of APS processing. Therefore, the N2/H2 plasma concept needs to be revisited with respect to the legacy plasma spray torches; which are still highly used by the gas turbine industry OEMs and service centres worldwide. In this paper different sets of APS YSZ TBCs were deposited via Ar/H2 and N2/H2 plasmas (3MB torch). The DE, TC and furnace cycle test (FCT) were evaluated. The top-performing Ar/H2 and N2/H2 TBCs exhibited equivalent FCT lifetimes and TC values within the 1.15-1.25 W/mK range at 1200oC. Moreover, the top-performing N2/H2 TBC exhibited a 2-fold increase in DE and an overall 55% reduction in production cost when compared to the top-performing Ar/H2 TBC.
Introduction
Thermal Barrier Coatings (TBCs) Manufactured via Air Plasma Spray (APS)
TBCs manufactured via APS provide thermal insulation from the hot combustion gas stream to the static metallic parts located in the hot sections of gas turbine engines (e.g., combustion chambers) [1]. A thermally sprayed TBC system typically exhibits a bi-layered structure, which includes a ceramic top coat and a metallic MCrAlY (M = Ni, Co. NiCo or CoNi) bond coat (BC) [1]. The ceramic top coat (e.g., ZrO2 -7-8wt%Y2O3, a.k.a., YSZ) provides thermal insulation and reduces the heat flow to the turbine metallic part. The metallic BC is an oxidation/corrosion-resistant metallic layer. It
protects the underlying component and improves the adhesion of the ceramic top coat on the part.
Ar-based & N2-based Plasmas Key Differences
Briefly it is important to highlight that plasma is a “cloud” of an ionized gas formed by positive ions and free electrons. To create a plasma in APS torches, an initially non-ionized gas (e.g., Ar or N2) flows in between the cathode and anode (i.e., electrodes). Subsequently, an electric field (i.e., voltage) is applied between the electrodes. When the breakdown voltage is achieved (i.e., energy input), a current can be maintained as the free electrons move along the ionized gas. As the plasma gas propagates throughout the torch nozzle to the ambient away from the energy input, the electrons and ions recombine, thereby releasing energy in the form of heat and light. Specifically regarding APS torches, Ingham Jr. and Fabel [2] discussed some of the key differences between Ar-based and N2-based plasmas on how powder particles are melted during spraying. Figure 1 shows the enthalpy (i.e., total heat content) of main APS torch gases versus gas temperatures values [2].
Figure 1: Plasma temperature as a function of gas energy
content at atmospheric pressure (from [2]).
Monoatomic gases like Ar, undergo ionization and subsequent deionization. Diatomic gases like N2, undergo dissociation, followed by ionization and subsequent deionization and recombination. From Fig. 1, it can be inferred that the N2 plasma stabilization occurs at temperatures below 10000 K (~10000oC). For Ar, the plasma stabilization begins at temperatures higher than 10000 K (i.e., when the Ar enthalpy
shows a sudden steep increase). Therefore, N2 becomes an effective plasma gas for melting powder particles because of the high latent heat (i.e., enthalpy) available. Regarding Ar, it becomes an effective heating plasma gas for melting powder particles because of its high temperature level.
Moreover, Murphy and Arundell [3] showed that the thermal conductivities of an Ar plasma at temperatures of 10000-17000 K (Fig. 1) reaches a maximum of ~2.5 W/mK. However, that of a N2 plasma reaches a maximum of ~5.5 W/mK at temperatures of 5000-10000 K (Fig. 1).
Another important factor on the capability to melt powder particles during APS deposition is the plasma velocity [2]. The plasma velocity controls the dwell time of the powder particles in the plasma plume during spraying. The temperatures highlighted in Fig. 1 allow a discussion of plasma velocity levels. Initially it is necessary to consider the ideal gas law V = (nRT)/P; where V = gas volume, n = number of moles, R = gas constant, T = gas temperature and P = gas pressure. The velocity of a plasma plume is primarily caused by the rapid volume expansion resulting from the temperature to which the gas is heated by the torch. Figure 1 shows that Ar plasma temperatures are higher than those of N2 plasmas. For this reason, the velocities of Ar-based plasmas will tend to be higher than those of N2-based ones. As the velocity of the powder particles is proportional to the velocity of the plasma gas (via dragging); N2-based plasma sprayed particles will tend to exhibit lower velocity levels than those sprayed via Ar-based plasmas (under similar conditions of power and flow). The combinations of these gases produce the different particle melting conditions via plasma enthalpy, plasma temperature, plasma thermal conductivity, plasma velocity and particle dwell time in the plasma plume.
Marple et al. [4] looked at this issue into more detail. A commercially available plasma-spheroidized YSZ TBC powder was sprayed via a legacy APS 40 kW torch (9MB). Using different spray parameters but under similar conditions of power and flow, a total of 10 and 12 YSZ TBCs were sprayed via Ar/H2 and N2/H2 plasmas, respectively. The summary of the results can be found in Table 1.
Table 1: Summary of the particle temperature, velocity and
deposition efficiency values for Ar/H2 and N2/H2 plasmas for
YSZ using a 9MB APS torch [4].
Plasma Particle Temperature range Particle Velocity range YSZ Deposition Efficiency Ar/H2 2500-2780oC 130-160 m/s 10-38% N2/H2 2550-3100oC 70-120 m/s 5-70%
Consequently, the study of Marple et al. [4] corroborates the findings of previous works [2, 3]. It shows that Ar-based plasmas tend to induce higher particle velocities and lower particle temperatures when compared to N2-based ones (under similar conditions of power and flow). This study also shows the important advantage of using N2/H2 plasmas in order to
increase the deposition efficiency of YSZ powders for TBC production, which will be discussed in this manuscript.
On a final note, it needs to be stated that the H2 and He typically employed as a secondary gas for the legacy APS torches have the practical effect of increasing the thermal conductivity (i.e., thermal efficiency) of the Ar and N2 plasmas [2], but otherwise do not significantly affect the fundamental heating and momentum of the primary gas. Due to its high cost, He is now being avoided by the industry.
Ar-based & N2-based Plasmas Perspectives on TBCs
Legacy APS torches (e.g., 3MB, 9MB and F4) were the main ones commercially available for the gas turbine industry when TBCs became to be implemented during the mid-1970s and early 1980s. At that time plasma gas flow and current were set by manually adjusting (via human eye) rotameters and knobs. The flow of plasma gases, torch power and torch cooling were not recorded during spraying. There were no commercial sensors to measure thermal spray particle temperature and velocity and APS copper nozzles without tungsten lining were the only ones available. Consequently, it is easy to imagine that the thermal spray processing 40 years ago lacked reliability and reproducibility. Under these circumstances, the initial processing sets and specs for TBCs were written.
As previously shown in Table 1, N2/H2 plasmas can induce much higher deposition efficiency levels as those of Ar/H2 plasmas. In spite of that, the authors of this manuscript did not find any official reference on why Ar/H2 plasmas were preferred over the N2/H2 ones for the legacy APS torches (regarding the early TBC specs). Nonetheless, by “anecdotal evidence”, it seems that Ar/H2 plasma was preferred mainly due to its lower probability of eroding the copper nozzles (anodes) of the torches, thereby minimizing the potential of copper spiting and contamination on the TBC structure. El-Zein et al. [5] have shown that under similar gas flow levels, the current density (A/cm2) of a N2 plasma is ~25% higher than that of an Ar one. Higher current density is linked to higher heat load of the anode (nozzle) wall, and thus its erosion. Once a process is set and specs are written, it is expensive to change and qualify new processes and write new specs; particularly for the gas turbine industry.
Environment, Economics and Reality in the 21st Century
The 21st century is bringing a revolution in terms of environment, economics and data. The environmental laws are getting tougher and the companies are facing a stiffer competition to improve the quality of their products without causing more harm to the ambiance and climate. Higher demand for increasing productivity with a reduction in cost is paramount. For this reason, it is thought that deposition efficiency values lower than 50% may no longer be accepted in the near future by the industry. Besides, today in modern processing systems, APS torches are computer-controlled. Plasma gases are set and fixed constant by mass-flow meters. The same concept applies to plasma current and power. Torch cooling is also monitored. Different commercially available sensors to measure particle temperature and velocity are a reality. All these sets of data have the potential to be recorded and even analyzed in real-time using “big data” and the
internet of things (IoT); a.k.a., Industry 4.0. Thus, nowadays processing adjustments can be rapidly addressed or equipment malfunctions can be more easily detected before the spraying is performed. Finally, tungsten-lined copper nozzles for highly employed legacy APS torches like 3MB and 9MB are now available. They provide a higher processing security against TBC contamination during spraying and the longevity of the nozzle.
Rational and Objectives
Based on the facts above cited, it is worth to start a detailed study on the comparison of both Ar/H2 and N2/H2 plasmas using a legacy APS torch for TBC production. The goal of using a N2/H2 plasma is to minimize cost by increasing YSZ deposition efficiency, whilst, meeting the requirements of the application. Conventional wisdom would claim that N2/H2 plasma YSZ TBCs will be “too dense”, thereby yielding:
a) high thermal conductivity and low thermal barrier effectiveness;
b) high stiffness (i.e., high elastic modulus) and low capability to accommodate stress/strain;
c) low performance in thermal cycle life.
The objective of this initial work is to show that N2/H2 plasma YSZ TBCs produced via a legacy APS torch can be engineered to exhibit significantly higher deposition efficiency levels than those of a Ar/H2 plasma, while meeting the key performance standards (i.e., thermal conductivity and thermal cycle life) of Ar/H2 plasma YSZ TBCs.
Experimental Procedure
TBC Production using Ar/H2 and N2/H2 Plasmas
All TBCs produced for this study (including top and bond coats) were sprayed using a single APS torch (3MB, Oerlikon Metco, Westbury, NY, USA) for both Ar/H2 and N2/H2 plasmas. It is important to highlight that all nozzles exhibited a tungsten (W) lining and both the nozzles and cathodes were thorium (Th) free. Moreover, a mass-flow based computer-controlled console was employed to manage the TBC deposition. Table 2 shows some specific torch parts employed in this study.
Table 2: Summary of nozzles, cathodes and powder ports employed in this study for the Metco 3MB APS torch.
Plasma Nozzle* Cathode* Powder port*
Ar/H2 GHW-TF 2M11-TF #2 (1.85 mm) - dual N2/H2 GW-TF 2M11-TF #2 (1.85 mm) - dual *original (i.e., not generic) torch parts
The BC feedstock composition was NiCoCrAlY+HfSi (Amdry 386-4, Oerlikon Metco, Westbury, NY, USA). This powder exhibits a nominal particle size distribution of -90/+38 µm. The BC was sprayed using a N2-pure plasma (i.e., without H2) at a spray distance (SD) of 7.5 cm using a carrousel fixture (sample tangential speed of 110 cm/s and torch transverse speed of 1 mm/s). The substrates were grit-blasted with white Al2O3 prior to BC spraying. The BC thickness was 150-200 µm and Ra roughness was 4.36 ± 0.56 µm (n=10) (NRC
ID#180417B2).
The top coat feedstock was ZrO2-8wt%Y2O3 (AuerCoat YSZ LD-A, Treibacher Industrie AG, Althofen, Austria). This powder exhibits an agglomerated and sintered (A&S) morphology and a nominal particle size distribution of d10: 21 µm, d50: 54 µm and d90: 97 µm. The YSZ TBC thickness was 400-450 µm for overall testing and characterization of this study, which includes: (i) microstructural characterization (metallography), (ii) X-ray diffraction, (iii) furnace cycle testing and (iv) instrumented indentation testing. The summary of the spray parameters can be found in Table 3.
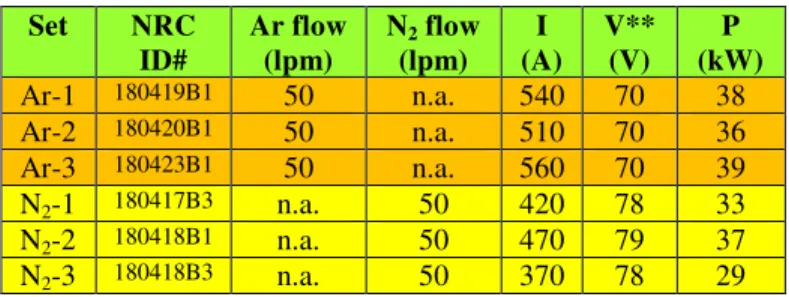
Table 3: Summary of the spray parameters for YSZ deposition via 3MB APS torch*.
Set NRC ID# Ar flow (lpm) N2 flow (lpm) I (A) V** (V) P (kW) Ar-1 180419B1 50 n.a. 540 70 38 Ar-2 180420B1 50 n.a. 510 70 36 Ar-3 180423B1 50 n.a. 560 70 39 N2-1 180417B3 n.a. 50 420 78 33 N2-2 180418B1 n.a. 50 470 79 37 N2-3 180418B3 n.a. 50 370 78 29 *fixed spray parameters: H2 flow @10 lpm, SD @7.5 cm,
carrier gas flow @6 lpm and powder feed rate @22 g/min **torch voltage measured at power supply
Moreover, in order to improve the accuracy and precision of this study, all YSZ TBCs employed in the overall testing and characterization above cited were produced in a single run using a carrousel fixture (sample tangential speed of 110 cm/s and torch transverse speed of 1 mm/s).
Nonetheless, the YSZ TBCs produced for deposition efficiency, density and thermal diffusivity/conductivity evaluation exhibited a thickness of 700-900 µm. They were initially sprayed together with the samples for overall testing and characterization (400-450 µm). However, to reach a thickness of 700-900 µm, a second spray run was performed immediately after.
The particle temperature (T) and velocity (V) values were measured using an infrared-based sensor (Accuraspray G3C, Tecnar, St-Bruno, QC, Canada) at the same SD employed to produce the samples, i.e., 7.5 cm.
Microstructural Characterization
In order to better preserve their real microstructures, the TBC samples were initially vacuum impregnated in epoxy resin and posteriorly ground/polished according to standard metallography procedures for TBCs. The cross-sectional microstructural features of the as-sprayed TBCs were analyzed by scanning electron microscopy (SEM).
X-ray Diffraction (XRD)
XRD using CuKα radiation was employed to evaluate the phase compositions of the YSZ TBCs. The XRD 2θ values ranged from 20o to 80o (scanning step size of 0.05o and step time of 2.5 s).
Deposition Efficiency (DE)
The YSZ TBCs employed to calculate DE values were sprayed onto white Al2O3 grit-blasted Almen N strips (76.2 mm x 19.05 mm x 0.79 mm) without BC. The Almen N strips were placed together in the carrousel fixture along the other samples produced for this study. The DE was measured based on the weight of the strips before and after TBC deposition, as well as, on the powder feed rate and on the total time the torch was over the strip during spraying.
Instrumented Indentation Testing (IIT)
IIT (G200, Agilent Technologies, Santa Clara, CA, USA), a.k.a., depth-sensing indentation, was employed to measure the elastic modulus (E) & hardness (H) values of the as-sprayed and thermal cycled YSZ TBCs. This is the technique developed by Oliver and Pharr [6], where the mechanical properties of materials can be determined directly from the indentation load and indentation displacement using high-resolution testing equipment. The E & H values (average of 20 indentations) were measured over the polished cross-sections of the coatings prepared for SEM evaluation (as described above) at RT. The IIT system employed a Berkovich indenter. The test was performed by using these main equipment set-up inputs: YSZ Poisson’s ratio estimated at 0.25, time to load 15 s, maximum indentation load of 50 gf (500 mN) and hold time at maximum indentation load of 10 s. Before testing the samples, the calibration of the equipment was double-checked with a fused silica (SiO2) standard, using the same indentation set-up inputs. A total of 3 indentations were generated before each TBC was probed. Average E values of ~72 GPa were obtained, which are close to the results reported in the literature for SiO2, i.e., ~70 GPa [6].
YSZ Density Measurements
The density of the YSZ TBCs was measured via the Archimedes water immersion technique. A total of 8 free-standing coatings, prepared for thermal diffusivity/conductivity measurements (700-900 µm), were used to determine the density values for each YSZ TBC set. The YSZ TBCs were deposited on white Al2O3 grit-blasted low carbon steel substrates without BC. The samples were cut into 10 mm x 10 mm coupons using a precision sectioning saw and detached from the substrate using an acid bath of hydrochloric acid. The porosity was calculated based on the difference between the YSZ TBC density versus the density of a completely dense YSZ sample.
Thermal Conductivity (TC) Measurements
Initially the thermal diffusivity (TD) values of free-standing YSZ TBC coupons described above (700-900 µm) were measured using the Xenon lamp flash technique (HT HyperFlash, Netzsch GmbH, Germany). A total of 4 as-sprayed YSZ TBCs (for each spray set) were measured from RT up to 1200oC in 200oC temperature steps. The measurement steps consisted of 5 “shots” performed on each sample at each temperature step. Subsequently, 3 additional YSZ TBCs of each spray set were heat-treated in air at 1200oC for 10 h. This heat treatment was performed to guarantee that the YSZ TBC microstructures would remain nearly stable prior to TD measurements at the same temperature levels (i.e., 1200oC). Finally, the TC values of the YSZ TBCs were
calculated using the YSZ TBC density (d) values, the YSZ specific heat (Cp) values (taken for literature) and the YSZ TBC TD values; i.e., TC = d x Cp x TD.
Thermal Cycle Life - Furnace Cycle Testing (FCT)
For each spray set, a total of 4 TBCs were employed during the FCT evaluation. The FCT was performed in open air and consisted of an 1100oC furnace hold for 60 min, followed by forced air cooling to 100oC within 10 min. All TBC samples were tested in one single batch. The samples were monitored for surface integrity using an automated image capture system of the sample stage on cooling. TBC failure was deemed to have occurred when 20% of the TBC surface showed spallation. The TBCs for FCT were sprayed onto puck-shaped (25.4 mm diameter x 6.2 mm thick) Hastelloy X substrates. The substrates were previously grit-blasted with white Al2O3. The BC was 150-200 mm thick and the YSZ top coat was 400-450 µm thick. Both layers were sprayed using the 3MB APS torch, as previously described.
An industrial reference TBC was also added to the FCT study to serve as a control. The industrial reference TBC was sprayed using another commercial APS torch (F4-MB, Oerlikon Metco, Westbury, NY, USA) via an Ar/H2 plasma. Both BC and YSZ top coat were sprayed using the F4-MB APS torch. The reference YSZ feedstock is commercially available and like the AuerCoat YSZ LD-A feedstock, also exhibited an A&S morphology. Moreover, the reference YSZ ceramic top coat exhibited thickness comparable to those of the 3MB APS torch samples. The porosity of the YSZ TBC reference was approximately 15%.
Results and Discussion
TBC Engineering using Ar/H2 and N2/H2 Plasmas
Figure 2 shows the resulting particle temperature (Tp) and particle velocity (Vp) values for the YSZ TBCs produced via the spray parameters described in Table 3. It is assumed a standard deviation (SD) of ±5% for the Tp and Vp values.
110 120 130 140 150 160 170 180 2700 2750 2800 2850 2900 2950 3000 3050 3100 3150 3200 3250 3300 3350 Ar-3 Ar-2 N2-2 N2-3 Ar/H2 plasma N2/H2 plasma
Particle temperature
(
oC
)
Particle velocity (m/s)
N2-1 SD for Tp & Vp = ±5% Ar-1YSZ melting point: 2700oC
Figure 2: YSZ particle temperature and velocity values for
Initially, it can be seen that the “average” Tp values of all sets of spray parameters were above the melting point of YSZ (~2700oC. It is also evident that the Ar/H2 plasmas yielded lower Tp and higher Vp values than those yielded by N2/H2 plasmas, as generally observed by Marple et al. [4]. It is important to stress that the SD of 7.5 cm was the same for all spray sets. Consequently, the higher Tp values observed for the N2/H2 plasmas were mainly related to increased dwell time of those particles in the plasma plume (lower Vp levels).
TBC As-sprayed Microstructures
The cross-sectional as-sprayed TBC microstructures observed by SEM can be found in Figs. 3 and 4. All YSZ TBCs are well-adhered to the BC (absence of horizontal gaps) and no vertical or horizontal cracks are found. However, it is noticed that the YSZ TBCs sprayed via N2/H2 plasmas (Fig. 4) are denser than those sprayed using Ar/H2 plasmas (Fig. 3).
Figure 3: Ar/H2 as-sprayed TBC microstructures (a) Ar-1, (b)
Ar-2 and (c) Ar-3.
Figure 4: N2/H2 as-sprayed TBC microstructures (a) N2-1, (b)
N2-2 and (c) N2-3.
Deposition Efficiency Values
The deposition rate (DR) and DE values for each set of spray parameters are summarized in Table 4.
Table 4: Summary of the YSZ DR and DE values for the Ar/H2
and N2/H2 plasmas.
Set Plasma DR (µm/pass) DE (%)
Ar-1 Ar/H2 ~31 36 Ar-2 Ar/H2 ~23 30 Ar-3 Ar/H2 ~29 38 N2-1 N2/H2 ~44 62 N2-2 N2/H2 ~43 61 N2-3 N2/H2 ~43 60
These results confirm the overall findings of Marple et al. [3] regarding the need of using N2/H2 plasmas in order to obtain
YSZ DE values higher than 50% for legacy APS torches. It needs to be stressed that the higher DR and DE values of the N2/H2 YSZ TBCs did not cause un-wanted defects on the coatings (i.e., debonding and/or delamination).
Phase Composition via XRD
Initially it is important to point out that the all XRD patterns are not shown in this manuscript (due to page limit
restriction). Briefly, no amorphous phases were detected and
all XRD patterns were matched to their respective powder diffraction files (PDFs). The YSZ powder feedstock exhibited a combination of monoclinic (PDF #37-1484) and (PDF #30-1468) cubic phases. All as-sprayed Ar-H2 YSZ TBCs exhibited the tetragonal t’-phase (PDF #48-0224) as the major phase and a minor percentage of monoclinic phase (PDF #37-1484). All as-sprayed N2-H2 YSZ TBCs exhibited only the tetragonal t’-phase (PDF #48-0224).
Thermal Conductivity
The relationship between the TC values at room temperature (RT) and porosity for the as-sprayed YSZ TBCs can be found in Fig. 5. The average porosity values for the Ar/H2 and N2/H2 YSZ TBCs are found within the ranges of 20-22% and 13-15%, respectively. According to Kulkarni et al. [7], the TC values of as-sprayed YSZ TBCs deposited via the 3MB APS torch (using Ar/H2 plasma) are found within in the range of ~0.6-1.0 W/mK. As shown in Fig. 5, all three as-sprayed Ar/H2 YSZ TBCs produced in this study exhibited TC values within that range.
Figure 5: Thermal conductivity at RT versus porosity values
for as-sprayed YSZ TBCs produced using Ar/H2 and N2/H2
plasmas.
Two of the three N2/H2 YSZ TBCs exhibited TC values above the Ar/H2 range, i.e., ˃1.0 W/mK. However, the data also shows that it is possible to produce YSZ TBCs using a N2/H2 plasma (e.g., N2-3) that exhibit as-sprayed TC values within the range of those of Ar/H2 YSZ TBCs. In fact, Tan et al. [8] have also shown that YSZ TBCs sprayed using a N2/H2 plasma can exhibit as-sprayed TC values within the ~0.6-1.0 W/mK range of the Ar/H2 YSZ TBCs. It is beyond the scope of this work to study and explain in detail why a denser YSZ TBC (e.g., N2-3 - porosity ~15% - Fig. 5) can exhibit TC values in the range of those of more porous ones (e.g., Ar-1,
Ar-2 and Ar-3 – porosity ~20-22% - Fig. 5). It is known that the higher the porosity, the lower the TC values of bulk ceramics. However, another factor comes into play for determining TC in APS ceramic coatings. McPherson [9] highlighted that the true area of contact between two adjacent as-sprayed splats is about 20%, whereas, the remaining 80% of the contact area is characterized by planar gaps of about 100 nm in thickness. Yet according to McPherson [10], the known “low” TC values of APS ceramic coatings can be explained in terms of a model not only involving the regular coating porosity but also involving the limited regions of contact between splats. This is the reason why as-sprayed ceramic APS coatings typically exhibit lower TC values than those of bulk materials, even when both exhibit similar levels of coarse porosity (~1-20 µm pore size). Corroborating to McPherson [9, 10], Kulkarni et al. [7] have also shown that the TC values of APS YSZ TBCs are highly influenced by the number of splat interfaces (boundaries) by per coating thickness. Each single splat boundary acts a barrier impeding the heat transfer to the adjacent splat along the TBC thickness. Therefore, depending on the ratio or compromise between the amount of coarse pores and the number of splat boundaries, TBCs that are “denser” can exhibit similar TC values of those that are “more porous” [7]. Based on the DR and DE data of Table 4 and the porosity data of Fig. 5, it can be hypothesized that the N2/H2 YSZ splats were probably thinner than the the Ar/H2 ones. Consequently, if this is correct, the number of splat interfaces per YSZ thickness of the N2/H2 TBCs is higher than those of the Ar/H2 TBCs. For this reason it is thought that the N2/H2 TBC N2-3 reached the “optimal” pore/splat-interface ratio.
Although these initial results are promising, one may ask what would happen to the TC values after the TBCs are exposed to high temperatures. In order to address this issue, all YSZ TBCs were initially heat-treated in air at 1200oC for 10 h. The heat treatment was employed to guarantee that the microstructures would remain nearly stable prior to TC measurements up to the same temperature (i.e., 1200oC). The TC results for the heat-treated YSZ TBCs (1200oC-10 h) measured from RT to 1200oC are shown in Fig. 6. As expected due to the heat treatment, all TC values at RT are found above 1.0 W/mK. It is possible to notice that the TC values maintained a steady decrease from RT to 800oC and began to increase again for higher temperatures. These changes in slopes are related to the different contributions of heat transfer mechanisms to TC.
Heat transfer occurs via conduction, radiation and convection. As ceramic materials like YSZ do not exhibit free electrons, the conduction is caused by a vibration of an array of atoms (i.e., lattice wave or phonons). The phonons can be imagined as behaving like sound waves. As the temperature increases, the scattering and interference of the adjacent waves (phonons) are so high that they tend to cancel each other, thereby causing the TC values to decrease. This is likely what occurred with the TC values from RT to 800oC (Fig. 6). However, at temperatures higher than 800oC, the radiant heat transfer becomes more predominant. In radiation heat is transferred via infrared (IR) electromagnetic waves (~1-1000 µm). At this IR wavelength range, ceramics can be transparent
12 13 14 15 16 17 18 19 20 21 22 23 24 0.75 0.80 0.85 0.90 0.95 1.00 1.05 1.10 1.15 N2-3 N2-2 N2-1 Ar-1 Ar-2 Ar-3
As-sprayed YSZ TBCs
TC @RT n (TC) = 4 n (porosity) = 8 Ar/H2 plasma N2/H2 plasmaThermal cond
uctivity (W
/mK)
Porosity (%)
to the radiation and heat can be transported through the ceramic material. Consequently, the heat transfer efficiency and TC likely began to increase at temperatures higher than 800oC, as shown in Fig. 6. This radiation contribution effect causing an increase of TC values at high temperatures (above 800oC) for APS YSZ TBCs has also been reported by Tan et al. [8]. Regarding convection, the effect is considered to be minor for APS TBCs. In convention the heat is transferred by the motion of a gas or fluid. Ratzer-Scheibe and Schulz [11] showed that the presence of a gas in the pores of a TBC increased the TC values of ~10% (compared to vacuum), from RT to 1200oC.
Figure 6: Thermal conductivity versus temperature for
heat-treated (1200oC-10 h) YSZ TBCs produced using Ar/H2 and
N2/H2 plasmas.
Finally, it needs to be stressed that at 1200oC the two lowest TC values were exhibited by the Ar-2 (~1.15 W/mK) and N2-3 (~1.25 W/mK) YSZ TBCs (Fig. 6). In fact, the average TC values of the Ar-1 and Ar-3 TBCs were slightly higher than that of the N2-3 one. Hence the data sets shown in Fig. 6 corroborate those shown in Fig. 5, i.e., N2/H2 YSZ TBCs, depending on the spray parameters; can exhibit TC values within the range of those of Ar/H2 YSZ TBCs.
Elastic Modulus Values
The E versus porosity values for the as-sprayed YSZ TBCs can be found in Fig. 7. It is known that the higher the porosity, the lower the E values of bulk ceramics. Therefore, as the Ar/H2 YSZ TBCs are more porous than the N2/H2 ones, they tend to exhibit lower E values (e.g., Ar-1 and Ar-2). Nonetheless, this study shows that it is possible to produce N2/H2 YSZ TBCs (e.g., N2-1 and N2-3) that exhibit average E values within the range of those more porous coatings (e.g., Ar-3). Nonetheless, Kulkarni et al. [7] also observed the same effect for as-sprayed APS YSZ TBCs. Following the same trend as that of the TC behaviour, it was shown that the E values of as-sprayed APS TBCs are not only determined by the porosity levels, but also by the number of splat interfaces. Consequently, just like the TC behaviour previously described, it is hypothesized that the N2/H2 TBCs N2-1 and N2-3 reached the “optimal” pore/splat-interface ratio. For this reason, their average E values are similar to that of the more porous Ar-3 TBC.
Figure 7: E versus porosity values for as-sprayed YSZ TBCs
produced using Ar/H2 and N2/H2 plasmas.
Thermal Cycle Life Performance via FCT
The number of cycles to failure for the Ar/H2, N2/H2 and industrial reference YSZ TBCs is shown in Fig. 8. The DE values for the Ar/H2 and N2/H2 TBCs were also included to better compare and understand the overall TBC performance. Briefly, the APS YSZ TBCs Ar-2 and N2-3 exhibited the highest and nearly-equivalent FCT lifetimes (~370 cycles). This performance means an average improvement of 75% in lifetime when compared to the industrial reference APS YSZ TBC (~210 cycles). Moreover, the N2-3 TBC exhibited a 100% DE improvement when compared to the Ar-2 TBC.
Figure 8: Number of cycles to failure and DE values for different sets of APS YSZ TBCs.
Environmental Footprint, Economical Aspects and Ar/H2
versus N2/H2 Plasma Cost Production Estimation
In the 21st century, companies need to adapt more than never to a stiffer competition, society awareness and tougher environmental laws. To stay ahead of competition, the industry needs to increase its productivity at the same time decrease its environmental footprint, i.e., the amount of natural resources and energy they use. With this concept in mind, the percentage reduction in overall cost and time for
12 13 14 15 16 17 18 19 20 21 22 23 24 80 90 100 110 120 130 140 150 160 170 Ar-3 Ar-2 Ar-1 N2-3 N2-1 N2-2 Indentation load = 50 gf (n=19-20) Berkovich indenter Ar/H2 plasma N2/H2 plasma
Elastic Mo
dul
us (GP
a)
Porosity (%)
n (porosity)=8As-sprayed YSZ TBCs
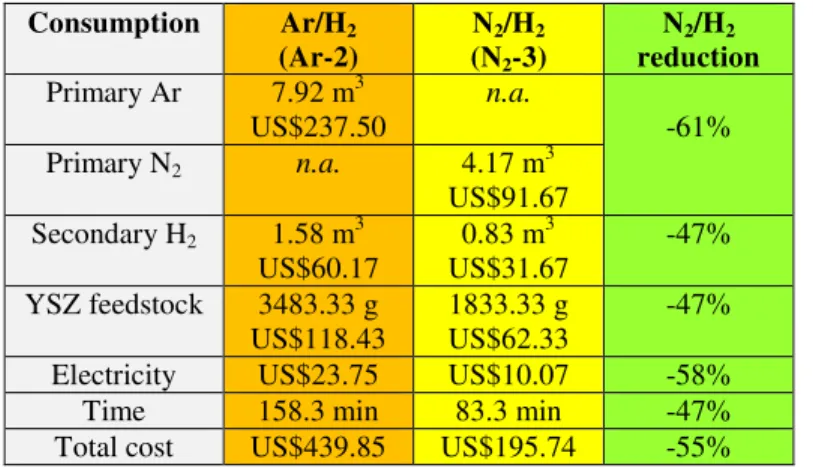
TBC production when an Ar/H2 plasma is replaced by and N2/H2 one was estimated. The two most performing TBCs, regarding lowest TC values (Figs. 5 and 6) and highest FCT lifetime (Fig. 8) were chosen for the estimation, i.e., Ar-2 and N2-3. The estimation was based on the spraying a 400-450 µm thick YSZ TBC on a 500 mm long cylinder component. This part could be considered as being similar to the inner wall of an annular turbine combustion chamber. The component tangential speed, the torch transverse speed, powder feed rate, DR and DE values used to estimate the cost and time to deposit the TBC were the ones used and obtained for this study. The cost of the consumables and energy were: 30 US$/m3 for Ar, 22 US$/m3 for N2, 38 US$/m3 for H2, 34 US$/kg for YSZ feedstock and 0.25 kWh for electricity. Other costs involved (e.g., labour) were not included in the estimation. The Ar/H2 versus N2/H2 plasma cost production estimation is summarized in Table 5. The data unequivocally shows the important environmental and economic benefits of using N2/H2 plasmas in legacy APS torches for TBC production.
Table 5: Estimation of the consumption of
consumables/electricity/time and the percentage reduction in
cost and time when replacing the Ar/H2 Ar-2 by the N2/H2 N2
-3 plasma set (400-450 µm YSZ TBC – 500 mm long cylinder).
Consumption Ar/H2 (Ar-2) N2/H2 (N2-3) N2/H2 reduction Primary Ar 7.92 m3 US$237.50 n.a. -61% Primary N2 n.a. 4.17 m 3 US$91.67 Secondary H2 1.58 m3 US$60.17 0.83 m3 US$31.67 -47% YSZ feedstock 3483.33 g US$118.43 1833.33 g US$62.33 -47%
Electricity US$23.75 US$10.07 -58% Time 158.3 min 83.3 min -47% Total cost US$439.85 US$195.74 -55%
n.a. – not applicable
Final Considerations
Although these initial results are promising, further development and testing must be done in order to qualify for production N2/H2 YSZ TBCs deposited via legacy APS torches. Electrode lifetime issues and burner-rig testing, among others, will need to be investigated in detail.
Conclusions
A commercial YSZ feedstock was sprayed using a legacy APS torch. Two types of plasmas were employed: Ar/H2 and N2/H2. The top-performing Ar/H2 and N2/H2 TBCs exhibited nearly-equivalent thermal cycle lifetimes (FCT) and similar thermal conductivity values at RT and 1200oC (difference less than 10%). In addition, the top-performing N2/H2 TBC exhibited a 100% improvement in deposition efficiency when compared to the top-performing Ar/H2 TBC (i.e., 60% versus 30%). These initial results show that under optimized spray conditions, N2/H2 TBCs have the potential to simultaneously
(i) minimize production costs, (ii) increase productivity, (iii) reduce environmental footprint and (iv) meet Ar/H2 TBC specs. Based on the improved thermal spray processing quality control available in the 21st century (e.g., Industry 4.0), it is thought that this R&D should be continued and the Ar/H2
versus N2/H2 plasma comparison needs to be re-visited.
References
[1] Feuerstein, A., Knapp, J., Taylor, T., Ashary, A., Bolcavage, A. and Hitchman, N. “Technical and Economical Aspects of Current Thermal Barrier Coating Systems for Gas Turbine Engines by Thermal Spray and EBPVD: A Review,” Journal of Thermal Spray
Technology, Vol. 17, No. 2 (2008), p 199-213
[2] Ingham Jr., H.S. and Fabel, A.J. “Comparison of Plasma Flame Spray Gases”, Welding Journal, February (1975), p 101-105
[3] Murphy, A.B. and Arundell, C.J. “Transport Coefficients of Argon, Nitrogen, Oxygen, Nitrogen, and Argon-Oxygen Plasmas”, Plasma Chemistry and Plasma Prcessing, Vol. 14, No. 4 (1994), p 451-490
[4] Marple, B.R., Lima, R.S., Moreau, C., Kruger, S.E., Xie, L. and Dorfman, M.R. “Yttria-Stabilized Zirconia Thermal Barriers Sprayed Using N2-H2 and Ar-H2 Plasmas: Influence of Processing and Heat Treatment on Coating Properties”, Journal of Thermal Spray Technology, Vol. 16, No. 5-6 (2007), p 791-797
[5] El-Zein, A., Talaat, M., El-Aragi, G. and El-Amawy, A. “Electrical Characteristics of Nonthermal Gliding Arc Discharge Reactor in Argon and Nitrogen Gases”, IEEE Transactions on Plasma Science, Vol. 44, No. 7, July (2016), p 1155-1159
[6] Oliver, W.C. and Pharr, G.M. “Measurement of Hardness and Elastic Modulus by Instrumented Indentation: Advances in Understanding and Refinements to Methodology”, Journal of Materials Research, Vol. 19, No. 1 (2004), p 3-20
[7] Kulkarni, A., Wang, Z., Nakamura, T., Sampath, S. Goland, A., Herman, H., Allen, J. Ilavsky, J., Long, G., Frahm, J. and Steinbrech, R.W., “Comprehensive Microstructural Characterization and Predictive Property Modeling of Plasma-sprayed Zirconia Coatings”, Acta
Materialia, Vol. 51 (2003), p 2457-2475
[8] Tan, Y., Longtin, J.P., Sampath, S. and Wang, H., “Effect of the Starting Microstructure on the Thermal Properties of As-sprayed and Thermally Exposed Plasma-Sprayed YSZ Coatings”, Journal of the American Ceramic
Society, Vol. 92, No. 3 (2009), p 710-716
[9] McPherson, “A Review of Microstructure and Properties of Plasma Sprayed Ceramic Coatings”, Surface and
Coatings Technology, Vol. 39, No. 40 (1989), p 173-181
[10] McPherson, R., “A model for the Thermal Conductivity of Plasma-Sprayed Ceramic Coatings”, Thin Solid Films, Vol. 112 (1984), p 89-95
[11] Ratzer-Scheibe, H.-J and Schulz, U. “The Effects of Heat Treatment and Gas Atmosphere on the Thermal Conductivity of APS and EB-PVD PYSZ Thermal Barrier Coatings”, Surface and Coatings Technology, Vol. 201 (2007), p 7880-7888
![Figure 1: Plasma temperature as a function of gas energy content at atmospheric pressure (from [2])](https://thumb-eu.123doks.com/thumbv2/123doknet/14014260.456764/2.918.491.860.715.928/figure-plasma-temperature-function-energy-content-atmospheric-pressure.webp)