Approaches to Study Zn(II) Deficiency and Transport in Biology
by
Christopher E. R. Richardson
Bachelor of Arts in Chemistry with Honors Hamilton College (2014)
Submitted to the Department of Chemistry in Partial Fulfillment of the Requirements for the Degree of
Doctor of Philosophy at the
MASSACHUSETTS INSTITUTE OF TECHNOLOGY September 2019
© 2019 Massachusetts Institute of Technology. All rights reserved
Signature redacted
Signature of Author:Department of Chemistry June, 2019
Certified by:
Signatureredacted
Matthew D. Shoulders Whitehead Career Development Associate Professor Thesis Supervisor
Certified by:---Signature
redacted
(A- (3 Q StephenJ. Lippard Arthur Amos Noyes Professor, Emeritus Thesis Supervisor
Acceptedby:---Signature
redacted
Robert W. Field
MASSACHUSETTS INSTITUTE
OF TECHNOLOGY Haslam and Dewey Professor of Chemistry
Chairman, Department Committee on Graduate Students
This doctoral thesis has been examined by a committee of the Department of Chemistry as follows:
Signature redacted
Elizabeth M. Nolan Professor of Chemistry Thesis Committee Chair
Signature redacted
C6- Matthew D. Shoulders Whitehead Career Development Associate ProfessorThesis Supervisor
Signature redacted
It phenJ. Lippard Arthur Amos Noyes Professor, Emeritus Thesis Supervisor
Approaches to Study Zn(II) Deficiency and Transport in Biology By
Christopher E. R. Richardson Submitted to the Department of Chemistry
on June 14, 2019 in Partial Fulfillment of the Requirements for the Degree of Doctor of Philosophy
Abstract
Divalent zinc, Zn(II), is an abundant and essential metal ion for human health. Across diverse biological settings, it stabilizes the structure of proteins, serves as a catalytic cofactor in enzymes with disparate functions, and mediates important signaling events. The ability of cells to apply Zn(II) in all these roles is contingent upon their ability to ensure adequate, but not excessive, Zn(II) levels. This control process, or homeostasis, is maintained by at least 24 transporters, including 14 ZIPs that increase the transition metal ion concentration of the cytosol and 10 ZnTs that decrease the transition metal ion concentration of the cytosol. Zn(II) homeostasis can be challenged either by excessive or inadequate nutritional Zn(II) or by interference of other metal ions with Zn(II) uptake transporters. Neither the molecular consequences of Zn(II) deficiency nor the molecular basis of ZIP-mediated selective metal uptake is well defined.
To address both these issues, I developed and applied new methodologies to study transition metal homeostasis. First, I report the preparation and use of "A12-resin", comprising the Zn(II)-binding protein
S100A12 conjugated to agarose, that is capable of selective depletion of Zn(II) from diverse biological media. I
deplete cell culture media of Zn(II) by using this resin and characterize the effects of Zn(II) insufficiency on the metabolism, transcriptome, and metallome of HEK293 cells. Second, I further apply Zn(II)-depleted cell culture media in a Zn(II) uptake assay. I show that repletion of Zn(II) depleted media with°Zn(II), a naturally low-abundance, stable isotope of Zn(II), enables sensitive, inductively coupled plasma-mass spectrometry-based measurements of Zn(II) uptake. Finally, I apply this assay to characterize the metal ion selectivity of human LIV-1 subfamily Zn(II) transporters. I show that the kinetic parameters associated with ZIP4, ZIPS, ZIP8, and ZIP10 transport of Mn(II), Cd(II), and Zn(II) are distinct, and that metal ion selectivity is conferred by the
transmembrane domains of the proteins rather than by the extracellular N-terminal domains. Taken together, the work presented in this thesis enables and motivates future work to interrogate transition metal homeostasis in human cells.
Thesis Supervisor 1: Matthew D. Shoulders
Title: Whitehead Career Development Associate Professor Thesis Supervisor 2: Stephen J. Lippard
Acknowledgements
Over the last five years I have been extremely fortunate regarding the support of colleagues and family. Without the former, I could not have done all the science that I wanted to do. Without the latter,
I would not be who and where I am today.
First, my advisers, Matt and Steve. You have both been extremely supportive and encouraged me to explore new areas of research. I am eternally grateful for the support and mentorship that I have received from each of you. Matt, you have driven me to try new experiments in lab and helped me to become a better scientist at every turn. Steve, you have pushed me to think critically and be more disciplined in my work. Both of you have taught me enormous amounts and provided me incredible guidance. Thank you.
Second, my thesis chair, Liz. You have been extremely helpful over the course of my PhD. You opened your lab to me to learn how to prepare A12, which enabled a significant fraction of the work in this thesis. Your input into my work and your mentorship has been extremely helpful both when you have given me the opportunity to present at your group meetings and at our meetings. Thank you.
Third, to all my labmates - past and present - thank you for making my time in graduate school so enjoyable, both in and out of the lab. There are three people to whom I owe a particular debt for their mentorship throughout graduate school: Andrew DiChiara, Jacob Goldberg, and Fang Wang. But I also owe much to all the members of both labs for simply putting up with me for the last five years. To all the Shoulders lab as well as to all the members of the zinc subgroup, thank you for your guidance, input, and for making my time at MIT extraordinary. Thank you.
Fourth, my family. In order of appearance in my life: Sarah, Mom, Dad, Maggie. Thank you for everything. I owe you more than I know how to write about here, but I will try. Sarah. #twinning. You are the best sister imaginable and I would not be who I am without you. Mom and Dad. I would not be here without the unconditional love and support you have given me for the last 26ish years. I am so incredibly
grateful for everything that you have done for me and the examples you have set for me. Finally, Maggie. You have been so patient and supportive throughout this process. I am profoundly lucky to have
someone as thoughtful, caring, and understanding as you in my life. You have made these past four years incredibly special. Thank you.
Dedication
Table of Contents
Approaches to Study Zn(II) Deficiency and Transport in Biology ... 1
Approaches to Study Zn(II) Deficiency and Transport in Biology ... 3
Abstract ... 3 Acknowledgem ents ... 4 Dedication ... 5 Table of Figures... 9 Table of Tables ... 14 Table ofAbbreviations... 15 Chapter 1 Introduction... 17 Overview...18
History and Importance of Zn(II) in Human Health... 19
The Bioinorganic Chemistry of Zn(II) and the Disparate Roles of the Ion in Biology.21 Bioinorganic Chemistry of Zn(II)...21
Structural Roles of Zn(II) ... 21
Catalytic Roles of Zn(II)...22
Zn(II) Signals ... 24
Conclusions...24
Zn(II) H om eostasis ... 25
Overview ... 25
Quantitative Descriptions of Zn(II) Content in Different Tissues... 25
Identification of the Roles of Bound Zn(II) in Cells... 27
M olecular Players in Zn(II) hom eostasis ... 32
Zn(II) Dyshom eostasis ... 39
Conclusions...43
How Does Zn(II) Homeostasis Interact with that of Other Metals Ions?...44
Overview ... 44
The M etal Ion Selectivity of ZIPs and ZnTs in vitro... 44
Studying ZIP and ZnT transporters in vivo... 44
Activation of the M TF-1 axis in response to non-cognate m etals ... 48
Conclusions...49
Outline of Original Research Contributions...50
References ... 51
Chapter 2 A Method for Selective Depletion of Zn(II) from Complex Biological Media and Evaluation of Cellular Consequences of Zn(II) Deficiency... 63
Author Contributions ... 63
Funding Sources...63
Abstract ... 64
Introduction...65
M aterials and M ethods... 67
Chem icals and Instrum entation ... 67
Expression and Purification of S10O A 12...68
Depletion of DM EM /FBS and Freestyle TM M edium with Chelex©...69
Depletion of Freestyle M edium with S100A12... 69
Preparation of Al2-resin ... 70
Resazurin Assay ... 71
C ellT iter-G lo *...7 1 IC P -M S ... 7 1 Labile Zinc M easurement with BLZinCh-1... 73
Alkaline Phosphatase Activity Assay... 73
RNA Harvesting for qPCR: ... 74
cDNA Synthesis for qPCR:...74
q P C R ... 7 4 RNA Harvesting for RNA-Seq...75
RNA-Seq Library Preparation and Sequencing... 75
RNA Seq Data Processing: ... 75
Results and Discussion... 77
References ... 90
Chapter 3 A sensitive, non-radioactive assay for Zn(II) uptake into metazoan cells ... 92
Author Contributions ... 92
Funding sources ... 92
Abstract ... 93
Introduction...94
M aterials and M ethods... 96
Chemicals and Consumables ... 96
Instrumentation...96
M edia Preparation, Cell Lines, and Reagents ... 97
Zn(II) Uptake Assay ... 97
M etal Competition Assay...97
Inductively Coupled Plasma-M ass Spectrometry (ICP-M S) ... 98
Cloning and expression of ZIP4, ZIP8, and ZIP10 into CM V-Sport-6 ... 98
Quantitative
PCR (qPCR) ... 99Statistical Analyses...99
Results and Discussion... 100
Zn(II) Uptake Assay Development and Validation ... 100
M onitoring How Genetic Perturbations M odulate Zn(II) Uptake Kinetics... 104
M etal Competition Experiments... 106
Zn(II) Deficiency Alters the Metal Ion Selectivity of Cellular Zn(II) Uptake Systems.... 108
Sum m ary and Conclusions ... 111
References ... 112
Chapter 4 Comparative Analysis of Metal Ion Selectivity in the LIV-1 Subfamily of Human ZIP Transporters...116
Abstract ... 117
Introduction...118
M aterials and M ethods...121
Transfection ... 121
On-Cell W estern Assay... 122
Data Processing for On-Cell W estern ... 122
M etal Uptake... 122
Arginase Assay ... 123
Immunoblotting... 124
Results ... 125
Comparison of ZIP4, ZIPS, ZIP8, and ZIP10 metal uptake... 125
The Transmembrane Domain, Rather than the N-Terminal Domain, of LIV-1 Subfamily ZIPs is the Primary Determinant of M etal Ion Selectivity W ithin the Subfamily... 131
Amino Acid Swaps Between ZIP4 and ZIP8 at the Predicted Metal Center Affect Metal Ion Selectivity and Transport Efficiency... 134
ZIP8 Increases the Activity of Endogenous Arginase Whereas ZIP4, ZIP4 H536E, and ZIP8 E343H do not... 137
Discussion ... 139
Conclusions...141
References ... 144
Chapter 5 Perspectives and Future Directions ... 148
Overview...149
Discussion ... 150
Cataloging the M etal Ion Selectivity of Human ZIPs ... 150
Select for and Control the M etal Ion Selectivity of ZIPs... 151
Tools to Study ZIP Structure and Function... 153
C on clu sion ... 15 5 References ... 156
Chapter 6 Appendices...157
Appendix 1: Effects of Zn(II) Deficiency on Cultured Cells ... 158
O verview ... 159
RNA-Seq Analysis Suggests that a Cellular Response to Zn(II) Deficiency Induces Changes in Ribosomal Protein Expression ... 160
M aterials and M ethods ... 171
References ... 174
Appendix 2: Hetero-oligom erization of ZIPs ... 176
O verview ... 177
ZIP Coimm unoprecipitations... 178
Split NanoLuciferase assay to measure the dimerization of ZIP N-terminal domains in live cells... 18 0 P ro to co ls:... 18 3 References ... 189
Table of Figures
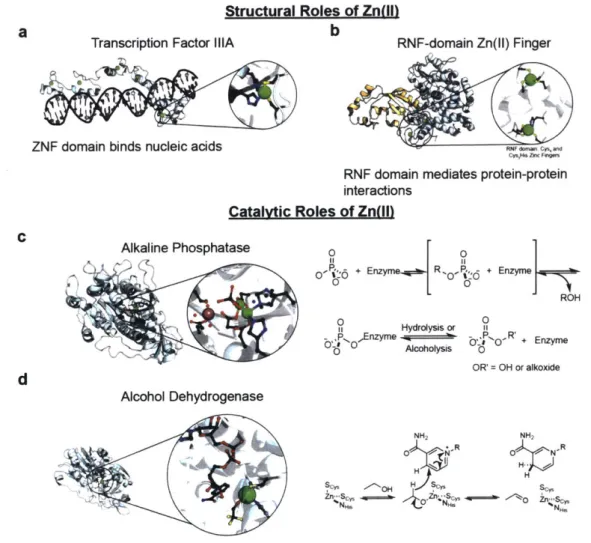
Figure 1.1 Overview of, and correspondence between, topics discussed in this chapter... 18 Figure 1.2. Select examples of functions of Zn(II) in proteins. (a-c) Structural roles of Zn(II). (d,e)
Catalytic roles of Zn(II). PDB IDs, (a-e): 1TF3, 1FBV, 2SOD, 1ALK, 1A71...23 Figure 1.3. Zn(II) concentrations in diverse murine tissues. The presented data are aggregated from
publications spanning four decades. Data were collected by using inductively-coupled mass
spectrom etry or atomic absorption spectroscopy. ... 27
Figure 1.4. (a) Structure of the human ribosome with ribosomal (RNA), zinc-binding large ribosomal subunit proteins (red), and zinc-binding small ribosomal subunit proteins (pink). (b) Table with list of hum an ribosom al proteins that bind Zn(II) ... 31
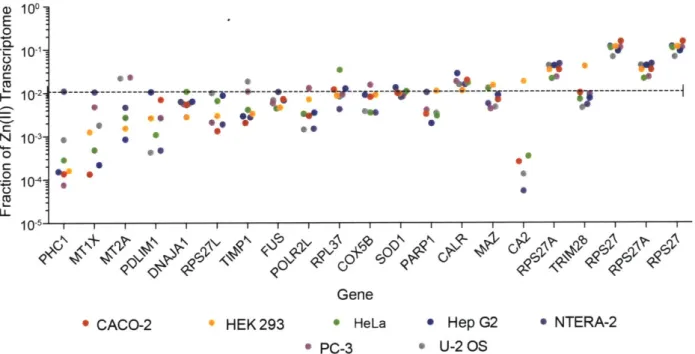
Figure 1.5. Analysis of the transcriptomes of common laboratory cell lines reveals that approximately
30% of the RNA corresponding to Zn(II)-binding proteins is accounted for by -20 transcripts.
Gene abbreviations: PHC1, Polyhomeotic Homolog 1; MT1X, Metallothionein IX; MT2A, Metallothionein 2A; PDLIM1, PDZ and LIM domain 1; DNAJA1, DNAJ Heat Shock Protein Family (Hsp40 Member Al); RPS27L, Ribosomal Protein Small Subunit Protein 27L; TIMP1; Tissue Inhibitor of Metalloproteinase 1; FUS, Heterogeneous Nuclear Ribonucleoprotein P2; RNA Polymerase I Subunit L; RPL37, Ribosomal Protein Large Subunit 37; COX5B, Cytochrome C Oxidase Subunit Sb; SOD1, Superoxide Dismutase 1; PARP1, Poly(ADP-Ribose) Polymerase 1; CALR, Calreticulin; MAZ, Myc Associated Zinc Finger Protein; CA2, Carbonic Anhydrase 2; RPS27A, Ribosomal Protein Small Subunit 27A; TRIM28, Tripartite Containing Motif 28; RPS27, Ribosomal Protein Small Subunit 27. Cell Line Tissues of Origin: CACO-2, Colorectal
Adenocarcinoma; HEK293, Human Embryonic Kidney; HeLa, Cervical Adenocarcinoma; HepG2, Hepatocellular Carcinoma; NTERA-2, Neuronal Precursor cells; PC-3 human prostate cancer cell
line;
U -2 O S, B one O steosarcom a...32Figure 1.6. Structure of the Escherichia coli ZnT-family member YiiP (PDBID: 2QFI) with emphasis on the D3H metal-binding center necessary for metal transport. Green spheres represent Zn(II) io n s...3 4 Figure 1.7. (a) Schematic of the topology of a LIV-1 subfamily ZIP. (b) Cartoon representation of the
structure of the gufA subfamily bacterial ZIP, BbZIP, from Bordetella bronchiseptica. (c) Metal binding site identified in the structure of BbZIP. (d) Predicted metal-binding ligands in ZIP4 based on a computational model of ZIP4 made by using Rosetta. (e) Structure of the dimeric N-terminal domain of fruit-bat ZIP4 (PDBID: 4X82). Green spheres represent Zn(II) ions and purple spheres rep resen t C d (II) ion s...36
Figure 1.8 Approaches to determine whether a particular transporter fluxes a particular metal ion. (a) Overexpression of a metal importer can increase the toxicity of metal ions to particular cells. (b) Suppression of uptake of a tracer isotope can be measured if suppression of uptake is taken to indicate transport of the suppressing metal. (c) Metal uptake can be directly measured either by using a stable isotope or radioisotope...46 Figure 1.9. (a) Schematic alignment of human ZIPs, highlighting the LIV-1 subfamily. (b) The
measured metal ion selectivity of human ZIPs assessed by the two protocols described in the text. No entry in the table indicates that no measurement has, to our knowledge, been made. An'x' indicates that transport is not suppressed. References corresponding to the data in this figure can be found in T able 4.2 and T able 4.3...48 Figure 2.1 (a/b) Chelex resin nonspecifically depletes cations from media (n=4, SEM). (c) TPEN
treatment of alkaline phosphatase secreted from transfected HEK293T cells diminishes the activity
of the enzym e (n=3,
±
SEM )...65
Figure 2.2. (a) ICP-MS analysis indicating that FreestyleTM medium is depleted of Zn(II) by direct addition of S10OA12 followed by removal of Zn(II)-bound S100A12 with a 10-kDa molecular weight cutoff filter (n=3, ±SEM). (b) S100A12 or S100A12 AHis3Asp can be conjugated to agarose
to afford two distinct resins. (c) A12-resin specifically depletes Zn(II) from DMEM/FBS, whereas the S100A12AHis3Asp (control) resin does not affect the metal ion concentrations of the medium
(n=3, ±SEM). (d) A12-resin depletes Zn(II) from an array of diverse cell culture medium formulations (n=4, ±SEM). (e) A12-resin selectively depletes human serum of zinc. (f)
Regeneration of the A12-resin in 1.0 M acetic acid (pH=3.8) enables multiple cycles of resin reuse (n = 4, SE M )...77
Figure 2.3 No component inA12-resin treated medium is reactive with an anti-S100A12 antibody, indicating that S10OA12 does not detectablyleach fromA12-resin...78 Figure 2.4. (a) HEK293 Freestyle cells cultured in a Zn(Il)-depleted medium exhibit a loss of metabolic
activity, as assessed by CellTiter-Glo* assay over 4 d of culture (n=3, ±SEM). (b) HEK293T cells cultured in a Zn(II)-depleted DMEM/FBS exhibit a loss of metabolic activity, as assessed by resazurin assay over 4 d of culture (n=3, ±SEM). (c) Heat map from RNA Seq of HEK-293 Freestyle cells cultured in untreated, depleted, and repleted medium reveals the specificity of
S100A12 medium depletion for Zn(II). (d) Total cellular Zn(II) content of HEK293T cultured in
Zn(II)-depleted medium is diminished relative to cells cultured in Zn(II)-adequate medium (n>6,
±SEM). (e) Culture of HEK293T cells in Zn(II) depleted medium does not affect intracellular free
Zn(I ) concentration (n=6, ± SEM )...79 Figure 2.5. HEK293 Freestyle Cells cultured for 36 h in Zn(II)-depleted medium exhibit a 30-fold decrease in MT1A transcript abundance compared to culture in full medium that is effectively rescued by repletion of Zn (II)...81 Figure 2.6. HEK293T cells cultured in Al2-resin-treated medium exhibit time-dependent decreases in
relative MT1A expression compared to both control treated and repleted medium. ... 81
Figure 2.7. Approximately 75% of transcripts from HEK293 Freestyle cells cultured in Zn(II)-depleted medium are differentially expressed(padj < 0.01) after 36 h of culture in Zn(II)-depleted medium.
... 8 2
Figure 2.8. HEK293T cells cultured for 24 h in Zn(II) depleted medium do not exhibit significant differences (p < 0.05) in the total concentration of any other detectable transition metal...82 Figure 3.1. Method to prepare 7°Zn-enriched medium and experimental workflow to monitor 07Zn(L)
uptake into m etazoan cells...95 Figure 3.2. (a) Workflow to assess time-dependence of 7°Zn(II) uptake. (b) HEK293T cells grown in
7Zn(II)-enriched media exhibited time-dependent 7°Zn(II) uptake (n = 3-4) but (c) total Zn per
mg-protein did not change over the course of the experiment (n = 3-4, SEM)... 100
Figure 3.3. Comparison of 70Zn(II) uptake from HEK293T cells cultured in DMEM/FBS spiked with 20 ppb 7°Zn(II) versus medium depleted of natural abundance Zn(II) then repleted with 71Zn()
(n = 3, SEM). The latter protocol affords a > 10-fold improved signal... 102 Figure 3.4. Structures of (a) EDTA, (b) TPEN, and (c) ZX1. (d) Cells washed with PBS containing 100
iM of these chelators before harvesting do not have significantly different concentrations of cell-associated zinc (n = 3, SE M )... 103
Figure 3.5. (a) Workflow to assess temperature-dependence of 70Zn(II) uptake. (b) HT1080, HepG2,
and HEK293T cells grown in 7
Zn(II)-enriched media took up significantly more Zn(II) when maintained at 37 °C for 2 h than when maintained at 4 °C (n = 3, SEM)... 104 Figure 3.6. (a) Workflow to assess effects of TPEN and pyrithione (PT) on 70Zn uptake. (b) Structure of
TPEN. (c) Structure of PT. (d) TPEN (5 M) diminishes 70 Zn(II) uptake into HEK293T cells
compared to vehicle (Veh) treatment (N = 3, SEM). (e) HEK293T cells incubated with 4 M
7 0
Zn(II) and 10 M PT take up significantly more 70Zn(II) than cells incubated with 4 tM 70 Zn()
in the absence of PT (N = 3-4, SEM). (f-h) HEK293T cells treated with PT take up significantly
more Zn (f) and Cu (i) but not Mn (g) or Fe (h) than do vehicle-treated cells (n = 3, SEM). p-values indicate Student's t-test adjusted with the Bonferroni correction for multiple testing. N.S. in d icates p > 0 .0 5... 105
Figure 3.7. (a-d) qPCR analysis for transcripts for metallothionein 1A and ZIP family transporters (N =
3, ±SEM). The gene name and protein name corresponding to the transcript analyzed in each panel
is indicated above each plot... 105
Figure 3.8. (a) Workflow to assess effects of ZIP transporter overexpression on 70Zn(II) uptake. (b) HEK293T cells transfected with ZIP4, ZIP8, or ZIP10 took up significantly more 7°Zn(II) over a 2-h period t2-han did cells transfected wit2-h GFP (N = 3, SEM). (c) HEK293T cells transfected with
ZIP4, ZIP8, or ZIP10 contained significantly more total Zn(II) than did cells expressing GFP (n= 3, SEM). p-values indicate Student's t-test adjusted with the Bonferroni correction for multiple testing (*** indicates p < 0.001, ** indicates p < 0.01)... 107
Figure 3.9. (a) Workflow to assess metal ion selectivity of cellular Zn(II) import machinery. (b) 70Zn(II) import into HEK239T cells was significantly inhibited by SO M of several divalent cations
(denoted M(II)), but most severely by Cd(II) (n = 3, ±SEM, *** indicates p < 0.001 for each comparison). (c-g) Treatment of HEK293T cells with 50 M divalent cation also increased total cellular content of the ions (N = 3, ±SEM, N.D. indicates not detected above background). p-values indicate Student's t-test adjusted with Bonferroni correction for multiple testing... 108 Figure 3.10. (a-e) Normalized cellular metal concentrations from HEK293T cells stimulated with 50
M of the indicated metal. Note there is no detectable Cd or Co in samples if cells are not treated w ith these m etals (n= 3, ± SEM ). ... 109
Figure 3.11. (a) Workflow to assess selectivity for Zn(II) over Cd(II). (b) HEK293T, HT1080, HepG2, and HeLa cells displayed enhanced Zn(II) to Cd(II) selectivity when the cells were previously
starved of Zn(II) (n = 3, ± SEM )... 110
Figure 4.1. (a) Cartoon representation of a ZIP showing the three domains that comprise LIV-1 subfamily members. (b) Crystal structure of the gufA subfamily member BbZIP. PDB ID: 5TSA. (c) Structure of the binuclear metal center identified in the crystal structure of BbZIP. (d)
Predicted ligand architecture based on the computational model of ZIP4... 118
Figure 4.2. (a) Alignment of human ZIPs with the LIV-1 subfamily members colored red, N-terminal domains colored blue, and transmembrane domains colored yellow. (b) ZIPs for which the metal ion selectivity has been measured directly. (c) ZIPs and metals for which metal ion selectivity has been measured indirectly.'x' denotes not inhibited. References corresponding to the data in b and c are presented in T able 4.2 and Table 4.3... 119
Figure 4.3. (a) Representative on-cell Western. (b) Quantitation of on-cell Western. (c) Tabulated values of Km,apand Vm, appfor RFP and ZIP transfection. (d-f) Plots corresponding to c. n=6-7 data points per m etal ion per transfection... 126
values ofKmap, and Vmax appfor
RFP
and ZIP transfection. (d-f) Plots corresponding to c. n=6-7data points per m etal ion per transfection... 127
Figure 4.5. (a) Representative on-cell Western. (b) Quantitation of on-cell Western. (c) Tabulated
values ofKm app and Vma app for RFP and ZIP transfection. (d-f) Plots corresponding to c. n=6-7 data points per m etal ion per transfection... 128
Figure 4.6. (a) qPCR analysis reveals ZIP0 expression. (b) Tabulated values ofKm,app and Vmaxapp for RFP and ZIP transfection. (c-e) Plots corresponding to c. n=6-7 data points per metal ion per tran sfection . ... 129
Figure 4.7. (a-d) Metal uptake data plotted as [metal uptake in transfection minus metal uptake in RFP samples]. n=6-7 data points per metal ion per transfection. ... 130
Figure 4.8. Schematic of construct design for N-terminal domain swap experiments... 131
Figure 4.9. (a) Representative on-cell Western. (b) Quantitation of on-cell Western. (c) Tabulated values ofKm, app and Vmax app for RFP and ZIP transfection. (d,e) Metal uptake data plotted as [metal uptake in transfection minus metal uptake in RFP samples]. n=6-7 data points per metal ion per tran sfectio n . ... 132
Figure 4.10. (a) Representative on-cell Western. (b) Quantitation of on-cell Western. (c) Tabulated values of Km, ap, and Vma app for RFP and ZIP transfection. (d,e) Metal uptake data plotted as [metal uptake in transfection minus metal uptake in RFP samples]. n=12-14 data points per metal ion per tran sfectio n . ... 133
Figure 4.11 (a) Alignment of a putative metal-binding residues in LIV-1 subfamily ZIPs reveals that only ZIP8 and ZIP14 have a glutamate at this metal-binding site. (b) Representative on-cell
Western. (c)
Quantitation
of on-cell Western. (d)Tabulated values
ofKm, app and Vmax, app for RFP and ZIP transfection. (e,f) Metal uptake data plotted as [metal uptake in transfection minus metal uptake in RFP samples]. N=6-7 per metal ion per transfection. n=12-14 data points per metal ion p er tran sfection . ... 134 Figure 4.12. (a) Representative on-cell Western. (b) Quantitation of on-cell Western. (c) Tabulatedvalues ofKm,ap and Vmax app for RFP and ZIP transfection. (d,e) Metal uptake data plotted as [metal uptake in transfection minus metal uptake in RFP samples]. n=12-14 data points per metal ion per
tran sfectio n . ... 13 5
Figure 4.13. (a) Workflow for arginase activity assay. (b) Expression of ZIP8 significantly increases arginase activity in HEK293T lysate (n = 4 from two independent experiments. ±SEM, p-value adjusted with Bonferroni correction, ns indicates that padj > 0.05)... 137
Figure 6.1. (a) Workflow for RNA harvest. (b) MT1A abundance in HeLa cells and Fibroblasts
decreases with time in culture. (c) Schematic of RNA-Seq library preparation method... 161 Figure 6.2. (a/b) GO groups up and down-regulated in HEK293T cells by 24 of growth in
Zn(II)-d ep leteZn(II)-d m eZn(II)-dia... 162
Figure 6.3. Principal component analysis of HEK293T, HeLa, and GM5294 cells grown in control,
Zn(II)-depleted, or Zn(II)-repleted DMEM/FBS. (a) HEK293T cells grown for 24 h in Zn(II)
depleted media are distinguished on principal component 1 from all other conditions implying that
this component captures gene expression associated with Zn(II) starvation. (b) In contrast,
principal components 1 and 2 from analysis of transcriptomic data from HeLa cells grown for up to
36 h in Zn(II)-depleted media are correlated with time in culture. (c) Zn(II) starvation is not
reflected in principal component 1 or 2 analysis of transcriptomic data arising from GM5294 cells grow n in Zn(II)-depleted m edia for 48 h... 163
Figure 6.4. (a) GO analysis of the genes that chiefly contribute to PC1 reveals an effect of Zn(II)
deficiency on HEK293T cells. (b) Flow-cytometry analysis of the cell cycle of HEK293T cells grown in Zn(II)-adequate and Zn(II)-depleted media shows that cell-cycle distribution is similar betw een each population... 164 Figure 6.5. (a-c) GSEA analysis reveals that, across HEK293T, HeLa, and GM5294 cell lines, Zn(II)
deficiency modulates expression of ribosomal proteins. Time points: HEK293T, 24 h; HeLa, 36 h;
G M 5294 ,24 h .1... 166
Figure 6.6. Volcano plots reveal the effect of Zn(II) starvation on the expression of ribosomal proteins in
H EK293T (a), H eLa (b) and GM 5294 (c) cells... 167
Figure 6.7. (a) Workflow for ribosome purification. (b) Absorbance profile of ribosomes purified by this approach from HeLa cells. (c, d) Neither ribosomes purified from HeLa or HEK293T cells grown in Zn(II) depleted media have significantly different Zn(II) content compared to ribosomes
purified from cells grown in Zn(II)-adequate m edia... 168
Figure 6.8. (a) Workflow for polysome profiling. (b) Polysome profile from HeLa cells grown in Zn(II)-depleted and Zn(II)-adequate media. Observed once, three biological replicates per condition. (c) Polysome profile from HEK293T cells grown in Zn(II)-depleted and Zn(II)-adequate media. Observed twice, three biological replicates per condition per experiment... 170
Figure 6.9(a) Coimmunoprecipitation workflow. (b) HA and FLAG probes for ZIP4-FLAG and ZIP4/S/8/10/12/13/14-HA transfections immunoprecipitated with HA-beads. (c) HA and
FLAG probes for ZIP8-FLAG and ZIP4/S/8/10/12/13/14-HA transfections immunoprecipitated
w ith H A -b ead s... 185
Figure 6.10. (a) Co-immunoprecipitation workflow. (b) SDS lysis and high-salt washing together increase the stringency of ZIP4/5/7/8/12/13/14-HA co-IP of ZIP8-FLAG... 186
Figure 6.11 The addition of EDTA to loading buffer (LB) does not appear to affect the oligomeric status of ZIP8-HA (lane 3). PNGase treatment reveals that ZIP8 is N-glycosylated (lanes 4 and 5). Heating lysate containing ZIP8 causes disappearance of HA signal (lanes 6-8)... 187
Figure 6.12 (a) Constructs designed for split NanoLuciferase (NanoBiT) assay. (b) Schematic of how the assay works. (c) ZIP4-LgBiT and ZIP4-SmBiT coexpression significantly increases cellular luminescence compared to cells expressing negative control proteins. (d) Zn(II) does not affect the luminescent signal from ZIP4 LgBiT. (e) The minimal model necessary to conceptualize the split luciferase assay when interacting partners are not identical... 188
Table of Tables
Table 1.1. Measured free Zn(II) concentrations in a subset of subcellular locales and cell lines...26
T able 2.1. qP C R prim ers...75
Table 2.2. Chelex nonselectively depletes cell culture medium of metalions...83
Table 2.3. S100A12 Selectively Removes Zn(II) from Freestyle Cell Culture Medium ... 84
Table 2.4. A12-Resin Can Deplete up to 99% of Zn(II) from DMEM + 10% FBS ... 85
Table 2.5. A12-Resin Selectively Depletes Zn(II) from a Range of Mammalian Cell Culture Media...86
Table 2.6 A12-Resin Selectively Depletes Zn(II) from Human Serum...88
Table 2.7. A12-Resin Can Be Reused at Least Four Times to Deplete Cell Culture Medium of Zn(II). 89 Table 3.1. Primers used for gene amplification and qPCR...99
Table 3.2. Metal and Zn isotope concentrations (ppb) in a typical preparation of07Zn(II)-repleted D M EM /FBS. N .D indicates not detected... 101
T able 4.1 Prim ers used to construct vectors... 121
Table 4.2. References corresponding to the chart in Figure 4.2b... 142
Table 4.3. References corresponding to the chart in Figure 4.2c. Numbers in parentheses correspond to the number of equivalents of metal required to suppress at least 50% of Zn(II) transport... 143
Table ofAbbr Acronym A12 AA AMPA As(III) Asp/D BbZIP Ca(II) Cd(II) cDNA CNS Cu Cys
d
DMT DNA E. coli EDTA Feg
h H/His HEK293T HRD ICP-MS Km Km, app LCso min Mn MT MTF-1 NMDA NRAMP pad PAL PBS PDB RING RNA S. cerevisiae SODI TFIIIA eviations Meaning S10OA12 Atomic Absorption ca-amino-3-hydroxy-5-methyl-4-isoxazolepropionic acid Trivalent Arsenic AspartateBordetella bronchispetica ZIP
Calcium
Divalent Cadmium
complementary Deoxyribonucleic Acid Central Nervous System
Copper Cysteine days
Divalent Metal Transporter Deoxyribonucleic Acid Escherichia coli Ethylenediaminetetraacetic Acid Iron Force of Gravity Hours Histidine
Human Embryonic Kidney cell line Transformed with SV40 Large T antigen Histidine-Rich Domain
Inductively Coupled Plasma-Mass Spectrometry Michaelis Constant
Michaelis Constant, apparent
Concentration of Compound Sufficient to Kill 50% of Cells Minutes
Manganese Metallothionein
Metal Responsive Transcription Factor 1 N-methyl-D-aspartate
natural resistance-associated macrophage proteins Adjustedp-value
Proline-Alanine-Leucine Phosphate Buffered Saline Protein Data Bank
Really Interesting New Gene (Family of Zinc Finger Proteins) Ribonucleic Acid
Saccharomyces cerevisiae
Superoxide Dismutase 1 Transcription Factor IIIA
TNAP Tissue Nonspecific Alkaline Phosphatase
TPEN N,N,N',N'-tetrakis(2-pyridinylmethyl)-1,2-ethanediamine
TRPM7 transient receptor potential cation channel subfamily M member 7
Vmax Maximum Velocity
Vmax,app Maximum Velocity, apparent
YiiP ZnT-family member in E. coli
ZIP Zrt- and Irt-like protein, SLC39A family proteins p
Zn(II) Divalent Zn(II)
ZNF Zinc Finger (of the ZNF family)
ZnT Zinc Transporter, SLC30A family proteins
Overview
Life on earth requires Zn(II). This thesis explores that point in the context of mammalian cells (Figure 1.1). In this introduction, we discuss five topics that bear on the extent and limitations of data regarding Zn(II) in human health and cell biology:
i. The history of Zn(II) in animal and human health
ii. The bioinorganic chemistry of Zn(II) and how the chemistry of the ion enables specific roles of
Zn(II) in biology (Figure 1.1)
iii. The nature of Zn(II) homeostasis - what it is, how it is maintained, and how it enables Zn(II) proteins to execute biological functions (Figure 1.1)
iv. The consequences of Zn(II) dysregulation (Figure 1.1)
v. The interaction of Zn(II) homeostatic machinery with other metals (Figure 1.1) Taken together, these points motivate the experiments described in the following thesis.
Chemistry
Physiology
Pathology
Properties of Zn(l) Roles of Zn(Il) in Biology Zn(ll) Homeostasis
Other Metals
30 NN-Zn(Hi)
Enable Enables Genetic Disease
Zn Environment
Figure 1.1 Overview of, and correspondence between, topics discussed in this chapter.
History and Importance of Zn(II) in Human Health
The hard-won proof that Zn(II) is essential for the growth and development of metazoans was made in 1933.'Work in the preceding decades had been stymied by the difficulty of preparing low-Zn(II) animal feed. Only by careful depletion and quantitation of low-Zn(II) in a specially designed diet was it discovered that Zn(II) is an essential element in rats.
Over subsequent decades, Zn(II) deficiency was recognized in other animals. In 1955, parakeratosis, characterized by dermal abnormalities and poor hair growth, was recognized to be a consequence of Zn(II) deficiency in swine and cattle.2 Three years later, slow growth of chicks was
similarly associated with Zn(II) deficiency.3 Evidencing the challenge of studying Zn(II) deficiency in the laboratory, chickens in such experiments were able to acquire sufficient dietary Zn(II) by pecking their cages. This experimental complication was addressed by coating the cages of the broilers with a lacquer.3 These and other cases, established the importance of Zn(II) in the diet of animals, and implied that Zn(II) had important biological functions.
It was not until 1961, however, that evidence emerged that Zn(II) deficiency could afflict humans. In this year, Ananda Prasad suggested that the gonadal abnormalities and dwarfism of an anemic (iron-deficient) Iranian population were the result of Zn(II) deficiency.4 Two years later, in
1963, further characterization of this and other similar populations strongly suggested that Zn(II)
deficiency could account for this syndrome.' Indeed, the symptoms of this population could be ameliorated with dietary co-supplementation of iron and Zn(II), but not iron alone; Zn(II) supplementation led to 15 cm of growth and normalization of the genitals within one year.
Both geophagy and high dietary phosphorus were initially suggested as causes of Zn(II)
deficiency in the Iranian population.4 The latter hypothesis appears to be correct; the proximal cause of the combination of anemia and Zn(II) deficiency was traced to the high amount of phytate that this population consumed.'" Phytate, which is a phosphate storage molecule in plants (cereal grains in particular), can bind up to five equivalents of Zn(II) with sufficient affinity that the ion cannot be absorbed by the gut.'" Consequently, a diet replete with Zn(II) can cause an individual to become Zn(II)-deficient if the diet is also high in phytate.9,"
Even in some patients who consume sufficient Zn(II) and whose diet does not contain phytate, mutations in genes encoding Zn(II) importers can cause symptoms of Zn(II) deficiency. This
condition, known as acrodermatitis enteropathica, was first recognized in 1973 in a young girl
experiencing symptoms similar to those that Prasad had observed in Iran. 2 Fortunately, the symptoms
are treatable by supplementation of the diet with Zn(II). In 2002, genetic analysis revealed that this condition was caused by mutations in the Zn(II) transporter ZIP4." Further discussion of this and related transporters is provided in the section entitled 'Molecular Players in Zn(II) homeostasis.'
Irrespective of cause, severe Zn(II) deficiency remains a serious challenge in the developing world. A United Nations/World Health Organization states that up to 800,000 people die per year because of Zn(II) deficiency and s 2.9% of the global loss of disability adjusted life years is attributable to Zn(II) deficiency.4
A key challenge remains to identify the extent to which Zn(II) deficiency is pervasive in both the
developing and developed world. Some investigators suggest that'marginal'or'moderate'Zn(II) deficiency is a global health challenge." Available evidence neither supports nor refutes this claim, in part because the condition is so ill-defined. Neither the pervasiveness nor the consequences of this condition are well-characterized in humans because reliable biomarkers for Zn(II) status have not been identified.l"
The foregoing points regarding the dramatic consequences of Zn(II) deficiency highlight the importance of Zn(II) in biology. The remainder of this thesis explores the roles of the Zn(II) in mammalian cell physiology. Further discussion of Zn(II) deficiency is included throughout.
The Bioinorganic Chemistry of Zn(II) and the Disparate Roles of the Ion in Biology
Bioinorganic Chemistry of Zn(II)
Diverse biomolecules bind Zn(II) and gain physiological function. Its closed-shell configuration and the Lewis acidity of its complexes explain the many roles of Zn(II) in biology. The former makes it difficult for Zn(II) to be oxidized or reduced under physiological conditions. As a result, Zn(II) in biology is the divalent cation. Nonetheless, it can mediate redox chemistry as in the case of alcohol dehydrogenase. Moreover, the closed shell configuration also allows Zn(II) centers in biology to have a
number of coordination sites and geometries. ,17, In contrast to most d-block elements, biological
Zn(II) often attains a tetrahedral coordination environment. This point is related to the discussion in the Section entitled'How Does Zn(II) Homeostasis Interact with that of Other Metals' regarding toxicity of Cd(II) and Zn(II) because Cd(II), which, like Zn(II), has a delectronic configuration, might bind at similar sites in proteins as does Zn(II).'"
An additional feature of biological Zn(II) is its Lewis acidity. Water coordination to carbonic
anhydrase, for instance has a pKa of approximately 7,"1" compared to a value of 14 for pure water.
Ligand binding to Zn(II) can also increase the electrophilicity of the ligand, as is observed in alkaline phosphatase.
The roles of Zn(II) in biology can be categorized as (i) structural, (ii) catalytic, or (iii) signaling. Examples of Zn(II) in each role follow and introduce the ensuing discussion of Zn(II)
(dys)homeostasis.
Structural Roles of Zn(II)
A key example of proteins in which Zn(II) serves a structural role is zinc fingers. First, on a
protein identity basis they likely constitute at least 50% of Zn(II)-binding proteins in mammalian cells."'" Second, they execute a variety of cellular functions that range from serving as transcription factors to mediating protein-protein interactions."
Transcription Factor IIIA (TFIIIA, (Figure 1.2a) is the prototypical zinc finger family (ZNF) member. Indeed, it was the first zinc finger to be discovered and was identified as such by Klug in 198524
while studying transcription.2 Subsequent crystallographic26 and NMR" analysis of two different
ZNF-family members (Zif268 and ADR1) revealed that the motif comprises two beta sheets and an alpha helix that together provide two cysteines and two histidine residues to ligate Zn(II). These structural features are also present in TFIIIA (Figure 1.2a).
Since the discovery of this first zinc finger, 30 families of zinc finger proteins have been
identified, each distinct from the canonical TFIIIA structure described above. Members of two of these families, the ZNF family (i.e., TFIIIA) and the RING (Really Interesting New Protein) finger family (RNF) family are shown in Figure 1.2b and the ZNF family is further described below.
ZNF proteins (like TFIIIA) are transcription factors. Two features define the interaction of the ZNF motif with DNA. First, because zinc fingers do not fold into
a'finger'without
Zn(II),2 7 ZNFprotein interaction with DNA requires Zn(II) binding. Second, ZNF proteins are selective for particular
DNA sequences. Selectivity for a particular three nucleotide sequence is engendered by the identity of
amino acids in the alpha helix of the motif. The sequences of the alpha helix confer DNA sequence selectivity because the alpha helices lie within, and contact bases in, the major groove of DNA." Homologation of ZNF domains can increase the affinity of proteins containing zinc fingers for DNA beyond the affinity of a single zinc finger domain.2
1
The ZNF family member MTF-1 (metal responsive transcription factor 1) illustrates both points. MTF-1, which is comprised of six zinc finger domains and three transactivation domains, is the
central node in the metazoan response to metal stress.29 Stimulation of metazoan cells with Zn(II) or
heavy metals (Cd(II), As(III)) drives MTF-1 translocation to the nucleus. There, MTF-1 binds to the metal response element" and initiates transactivation of the Zn(II) exporter ZnT1,1,32 the Zn(II)-buffering protein metallothionein,3 3 and other genes.3 In an alternative mode of action, MTF-1
represses transcription of the Zn(II) importer ZIP1O.34
,31 When Zn(II) is limiting for growth,
ZIP10
expression is derepressed and the mRNA encoding the protein is transcribed.3 This repressive action of MTF-1 is realized by binding of MTF-1 to a metal response element downstream of the transcription start site of ZIP10, thereby inhibiting transcription.5
Catalytic Roles of Zn(II)
Zn(II) serves as a catalytic cofactor in enzymes of all classes.22 In the following section, we describe two enzymes that apply Zn(II) to promote different functions, namely, alkaline phosphatase and alcohol dehydrogenase. In alkaline phosphatase, Zn(II) activates an electrophile for nucleophilic attack. Alcohol dehydrogenase, on the other hand, achieves redox catalysis by using redox-inert Zn(II). Both the structure and catalytic mechanism of each enzyme will be briefly discussed.
Escherichia coli alkaline phosphatase was first identified as a Zn(II) enzyme in 1962 by Vallee
and coworkers.3 37 The enzyme bears two dinuclear Zn(II) sites (Figure 1.2c)3 that independently
catalyze the hydrolysis of phosphomonoesters. The catalytic cycle of the enzyme proceeds through a covalent phosphoseryl intermediate that is subsequently hydrolyzed or alcoholyzed to regenerate the unmodified enzyme (Figure 1.2c). 9 Apart from Zn(II), the enzyme also requires a Mg(II) ion near the
catalytic site (Figure 1.2c).
Humans express four isoforms of alkaline phosphatase in a somewhat tissue-dependent manner: intestinal alkaline phosphatase, placental alkaline phosphatase, germ cell alkaline phosphatase, and tissue nonspecific alkaline phosphatase (TNAP)." This last isoform is critical for human health - 32
characterized mutations in the gene result in hypophosphatasia, a disease characterized by symptoms
that range in severity from weakened bones to death in utero as a consequence of poor bone mineralization.
Another important Zn(II) metalloenzyme is alcohol dehydrogenase, which offers a key defense mechanism against alcohol poisoning in the liver (Figure 1.2d). The alcohol-oxidizing activity of animal tissue was first identified in 1910, but isolation and characterization of alcohol dehydrogenase began in the 1930s.4 Later work by Vallee and coworkers identified both the yeast and horse liver alcohol
dehydrogenase as Zn(II) enzymes.43 4 4Whereas the dimeric yeast enzyme binds four equivalents of
Zn(II), the monomeric equine homolog binds only two. Twenty years later, in 1976, Eklund and coworkers refined the structure of horse liver alcohol dehydrogenase (Figure 1.2d), revealing the Cys2His, coordination environment of the catalytic Zn(II) in the enzyme (Figure 1.2d), and that of the
structural Zn(II), which is ligated by four cysteine residues.45 Alcohol binding to the catalytic Zn(II) enables c-hydride transfer to nicotinamide adenine dinucleotide (Figure 1.2d).
Structural Roles of ZnI1)
a
Transcription Factor
lIl
ZNF domain binds nucleic acids
C
Alkaline Phosphatase
Alcohol Dehydrogenase
d
b
A RNF-domain Zn(lI) Finger
RNF domain mediates protein-protein
interactions
Catalvtic Roles of Zn(II)
O1
1
O'.6 +Enzyme R'O' 'd + Enzyme
ROH 0 0 iiHydrolysis or I , .P.. ,.Enze - P. R' cl_#O +Enzyme+a b-1O Aicoholysis 0 OR'= OH or alkoxide NH2 NH2 NR o /I NR - H HS-S. Hey, ZNS
Figure 1.2. Select examples of functions of Zn(II) in proteins. (a-c) Structural roles of Zn(II). (d,e) Catalytic roles of Zn(II). PDB IDs, (a-e): 1TF3, 1FBV, 2SOD, 1ALK, 1A71.
Zn(II) Signals
The best-characterized signaling role of Zn(II) occurs in the central nervous system (CNS), where it has been investigated for more than three decades.46 For instance, Zn(II) binding to the NMDA
receptor inhibits post-synaptic calcium flux.4748 Zinc involved in signaling of this kind, so-called 'mobile
Zn(II)', is co-secreted with the neurotransmitter glutamate from pre-synaptic terminals in the CNS. Propagation of a post-synaptic action potential requires glutamate binding to a post-synaptic NMDA receptor, thereby opening a Ca(II) channel in the membrane and permitting flux of Ca(II) down its membrane potential into the post-synaptic neuron. Zn(II) binding to the NMDA receptor can inhibit this process. In particular, Zn(II) binds at the GluN2A/B subunit of the NMDA receptor preventing channel opening in response to glutamate.49Adding complexity to the roles of Zn(II) in the brain, Zn(II) also appears to inhibit AMPA-receptors. -` The totality of physiological contexts in which such inhibition is relevant is still being defined, but recent work suggests that Zn(II) may control the gain of excitatory signals in the central nervous systems.4 75'
A further role of Zn(II) in signaling is in oocyte maturation and fertilization. Prior to maturation,
oocytes take up -20 billion zinc ions.2 Immediately following fertilization, a bolus of Zn(II) is released
from the oocyte.5 3 Such boluses of Zn(II), termed'Zn(II) sparks'ensue from the release of thousands of Zn(II)-loaded vesicles.54 Remarkably, the size of a Zn(II) spark is positively correlated with propensity
of the oocytes to form blastocysts (i.e., to mature).55 Molecular mechanisms underpinning the roles of Zn(II) in the process of fertilization remain opaque.
The intracellular roles of Zn(II) in signaling are less well understood than those of extracellular mobile Zn(II). Zn(II) has been proposed to be an intracellular second messenger - that is, its release amplifies a primary signal. For example, stimulation of the FcsRI receptor, an immune response protein,
by its ligand, immunoglobulin E, engenders a perinuclear rise in labile Zn(II) levels assessed with the
small-molecule Zn(II) sensor Newport Green.5 6 The physiological implications of this finding remain unclear, but the authors suggest that this released, labile Zn(II) might inhibit phosphatases. This assertion is consistent with data from Maret and coworkers suggesting that physiological concentrations oflabile Zn(II) could inhibit protein tyrosine phosphatases.-<
Conclusions
The foregoing discussion of both the chemistry of Zn(II) and its roles in biology highlights the importance of the ion in humans. The discussion thus far has focused on either isolated proteins or specific cases of Zn(II) function. But, how do cells ensure that Zn(II)-requiring proteins and vesicles obtain and bind the ion? This question, and the limitations of available data regarding its answers are addressed in the subsequent section.
Zn(II) Homeostasis
Overview
Zn(II) homeostasis is a condition in biological systems whereby sufficient, but not excess, Zn(II) is available at the right time and at the right place to enable a physiological process. Despite being accurate, such an abstract definition obscures the attendant complexity of biological homeostasis and belies the distinction between systems-level and molecular-level aspects of Zn(II) homeostasis. In order to address both features, we discuss four points: (i) the Zn(II) content of biological tissues, (ii) the distribution of Zn(II) among proteins6 in human cells, (iii) the molecular players that maintain Zn(II) homeostasis, and (iv) biological systems in which the consequences of perturbed Zn(II) homeostasis are well-defined.
Taken together, these four points will reveal the latent depth of the definition of Zn(II) homeostasis presented above. Moreover, the following discussion emphasizes how little is known regarding each of the four points. I, therefore, advocate several avenues for future work.
Quantitative Descriptions of Zn(II) Content in Different Tissues
Organismal Zn(II) content can be categorized as either labile or bound. Labile Zn(II) is involved in signaling (i.e. NMDA receptor, fertilization, immune response) and bound Zn(II) is Zn(II) stably coordinated to proteins (i.e. zinc fingers, alcohol dehydrogenase, alkaline phosphatase) and other cellular components not discussed.
Labile, loosely bound, Zn(II) concentrations in cells are highly variable within tissues and between cell types. Two key examples highlight this point. First, pancreateic insulin-containing secretory vesicles in beta cells contain millimolar concentrations of Zn(II), whereas the secretory vesicles of glucagon-secreting alpha cells contain low levels of Zn(II).A,"2
Second, glutamate-containing secretory vesicles in some, but not all, neurons similarly contain high concentrations of Zn(II)." Early work regarding both examples suggests that, in these cell types, approximately 20% of cellular Zn(II) is contained within secretory vesicles.46,"
The high concentrations of mobile Zn(II) measured in these secretory cells contrasts with the low nM concentrations of free Zn(II) measured in many cell lines by using ratiometric protein-based sensors (Table 1.1).63,64 Data regarding levels of cellular free Zn(II) are challenging to interpret,
however. First, different sensors directed toward the same subcellular compartment in the same cell line detect different concentrations of free Zn(II) (Table 1.1).64-7 Second, and related to the first point, it remains uncertain what such protein-based Zn(II) sensors actually detect in cells. The proteins certainly respond to Zn(II) in a predictable manner in vitro. But the degree to which the in vitro measured dissociation constant of the protein bears on Zn(II) binding in vivo is an open question.
Zn(II) concentrations are on the order of hundreds of picomolar to nanomolar. These values are of the same order of magnitude as some of the seven dissociation constants for Zn-metallothionein (the protein binds up to seven Zn(II) ions), the Zn(II)-buffering protein in metazoan cells, which could suggest that these values are reasonable approximations of cytosolic free Zn(II) content.
But because labile Zn(II) in many cell lines is on the order of hundreds of picomolar to nanomolar, and total Zn(II) is on the order of hundreds of micromolar, the majority of Zn(II) in cell lines and tissues is not labile. Measurements of total Zn(II), therefore, provide a reasonable estimate for total Zn(II) in many tissues.
Published measurements of murine tissue Zn(II) content are reported in Figure 1.3.785 We attempted to avoid bias in data selection by including values from manuscripts published over a span of
Table 1.1. Measured free Zn(II) concentrations in a subset of subcellular locales and celllines
Organelle Sensor Measured [Zn(l)] Cell Line/Type Citation Ref #
Cytosol ZapCY1 0.9 ± 0.1 pM HeLa Palmer et al. PNAS 2011 66
eZinCh-2 0.44 ± 0.06 nM MCF-7 Merkx et al. Metallomics 2016 67
eZinCh-2 0.65 ± 0.06 nM TamR Merkx et al. Metallomics 2016 67
eZinCh-2 0.87 ± 0.10 nM HeLa Merkx et al. ACS Chem. Biol. 2015 70 eZinCh-2 0.83 ± 0.10 nM HEK293T Merkx et al. ACS Chem. Biol. 2015 70 ZapCY2 75 pM HeLa Palmer et al. ACS Chem. Biol. 2013 68
ZapCY2 65 pM RWPE-1 Palmer et al. ACS Chem. Biol. 2013 68
ZapCY2 110 pM MIN6 Palmer et al. ACS Chem. Biol. 2013 68
ZapCY2 80 pM Neurons Palmer et al. ACS Chem. Biol. 2013 68
eCALWY1-6 400 pM HeLa Merkx et al. Nat. Methods 2009 69
ER ZapCY1 0.9 ± 0.1 pM HeLa Palmer et al. PNAS 2011 66
ER-eCALWY-4 1.18 ± 0.21 nM HeLa Rutter et al. ACS Chem. Biol. 2014 64
eZinCh-2 0.8 ± 0.6 nM HeLa Merkx et al. ACS Chem. Biol. 2015 70
ER-eCALWY-4 1.84 ±0.18 nM HEK293T Rutter et al. ACS Chem. Biol. 2014 64
ER-eCALWY-6 5.58 ± 0.7 nM HEK293T Rutter et al. ACS Chem. Biol. 2014 64
ER-eCALWY-4 1.89 ± 0.28 nM MIN6 Rutter et al. ACS Chem. Biol. 2014 64
ER-eCALWY-4 2.2 ± 0.6 nM human beta cells Rutter et al. ACS Chem. Biol. 2014 64
eZinCh-2 0.54 ± 0.27 nM MCF-7 Merkx et al. Metallomics 2016 67
eZinCh-2 0.75 ± 0.49 nM TamR Merkx et al. Metallomics 2016 67
Golgi ZapCY1 0.6 ± 0.1 nM HeLa Palmer et al. PNAS 2011 66
Mitochondria ER-eCALWY-4 0.3 ±0.04 nM HeLa Rutter et al. ACS Chem. Biol. 2014 64
Mito-ZapCY1 0.22 HeLa Palmer et al. ACS Chem. Biol. 2012 65
Mito-ZifCY1 680 140 nM HeLa Palmer et al. ACS Chem. Biol. 2012 65
ER-eCALWY-4 0.25 0.03 nM HEK293T Rutter et al. A CS Chem. Biol. 2014 64
ER-eCALWY-4 0.25 0.07 nM MIN6 Rutter et al. A CS Chem. Biol. 2014 64
ER-eCALWY-4 0.25 0.03 nM human beta cells Rutter et al. A CS Chem. Bio. 2014 64
2500-W 1000- 750-0 750-0 C. 500 - 0 0 250 -01
Figure 1.3. Zn(II) concentrations in diverse murine tissues. The presented data are aggregated from publications spanning four decades. Data were collected by using inductively-coupled mass
spectrometry or atomic absorption spectroscopy.
approximately 40 years by different laboratories. Only data from mice maintained under normal growth conditions are plotted. In considering these data, it is important to bear in mind the intrinsic differences between mice used in different studies (strain, gender, and age) as well as extrinsic distinctions between mice environments (diet, exercise). The effect each parameter has on organ Zn(II) content is not necessarily well-defined.
Inspection of these data yields two important insights. First, and unsurprisingly different tissues have different Zn(II) content. Second, there is some consistency between measured metal
concentrations among experiments. For instance, liver tissue generally has more Zn(II) than kidney tissue (discounting the measured Zn values greater than 1,000 nmol/g tissue, p < 0.004). Moreover, such values are heuristically useful for the interpretation of data regarding cellular metal content from work in vitro (vide infra). Reliable measures of Zn(II) content of cell samples from tissue culture are typically on the order of 1-10 nmol/mg protein, which is in rough agreement with the above values assuming that tissue is 70-80% water.
Identification of the Roles ofBound Zn(II) in Cells
An important requirement in the definition of Zn(II) homeostasis provided above is, 'the right place.' Therefore, understanding of Zn(II) homeostasis requires identification of the proteins to which Zn(II) binds. Over the last fifteen years, several attempts have been made to identify the members of the so-called Zn(II) proteome. After discussing the experimental challenges attendant to defining the Zn(II) proteome, we highlight three approaches taken to achieve this goal in yeast and metazoa. Subsequently, we provide an alternative perspective on the distribution of Zn(II) in the human
proteome by analyzing the expression of Zn(II) proteins across cell lines by using publicly available RNA-Seq data.
There are at least three challenges to defining the Zn(II) proteome: conceptual, experimental, and technical. The key conceptual question to address is, 'what is the maximum Kdvalue of a protein for
Zn(II) such that it can be classified a member of the Zn(II) proteome?'There may be many low-affinity Zn(II)-binding sites in the human proteome. For instance, zinc-finger-like proteins are encoded in the human genome that lack one of the Zn(II)-binding ligands of canonical Zn(II) fingers." Peptides
corresponding to putative Zn(II)-binding domains of these proteins have dissociation constants for Zn(II) approximately four orders of magnitude greater (i.e., weaker binding affinity) than peptides having 'complete' zinc fingers."Whether such low affinities are sufficient for capturing Zn(II) in cells remains unclear. This uncertainty reflects a more general question regarding how Zn(II)-binding kinetics and thermodynamics interact to result in Zn(II)-loaded proteins in cells.
An adequate answer to the conceptual question must take into account the experimental
question: in what cell line and under what conditions are we interested in defining the Zn(II) proteome? There can be different levels of free Zn(II) at different subcellular locales, and stimuli can result in different fluxes of free Zn(II). Therefore, selection of conditions under which to assess the Zn(II) proteome should be carefully considered.
As an example, consider Zn(II) inhibition of receptor tyrosine phosphatases,5 8 8 7 which are probably not constitutively inhibited. Maret and coworkers have speculated that inhibition of these proteins might be mediated by Zn(II) released from the endoplasmic reticulum - i.e., that inhibition maybe context-dependent.88
A further example of the same is Zn(II) inhibition of caspases. Early work suggested that Zn(II)
inhibited caspase 3, a protease involved in apoptosis, in cell lysates with an ICso of 0.1 M.89 The free
Zn(II) concentrations delineated in Table 1.1 make clear that physiological concentrations of free
Zn(II) would be unlikely to inhibit caspase activity. More recent work in which caspase activity was measured in vitro in the presence of Zn(II) buffers, suggests that Zn(II) inhibits the activity of caspases-3, -6, -7, and -8 at concentrations of Zn(II) close to or below that of cellular free Zn(II).9°
Clearly any measurement of the Zn(II) proteome depends on the instantaneous concentrations of available cellular Zn(II) and must be understood as a snapshot, rather than as a steady-state
description of the cellular Zn(II) proteome.
Finally, there are two technical considerations. First, depending on the protocol used to identify Zn(II)-bound proteins, it might be important that protein-Zn(II) coordination is maintained in cell lysate. However, it is not evident that Zn(II) coordination is maintained in cell lysate. This point has been considered in the context of bacteria." It was found that no general protocol suitably maintains the
in vivo coordination of all Zn(II) ions in lysate, much less all metal ions, in lysate. However, it is certainly
the case that some lysis protocols are superior, on the basis of the degree of Zn(II) association with proteins of different molecular weights, to others.92 Second, even if the protocol used to identify Zn(II)-binding proteins does not require that Zn(II)-Zn(II)-binding be maintained in lysate, difference cell lysis methods will solubilize different proteins." Proteins that are not solubilized would likely not be able to be detected as binding Zn(II).
With these considerations in mind, it is possible to appreciate the most substantive work undertaken to define the Zn(II) proteomes of human cells and S. cerevisiae. A significant advance in understanding the roles that Zn(II) plays in vivo came in 2006 when Rosato and coworkers
computationally identified a set of proteins that likely to bind Zn(II) in human cells." Evidence that these proteins bound Zn(II) was based on their membership in at least two of three classes: (i) a protein family (PFAM)/domain known to bind Zn(II), (ii) the protein data bank (PDB)/sequence similarity to PDB members with deposited structures to which Zn(II) was bound, and (iii) annotated as Zn(II)-binding. Sixteen-hundred proteins met all three criteria, whereas 2800 proteins met two out of the three criteria. The authors concluded that approximately 10% of the human proteome likely binds Zn(II). An interesting point made in the paper is that the largest classes of Zn(II) binding proteins in human cells are theCys2His2andCys4zinc finger proteins. Note that this point is distinct from that regarding which proteins bind the majority of Zn(II) in cells.
Given the computational rather than experimental nature of this manuscript, the conceptual, experimental, and technical considerations discussed above are not explicitly treated. Implicit, however, is the notion that characterized Zn(II) binding sites represent the Zn(II) proteome. This assumption is not necessarily correct. Moreover, this analysis is over a decade old and sequence annotations have been updated and PDB entries added since the release of this manuscript. Probably to partially address both concerns, the metalPDB," which catalogs the coordination chemistry of the PDB, is regularly updated and is maintained by many of the same authors that published this paper in 2006. Other Zn(II)-specific databases are also maintained.9 4
A second critical advance in identification of the human Zn(II) proteome came in 2014 when
Weerapana and coworkers applied mass spectrometry to measure how the labeling of cellular proteins with a cysteine-reactive chemical probe changed upon treatment of with a Zn(II) chelator. The chemical rationale for this approach is that cysteine residues bound to Zn(II) in proteins are less nucleophilic than those that are not bound to Zn(II). Therefore, an increase in reactivity of a particular cysteine residue subsequent to chelation of protein-bound Zn(II) with EDTA or TPEN implies that a given cysteine was bound to Zn(II).