Publisher’s version / Version de l'éditeur:
Vous avez des questions? Nous pouvons vous aider. Pour communiquer directement avec un auteur, consultez la première page de la revue dans laquelle son article a été publié afin de trouver ses coordonnées. Si vous n’arrivez pas à les repérer, communiquez avec nous à [email protected].
Questions? Contact the NRC Publications Archive team at
[email protected]. If you wish to email the authors directly, please see the first page of the publication for their contact information.
https://publications-cnrc.canada.ca/fra/droits
L’accès à ce site Web et l’utilisation de son contenu sont assujettis aux conditions présentées dans le site
LISEZ CES CONDITIONS ATTENTIVEMENT AVANT D’UTILISER CE SITE WEB.
Proceedings of the Events and Stories in the News Workshop, pp. 10-14, 2017-08
READ THESE TERMS AND CONDITIONS CAREFULLY BEFORE USING THIS WEBSITE. https://nrc-publications.canada.ca/eng/copyright
NRC Publications Archive Record / Notice des Archives des publications du CNRC : https://nrc-publications.canada.ca/eng/view/object/?id=1f2bab7a-e823-4833-84ca-a1bcfda8d10a https://publications-cnrc.canada.ca/fra/voir/objet/?id=1f2bab7a-e823-4833-84ca-a1bcfda8d10a
NRC Publications Archive
Archives des publications du CNRC
This publication could be one of several versions: author’s original, accepted manuscript or the publisher’s version. / La version de cette publication peut être l’une des suivantes : la version prépublication de l’auteur, la version acceptée du manuscrit ou la version de l’éditeur.
Access and use of this website and the material on it are subject to the Terms and Conditions set forth at
Detecting changes in twitter streams using temporal clusters of
hashtags
Detecting Changes in Twitter Streams using Temporal Clusters of
Hashtags
Yunli Wang Scientific Data Mining Information & Communication
NRC Canada, Ottawa ON [email protected]
Cyril Goutte
Multilingual Text Processing Information & Communication
NRC Canada, Ottawa, ON [email protected]
Abstract
Detecting events from social media data has important applications in public se-curity, political issues, and public health. Many studies have focused on detecting specific or unspecific events from Twit-ter streams. However, not much attention has been paid to detecting changes, and their impact, in online conversations re-lated to an event. We propose methods for detecting such changes, using cluster-ing of temporal profiles of hashtags, and three change point detection algorithms. The methods were tested on two Twitter datasets: one covering the 2014 Ottawa shooting event, and one covering the Sochi winter Olympics. We compare our ap-proach to a baseline consisting of detect-ing change from raw counts in the conver-sation. We show that our method produces large gains in change detection accuracy on both datasets.
1 Introduction
Widespread data collection from news sources and microblogs has produced massive textual data streams that are challenging to process and ana-lyze. The detection of emerging events from data streams such as Twitter has received growing at-tention from researchers. Many methods focus on detecting specific, “bursty” events such as natu-ral disasters or major political and security crisis (Farzindar and Khreich,2015), relying mostly on linguistic features (Sakaki et al.,2010). For detect-ing unspecific events, many approaches rely on ap-plying clustering (Farzindar and Khreich,2015) to temporal characteristics of tweets (Mathioudakis and Koudas,2010). For example,Cordeiro(2012)
used hashtag peaks for unsupervised event detec-tion.
Relatively little attention has been paid to de-tecting changes during events. Guralnik and Sri-vastava(1999) formulate the event detection prob-lem from time series of sensor data as a change
point detection problem. Change point detection (CPD) is the problem of detecting point where the underlying distribution changes in time series data. Several statistical models have been pro-posed to detect change points, such as Bayesian change point detection (bcp,Erdman and Emer-son, 2007), E-Divisive change point detection (ecp, James and Matteson, 2015), or breakout detection (James et al., 2014). These methods use parametric (Wang and Emerson, 2015) or nonparametric statistical models, and are usually tested on time series of "counts", i.e. frequency of some feature or measurement.
We propose a novel method for detecting changes in document streams by combining the clustering of temporal profiles of hashtags with multivariate change point detection algorithms. The temporal profile clusters separate major events from unrelated events, while multivariate CPD is able to identify time points were impor-tant changes occurred in major events. We test our method on two datasets from Twitter, evaluate the performance of different CPD algorithms and the influence of several design choices.
2 Methods
Our method is based on the assumption that hash-tags with similar temporal profiles are related to the same event or sub-event1 within a document stream. In order to model that, we first build temporal profiles by counting the occurrences of
1We talk about sub-events here to refer to smaller events occurring within a larger event, e.g. a glitch happening within the opening ceremony at the Olympics.
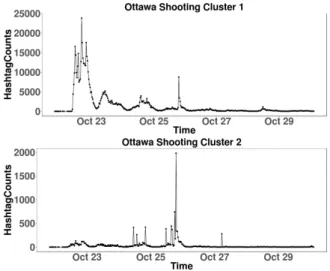
each hashtag at each time interval. We then ter the temporal profiles using hierarchical clus-tering. Each cluster represents a group of hash-tags with similar temporal profiles, which we as-sume describe the same (sub-)events. We then build the temporal profiles of all clusters and in-put those into multivariate change point detection algorithms, in order to extract the locations where significant changes occur in the temporal profiles. The underlying assumption is that when some-thing significant occurs, it will produce changes in some temporal profiles of clusters that are re-lated to that sub-event. For example, in Fig.1, we see that a sub-event late in Oct. 25 has produced a large impact on the profiles of both clusters. In earlier days, some sub-events have an impact of the profile for Cluster 1, but not for Cluster 2, for example on Oct 23rd, as Canadian prime minister lay a wreath in memory of the victim at the War Memorial.
There are two steps in our method: building hashtag temporal profiles and detecting change points from hashtag temporal profiles. The first step is described in Algorithm 1:
Algorithm 1: Hashtag profiles and clusters Data: List of hashtags with time stamps Parameters: Time interval I, #clusters C Result: C hashtag clusters, with temporal
profiles
Generate K × M hashtag-profile matrix by counting frequency of hashtags per interval; Compute K × K hashtag similarity using
Pearson correlation on hashtag profiles; Run hierarchical clustering using the K × K
hashtag similarity matrix
Cut the resulting hierarchy at C clusters. In the second step, each cluster resulting from Algorithm 1 is a subset of the K hashtags we started with. For each of the C clusters, we build the temporal profile obtained from the frequency of all hashtags from that cluster at each time inter-val (e.g. Fig.1). We use these temporal profiles as C time series on which we run multivariate change point detection algorithms bcp and ecp.2 The single parameter used for change point detection is the number of change point locations to extract from the multivariate signal.
bcp implements the Bayesian change point
2From the R packages bcp and ecp.
analysis ofBarry and Hartigan(1993). It assumes that each block between two change points arises from a (multivariate) normal distribution, and out-puts the posterior probability that a change point occurred at each time in the series. ecp uses a nonparametric, hierarchical divisive estimation method. E-Divisive estimates change points itera-tively, by recursively dividing an existing segment using a divergence measure that estimates whether two random vectors are identically distributed. Al-though ecp can be used for univariate and multi-variate time series without a priori knowledge of the number of change points, our experience is that it works better when a target number of change points is provided.
In order to evaluate the influence of the hash-tag clusters, we also compare our method to change points directly detected from raw tweet counts. As this is a univariate time series, we test one additional CPD algorithm implemented in the R package breakout, which uses a robust
E-divisive with mediansalgorithm to detect signifi-cant changes in data distribution.
3 Experiments 3.1 Datasets
We collected two datasets from the Twitter API. The Ottawa Shooting data was obtained by query-ing keywords like “Ottawa”, "parliament shoot-ing", "#CanadaStrong", "Zehaf-Bibeau" etc. dur-ing the period of Oct. 21st to Oct. 30th, 2014 and contains 694,017 tweets. Reference subevents to evaluate the detected change points for the Ot-tawa shooting data were collected from Macleans News3 and include 32 change points. This small dataset is challenging because the number of both messages and subevents decreases sharply with time.
The Olympics dataset was collected during the Sochi 2014 winter Olympics during February 6th (opening ceremony) to 24th (closing ceremony) 2014 and contains 5,914,616 tweets. The refer-ence subevents were collected from Wikipedia.4 For our gold standard, we only included the final competitions in each discipline. More events (Quarterfinals, Semifinals, Bronze and Gold medal games) were included for Ice Hockey because they attracted more media attention. In
3
http://www.macleans.ca/news/canada/interactive-timeline-what-happened-in-ottawa/
4https://en.wikipedia.org/wiki/2014_Winter_Olympics
total, our gold standard contains 89 change points. 3.2 Evaluation
The performance of change point detection was evaluated against reference subevents using pre-cision, recall and F-score (Goutte and Gaussier,
2005). A detected change point at time t is evalu-ated correct if there exists a reference change point between t and t+∆t, where ∆t is a tolerance time window. We usually set ∆t to a small multiplier of the time interval I used in the preprocessing. For Ottawa Shooting, I = 30min and ∆t = 1h, while for the Olympics, I = 1h and ∆t = 2h. To avoid duplication, we only consider one true detected change point if several detected change points fall in the same time window.
4 Results
We first show temporal profiles resulting from the hashtag clusters, we then evaluate the performance of our technique versus a few alternatives, and fi-nally, we show the impact of design parameters. The number of clusters C is set to 10 in Ottawa shooting and 20 in the Olympics datasets. bcp uses all default parameter settings, returning the change points with highest posterior probability. ecpuses divisive hierarchical estimation with all default settings. The target number of change points is 30 for Ottawa Shooting and 90 for the Olympics data. breakout uses all default set-tings, picking the number of detected changes au-tomatically.
4.1 Temporal Profile Clusters
Figure1shows the temporal profile of two clusters obtained from the Ottawa Shooting dataset. They clearly cover events from the first four days (Oct. 22–25) in different ways: Cluster 1 corresponds to the major shooting at the war memorial and par-liament on Oct. 22, plus subsequent subevents on Oct. 23–25. Cluster 2 focuses on the victim, with small spikes on Oct. 24 when an official motor-cade transported his body back to Hamilton, ON and a large peak on Oct. 25, when pre-game cere-monies were jointly held in Ottawa, Montreal, and Toronto to honour the deceased and first respon-ders. This main peak in cluster 2 also appears in cluster 1 and is more localized than activities ap-parent in other days. This shows that hashtag clus-ters are able to capture documents related to dif-ferent subevents in the collection.
Figure 1: Temporal profiles for the two largest hashtag clusters for the Ottawa shooting data.
4.2 Change Points Results
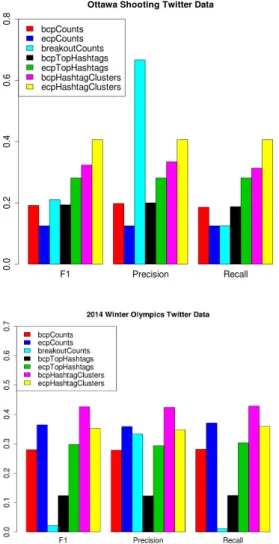
We evaluate the performance of our change de-tection methods on both datasets and benchmark against two alternatives: running CPD on raw message counts (*Counts in Fig. 2), and running bcp or ecp on temporal profiles of the hashtags with highest volumes (*TopHashtags). Figure 2
shows that the change points detected from the temporal profiles of hashtag clusters (magenta and yellow bars) outperform those detected from ei-ther top hashtags or raw counts. On the Olympics dataset, ecp yields the same performance on raw counts as on hashtag clusters. The performance of breakout detection on raw counts varies greatly but clearly favours precision at the expense of re-call. This suggests that it under-detects changes; unfortunately breakout does not allow to tune the number of change points detected to increase recall.
The fact that the performance of change point detection from hashtag cluster temporal profiles is higher than from a corresponding number of pro-files of top hashtags suggests that the use of clus-ters is able to catch changes that are not appar-ent from the profile of large volume hashtags, but are reflected in clusters corresponding to signifi-cantly different patterns with lower volumes. This allows our proposed method to pick up weaker sig-nals on time series from smaller clusters, instead of relying on the main, high-volume signals. An-other situation where cluster profiles are useful is to handle the appearance of new hashtags after the main events. In the Ottawa Shooting dataset, for
Figure 2: Performance of change detection from raw counts, top hashtags, and hashtag cluster tem-poral profiles on the Ottawa shooting (top) and Olympics (bottom) datasets.
example, hashtags #OttawaStrong and #CanadaS-trong have high volume throughout the dataset and appear in cluster 1; other hashtags appear later, once the shooter (#ZehafBibeau) or victim (#Cpl-Cirillo) are identified, or when specific subevents unfold (#highwayofheroes, during the official mo-torcade on Oct. 24). Later hashtags are captured in different clusters with specific temporal profiles.
These results also show the benefits of using a multivariate change detection method, as opposed to a univariate method. Although breakout can efficiently identify breakouts in some univariate time series settings, the ability of bcp and ecp to handle multiple time series with different charac-teristics at the same time provides significant ben-efits on both datasets.
Figure 3: F-score for different numbers of clusters, on the Ottawa Shooting dataset.
4.3 Parameter Analysis
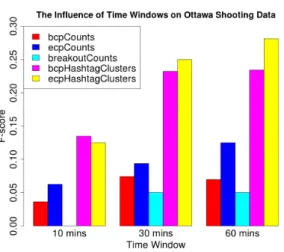
We investigate the impact of a few design parame-ters on our method’s performance: the number of clusters, the time window used for evaluation, and the time interval. Figure3shows that performance is fairly stable across a range of cluster numbers. There is a small increase at C = 20 for ecp, and a slow decrease for bcp when C increases. Fig-ure4 shows that performance increases regularly with larger time windows ∆t. This is expected, as increasing the time window systematically in-creases the number of reference events detected. Note that we use I = 5min. as time interval (in-stead of 30min in Figs. 1-3) so that we can more easily increase ∆t. As a consequence, we also ob-serve that performance is lower using this smaller time interval. This may be due to the increase is noise when counts are accumulated over a smaller time interval.
5 Discussion
In our work, we used different off-the-shelf changepoint detection algorithms in order to il-lustrate the benefits of using hashtag cluster pro-files rather than raw counts. Theses different algo-rithms have different underlying assumptions, but both improve greatly when applied to multivari-ate temporal profiles. We could use different CPD methods. Our ongoing work actually focuses on developping an online variant that detects changes as events unfold rather that wait for a posteriori processing. A related point is that it is important to perform CPD on multivariate series as differ-ent clusters may represdiffer-ent differdiffer-ent aspects of the
Figure 4: F-score for various time windows, with 5 min. time interval (Ottawa Shooting dataset).
data, and changes may be apparent in some pro-files but not all, and be drowned when a single, global count is used.
Our method focuses on detecting sub-events us-ing temporal profiles of hashtag clusters. As both datasets used here were acquired using query key-words, so most tweets in each dataset are related to the same events. The noise in these datasets is much lower than the real-time twitter stream. When focusing on specific events, we can filter the stream using a number of specific keywords. For unsupervised event detection, methods such as hashtag peaks (Cordeiro,2012) can be used as pre-processing before applying our method.
6 Conclusions
We proposed a novel method for detecting changes related to sub-events in a Twitter stream, using temporal profiles from hashtag clusters. This is a combination of exploratory data analysis with quantitative data analysis. Clusters of hashtags identify a number of subevents within a ma-jor event, yielding distinctive temporal profiles. These temporal profiles can be visualized as an ex-ploratory analysis of the message stream. They can also be used further downstream and com-bined with change point detection method in or-der to provide insight into significant changes in the stream. Our experiments on two datasets ac-quired from Twitter show that change points de-tected by our method identify up to 40% of refer-ence subevents in these datasets, and clearly out-perform the use of raw message or hashtag counts.
References
D. Barry and J.A. Hartigan. 1993. A bayesian analysis for change point problems. Journal of the American
Statistical Association35(3):309–319.
Mário Cordeiro. 2012. Twitter event detection: com-bining wavelet analysis and topic inference summa-rization. In Doctoral Symposium on Informatics
En-gineering DSIE. volume 8, pages 11–16.
Chandra Erdman and John Emerson. 2007. bcp:
An R package for performing a bayesian
analysis of change point problems.
Jour-nal of Statistical Software 23(1):1–13.
https://doi.org/10.18637/jss.v023.i03.
Atefeh Farzindar and Wael Khreich. 2015. A
survey of techniques for event detection
in twitter. Comput. Intell. 31(1):132–164.
https://doi.org/10.1111/coin.12017.
Cyril Goutte and Eric Gaussier. 2005. A proba-bilistic interpretation of precision, recall and
f-score, with implication for evaluation. In D.E.
Losada and J.M. Fernandez-Luna, editors,
Ad-vances in Information Retrieval - 27th Euro-pean Conference on IR Research. pages 345–359.
http://dx.doi.org/10.1007/978-3-540-31865-1_25.
Valery Guralnik and Jaideep Srivastava. 1999. Event
detection from time series data. In Proceedings
of the Fifth ACM SIGKDD International Confer-ence on Knowledge Discovery and Data Mining. ACM, New York, NY, USA, KDD ’99, pages 33– 42.https://doi.org/10.1145/312129.312190. Nicholas A. James, Arun Kejariwal, and David S.
Matteson. 2014. Leveraging cloud data to miti-gate user experience from "breaking bad". eprint
arXiv:1411.7955.
Nicholas A. James and David Matteson. 2015.
ecp: An R package for nonparametric
multi-ple change point analysis of multivariate data.
Journal of Statistical Software 62(1):1–25.
https://doi.org/10.18637/jss.v062.i07.
Michael Mathioudakis and Nick Koudas. 2010. Twit-termonitor: Trend detection over the twitter stream. In Proceedings of the 2010 ACM SIGMOD
Interna-tional Conference on Management of Data. ACM, New York, NY, USA, SIGMOD ’10, pages 1155– 1158.https://doi.org/10.1145/1807167.1807306. Takeshi Sakaki, Makoto Okazaki, and Yutaka
Matsuo. 2010. Earthquake shakes twitter
users: Real-time event detection by social
sen-sors. In Proceedings of the 19th International
Conference on World Wide Web. ACM, New York, NY, USA, WWW ’10, pages 851–860.
https://doi.org/10.1145/1772690.1772777.
Xiaofei Wang and John W. Emerson. 2015. Bayesian change point analysis of linear models on graphs.