Publisher’s version / Version de l'éditeur:
Questions? Contact the NRC Publications Archive team at
PublicationsArchive-ArchivesPublications@nrc-cnrc.gc.ca. If you wish to email the authors directly, please see the first page of the publication for their contact information.
https://publications-cnrc.canada.ca/fra/droits
L’accès à ce site Web et l’utilisation de son contenu sont assujettis aux conditions présentées dans le site LISEZ CES CONDITIONS ATTENTIVEMENT AVANT D’UTILISER CE SITE WEB.
Building Science Insight 2006/07 - Sustainable Infrastructure: Techniques, Tools
& Guidelines [Proceedings], 2006-08-28
READ THESE TERMS AND CONDITIONS CAREFULLY BEFORE USING THIS WEBSITE.
https://nrc-publications.canada.ca/eng/copyright
NRC Publications Archive Record / Notice des Archives des publications du CNRC :
https://nrc-publications.canada.ca/eng/view/object/?id=54355bca-e7cc-474f-ba1e-37ae18a73461 https://publications-cnrc.canada.ca/fra/voir/objet/?id=54355bca-e7cc-474f-ba1e-37ae18a73461
NRC Publications Archive
Archives des publications du CNRC
This publication could be one of several versions: author’s original, accepted manuscript or the publisher’s version. / La version de cette publication peut être l’une des suivantes : la version prépublication de l’auteur, la version acceptée du manuscrit ou la version de l’éditeur.
Access and use of this website and the material on it are subject to the Terms and Conditions set forth at
A holistic modelling approach to predict the effects of aging pipes on
water quality in distribution systems
http://irc.nrc-cnrc.gc.ca
A H olist ic M ode lling Approa ch
t o Pre dic t t he Effe c t s of Age ing
Pipe s on Wat e r Qua lit y in
Dist ribut ion Syst e m s
N R C C - 4 8 6 8 4
R e h a n S a d i q , Y e h u d a K l e i n e r , a n d B a l v a n t
R a j a n i
S e p t e m b e r 2 0 0 6
Building Science Insight 2006
Sustainable Infrastructure: Techniques, Tools and Guidelines Building Science Insight 2006
A Holistic Modelling Approach to Predict the Effects of Ageing Pipes on Water Quality
in Distribution Systems
Rehan Sadiq1, Yehuda Kleiner, and Balvant Rajani
Urban Infrastructure Program Institute for Research in Construction
National Research Council Canada, Ottawa, Ontario, K1A 0R6 Canada
Abstract: Prioritization of water mains for renewal requires the simultaneous consideration of their structural integrity and hydraulic performance as well as their contribution to the deterioration of water quality. Generally, the impact of deteriorating pipes on water quality in the distribution network has not been taken into account in the decision-making process. To address this issue, the National Research Council of Canada (NRC) and American Water Works Association Research Foundation (AwwaRF) embarked on a 4-year research project (FY 2003-2007) to investigate the effects of aging water mains on water quality in distribution networks.
Numerous factors affect water quality in the distribution network and interactions amongst them are complex and often not well understood. Water quality failures in distribution networks are scarce, which make statistically significant generalizations difficult. However, the rarity of water quality failures belies their seriousness, since each failure indicates the potential for harmful public health effects and increased public mistrust and complaints. In such data-sparse circumstances, expert knowledge and judgment can serve as a supplemental or even an alternative source of information.
At the NRC we have developed a soft computing-based model to predict water quality failures in
distribution network. The model can incorporate uncertain, subjective/ linguistic and/ or incomplete data. The proposed model is based on an approach, called fuzzy cognitive map (FCM), which is a plausible way to represent and comprehend ill-defined and complex relationships that govern water quality in the
distribution network. This paper provides a brief overview of the methodology and the approach
developed in this research. Technical details have been published or submitted elsewhere in the refereed journals as well as international conferences.
Key words: Water quality (WQ), distribution networks, ageing water mains, soft computing, and fuzzy cognitive maps.
1
1.
Introduction - Water Quality Deterioration MechanismsWater quality is generally defined by a collection of upper and lower limits on selected performance indicators (Maier 1999). Therefore, a water quality failure (WQF) is referred to an exceedance of one or more water quality indicators from specific regulations, or in the absence of regulations, exceedance of guidelines or self-imposed limits driven by customer service needs (Sadiq et al. 2004).
A typical modern water supply is a complex system that comprises water source(s), treatment plant(s), transmission mains, and the water distribution network, which includes pipes, pumps and distribution tanks. While water quality (WQ) can be compromised at any component, failure at the distribution level can be critical because it is the closest to the point of delivery and, with the exception of rare filter devices at the consumer level, there are virtually no safety barriers before consumption. In this paper, the terms water distribution systems and networks are used interchangeably.
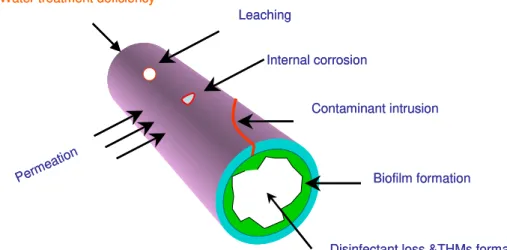
Water quality failures that compromise either the safety or the aesthetics of water in distribution networks, can generally be caused by following deterioration mechanisms (Kleiner 1998) (Figure 1):
• Intrusion of contaminants into the distribution network through system components whose integrity is compromised or through misuse or cross-connection or intentional introduction of harmful substances in the water distribution network,
• Corrosion byproducts and leaching of chemicals from system components,
• Regrowth of microorganisms and formation of biofilm in the distribution networks,
• Formation of disinfection byproducts (e.g., THMs) and disinfectant loss in the distribution networks, • Permeation of organic compounds from the soil through system components into the water supplies,
and
• Microbial and/or chemical breakthrough due to deficiency in water treatment.
Permeat ion
Contaminant intrusion Leaching
Biofilm formation
Water treatment deficiency
Disinfectant loss &THMs formation Internal corrosion Permeat ion Contaminant intrusion Leaching Biofilm formation
Water treatment deficiency
Disinfectant loss &THMs formation Internal corrosion
Figure 1. Water quality (WQ) deterioration mechanisms
Intrusion of contaminants in the water distribution system can occur through pipes and storage tanks. Open finished water reservoirs are susceptible to microbial contamination from external non-point sources
such as feces of infected animals (e.g., beaver, squirrels and rabbits, within the watershed).
Microorganisms can be introduced into open reservoirs from windblown dust, debris, and algae. Organic matter (leaves and pollens) is also of concern in open storage tanks (Kirmeyer et al. 2001). Finished water can also be affected in covered facilities by airborne microorganisms entering through access hatches, overflow pipes and vents, roofs and side walls (Kirmeyer et al. 2001). Microorganisms can also be introduced into ground level storage through surface water (flooding) or groundwater infiltration. Bird droppings are commonly found in storage facilities with floating covers (Clark et al. 1997).
Intrusion of contaminants through water mains may occur during maintenance and repair events, through broken pipes and gaskets, and through cross connections. A broken gasket that seals pipe joints can be a pathway for variety heterotrophic bacteria in the distribution network (Geldreich 1990). Regular
maintenance and repair events as well as other anthropological and natural disasters may cause intrusion of contaminants in the water distribution network.
Cross connections (a physical connection between a potable and a non-potable water system), when unprotected, can potentially introduce substances that may compromise the quality of potable water. Backflow from cross connections may occur when the pressure inside the water main is less than the pressure at the entry point. This can happen when a water main breaks and is de-pressurized for breakage repair, or when peak or fire demands occur, or when a non-potable pressurized system is connected to the potable water system without backflow protection (Kirmeyer et al. 2001). Contamination events can also occur as a result of transient pressures in the distribution system, where negative or low pressures cause backflow into distribution mains.
Red water is one the most common indicators of water quality failure although the peril is loss of aesthetics rather than health. The corrosion of metallic pipes and plumbing devices increases the
concentration of metal compounds in the water. Different metals go through different corrosion processes, but in general low pH water, high dissolved oxygen, high temperature, and high levels of dissolved solids increase corrosion rates. Heavy metals such as lead and cadmium may also leach into the water from the pipe materials. Secondary metals such as copper (from home plumbing), iron (distribution pipes) and zinc (galvanized pipes) may leach into water and cause taste, odour and colour problems in addition to minor health related risks (Kleiner 1998). Contamination of water by compounds leached from pipe liners (plastic and epoxy lining) has also been observed. Aschengrau et al. (1993) have explored the exposure of perchloroethylene (PCE) to human population and linked it to occurrence of cancer cases.
Biofilm is defined as a deposit consisting of microorganisms, microbial products and detritus at the surface of pipes or tanks. Biological regrowth occurs when injured bacteria pass from the treatment plant into the distribution system and subsequently rejuvenate and grow in storage tank, and water mains. The regrowth of organisms in the distribution system increases chlorine demand of the system, thus reducing the level of free chlorine, which may hinder the system’s ability to contend with local occurrences of contamination (US EPA 1999).
Disinfection is the primary method to inactivate pathogens. Chlorine has been highly successful in reducing the incidences of waterborne infections in human beings but other concerns have been raised in the last three decades about the safety of the disinfected water. Harmful disinfection by-products (DBPs) are formed in the presence of natural organic matter (NOM) and bromide (from the source) during chlorination. Other commonly used disinfectants are chloramines (combined chlorine), chlorine di-oxide and ozone. These disinfectants have different levels of effectiveness against disease causing pathogens. Ozone reacts with NOM and produces aldehydes, ketones and inorganic by-products. Ozone and chlorine dioxide in the presence of bromide ion produce bromate, chlorate and chlorite, respectively, which may have adverse human health effects (US EPA 1999).
Permeation is a phenomenon in which contaminants migrate through the pipe wall. Three stages are involved in physico-chemical process of permeation: (a) organic chemicals present in the soil partition between the soil and plastic wall, (b) the chemicals defuse through the pipe wall, and (c) the chemicals partition between the pipe wall and the water inside the pipe (Kleiner 1998). Holsen et al. (1991) reported that most of the permeation events occur where the soil is contaminated with hydrocarbons such as gasoline, diesel fuel, or solvents. Thompson and Jenkins (1987) reported that polyethylene pipes are potentially susceptible to permeation of non-polar organic compounds. Similarly, all elastomeric and thermo-plastic materials are prone to permeation. In general, the risk of contamination through permeation is relatively small compared to other mechanisms.
Water quality failures attributed to above-listed WQ deterioration mechanisms, with the exception of water treatment deficiency, are closely related to ageing water mains in the distribution system. The manifestation of deteriorating (ageing) water distribution networks include the increased frequency of leaks and breaks, taste and odour and red water complaints, reduced hydraulic capacity, increased disinfectant demands (due to the presence of corrosion byproducts, biofilms and regrowth). The US EPA (2006) published a series of white papers on this topic, which are available on website
http://www.epa.gov/safewater/tcr/tcr.html.
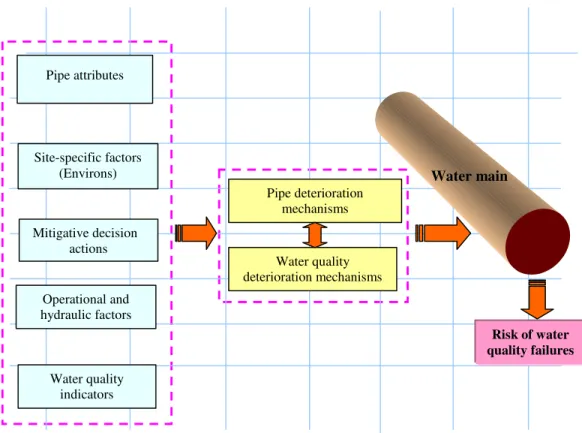
The quality of water in the distribution network is typically in continuous flux. Changes occur due to a variety of physical, microbiological and physico-chemical processes. Considerable past research has focused on modelling the multiple interactions occurring in the distribution network, but these processes are quite complex and are often not fully understood. These WQ deterioration mechanisms can be associated with factors like pipe attributes (e.g., pipe age, type of pipe and lining material), operational and hydraulic factors (velocity, pressure, water residence time), environs (e.g., soil type, contamination distance) and decision actions (e.g., flushing, cathodic protection) (Figure 2).
Water quality indicators Site-specific factors (Environs) Operational and hydraulic factors Mitigative decision actions Pipe attributes Risk of water quality failures Pipe deterioration mechanisms Water quality deterioration mechanisms Water main
This paper is organized into 5 sections. The next section briefly describes the state-of-the art techniques/ methods/ approaches employed for water quality modelling in distribution systems. Section 3 explains the basic concepts of the complex modelling approach employed in this research. Section 4 discusses the proposed model developed in this research. Finally, summary and conclusions are provided in Section 5.
2. Predictive Models for Water Quality
Although research on water quality modelling in distribution networks started appearing in the literature in early 1970s, it gained a significant awareness only in the last 10-15 years due to the rapid evolution in affordable computing power and new mathematical computing techniques/methods. The effective use of properly calibrated models helps to address various issues that contribute, directly or indirectly, to water quality in the distribution network. Such models help to establish WQ monitoring protocols, maintain WQ in the distribution network through improved design and operations, and improve decision-making processes to replace/ renew deteriorated pipes. The WQ models may improve understanding of WQ changes occurring in the distribution system, which help water utilities to make better decisions for the up-gradation of treatment processes and practices, and generate operational and water quality data for
epidemiological studies (Rodriguez et al. 2000).
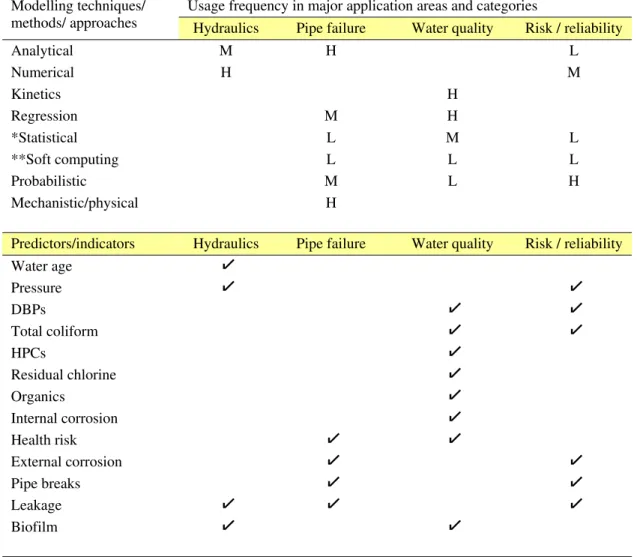
Table 1 provides a summary of techniques/ methods/ approaches used directly or indirectly for water quality modelling in distribution networks. This summary is two-tiered; first the table lists the major application areas (hydraulics, pipe failure, water quality and risk/reliability) and provides the relative usage frequency (low, medium, high) of each method/technique in each major application area. Second, the table identifies common predictors that are generally used as indicators in each application area. This table is meant to be suggestive rather than definitive.
A major limitation of existing approaches is that interactions among various factors (attributes) are generally not taken into account (i.e., factors are assumed independent), and that the combined effect of various layers of these attributes (for an estimate of “risk”) is often assumed to be additive (linear). In general, these two assumptions are common in modelling literature. In addition, the existing approaches handle aleatory (variability) and epistemic (ignorance) uncertainties associated with data and models cursorily. These limitations are the main motives behind this research.
3. Modelling Complex Systems
Most water distribution systems have only limited water quality failures each year, making statistically significant generalizations difficult. The rarity of water quality failures belies their seriousness, as each failure indicates the potential for harmful public health effects and increased public mistrust and complaints. In such data-sparse circumstances, expert knowledge and belief can serve as a supplementary and even an alternative source of information.
The level of uncertainty associated with a system is proportional to its complexity, which arises as a result of vaguely known (if any) relationships among various entities, and randomness in the mechanisms governing the domain. Complex systems consist of a large number of interacting entities that may be designated as subsystems, concepts, agents or components. Complex systems are highly non-linear in behaviour and are often sub-additive or super-additive (Ross 2004). The modelling of complex dynamic systems requires methods that combine human knowledge and experience as well as expert judgment. ‘Soft computing’ techniques which includes fuzzy logic, probabilistic & evidential reasoning, and fuzzy measure theory provide an appropriate platform framework to model complex systems with the help of human knowledge and /or available data (Makropoulos and Butler 2004).
Table 1. Summary of techniques and methods used in water quality modelling arena
Usage frequency in major application areas and categories Modelling techniques/
methods/ approaches Hydraulics Pipe failure Water quality Risk / reliability
Analytical M H L Numerical H M Kinetics H Regression M H *Statistical L M L **Soft computing L L L Probabilistic M L H Mechanistic/physical H
Predictors/indicators Hydraulics Pipe failure Water quality Risk / reliability
Water age ! Pressure ! ! DBPs ! ! Total coliform ! ! HPCs ! Residual chlorine ! Organics ! Internal corrosion ! Health risk ! ! External corrosion ! ! Pipe breaks ! ! Leakage ! ! ! Biofilm ! !
*other statistical methods than regression; ** artificial neural network (ANN), fuzzy logic, evidential reasoning etc. L = low; M = medium; H = high
3.1. Fuzzy cognitive maps
Fuzzy cognitive maps (FCM), an extension of cognitive maps, are illustrative causative representations of complex systems (Kosko 1997). FCM draws a causal representation among all identified factors or concepts of any specific system. FCM is interactive in the sense that all factors interact with each other dynamically. A complex system represented by FCM can incorporate human experience, judgment, understanding and knowledge of the system.
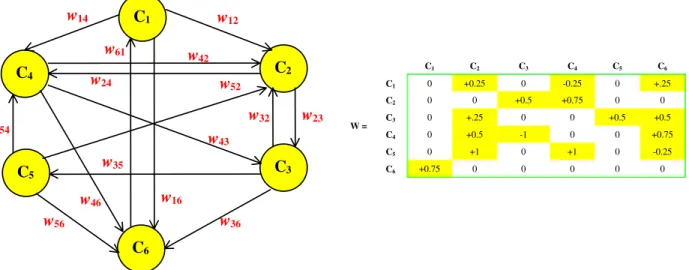
FCM consists of nodes, representing factors or concepts that are elements of the system and are weighted by arcs, connections and edges, representing causal relationships between nodes. Arcs are graphically illustrated as signed weighted graphs with optional feedback loops. Concepts (nodes) can be inputs, outputs, variables, states, events, actions, goals, and trends of the system (Figure 3).
A. Fuzzy cognitive map involving 6 concepts B. Adjacency matrix representing causal relationships
Initial state ⇒ A0 = [0, 0, 1, 0, 0, 0]; at t = 0
Final state at equilibrium ⇒ A7 = [0.63, 0.76, 0.42, 0.72, 0.55, 0.68]; at t = 7
C. Triggering concept C3 and estimating the effect on other concepts
C1 C2 C3 C5 C6 C4 w14 w54 w12 w56 w36 w23 w32 w24 w 52 w43 w16 w46 w35 w42 w61 C1 C2 C3 C4 C5 C6 C1 0 +0.25 0 -0.25 0 +.25 C2 0 0 +0.5 +0.75 0 0 C3 0 +.25 0 0 +0.5 +0.5 C4 0 +0.5 -1 0 0 +0.75 C5 0 +1 0 +1 0 -0.25 W = C6 +0.75 0 0 0 0 0 0.42 0.63 0 0.76 1 0.72 0.55 0.68 0.0 0.2 0.4 0.6 0.8 1.0 0 1 2 3 4 5 6 7 t A C1 C2 C3 C4 C5 C6
Figure 3. Fuzzy cognitive map
Kosko (1997) proposed an inference method to calculate the value of each concept (node) based on the influence of interconnected concepts:
1 0 1 0 1 2 1 1 2 1 1 ⎟ ≤ ≤ ≤ ≤ ⎟ ⎠ ⎞ ⎜ ⎜ ⎝ ⎛ ∑ • + • = ≠ = − − i j n j i i t j j ij t i i t j f k A w k A k k A (1)
where wij ∈ [-1, 1] represents causal relationship between concept i and concept j (negative value for wij
represents inverse causation). Atj is the normalized (A t
j ∈ [0, 1]) value (a.k.a. activation level) of concept
Cj at time step (iteration) t, and f(⋅) is known as the threshold function. Generally, a sigmoid function
( )
x e x f −β + = 1 1is used to constrain the value of f (.) in the interval [0, 1], where β > 0 represents the steepness of f (.). The coefficient ki1 expresses the influence of interconnected concepts in the configuration of the new value of concept Ai. Similarly, k
j
2 accounts for the importance of a concept itself being at its activation level in the previous time step. The selection of coefficients ki1 and k
j
2 depends on the nature and type of each concept, and may naturally differ from concept to concept.
Inferencing in FCMs is performed using matrix operations instead of explicit if-then rules found in traditional expert systems. The FCM is a process model, which can use knowledge of expert opinion and belief (qualitative, soft) and/or existing (quantitative, hard) data. It is possible that the knowledge from these sources may contradict or differ in terms of describing concepts and expressing causal relationships. The conflicting information from various FCMs can be combined to form one single FCM using weighted averaging method, which takes into account the opinions of different experts in the final assessment. Following are three major limitations of conventional FCMs:
(a) A constant relationship (represented by wij) between two concepts. Traditional FCMs do not allow
these relationships to be dynamically modified, as is the case in real life. Khan and Khor (2004) proposed fuzzy rules to describe causal relationships. A discussion on this subject is provided in the next section.
(b) Lack of a temporal dimension. This limitation can be overcome by the usage of dynamic cognitive networks (DCNs), which are an extension to FCM (Miao et al. 2001). In this framework, the dynamic weights are a function of the state value of the cause concept Ci and time. This limitation of FCMs is
not addressed in this research.
(c) FCMs cannot handle a process in which the co-occurrence of multiple causes (such as expressed by “AND” conditions) is required to trigger a single effect concept. This limitation can be overcome by introducing into the FCM ‘dummy nodes’, which are in fact intermediate concepts receiving input from the concurrent concepts and triggering the effect concept. The inference can be obtained using fuzzy rule-based model (FRBM) and/or the fuzzy measures theory (FMT). Details of these two inference methods are discussed in following sections.
3.2. Fuzzy rule-based models (FRBM)
Fuzzy logic helps to address the inherent deficiencies of binary logic to account for uncertainties. Fuzzy rule-based models (FRBM) can be used to make inference in FCMs either through the use of aggregation (weighting) of single-input-single-output (SISO) or through multiple-inputs-single-output (MISO) fuzzy models. Inference through SISO model cannot capture effectively the co-occurrence of multiple causes such as “if x1and x2then ”. On the other hand, MISO models, which can capture co-occurrence of multiple causes, can also become extremely complex because of dimensionality issues. However, by introducing dummy nodes this dimensionality can be reduced. A fuzzy rule-based model, as described by Zadeh (1973), contains following features:
y
• Linguistic variables instead of, or in addition to numerical variables;
• Relationships between the variables in terms of IF-THEN rules (fuzzy rule-base);
• An inference mechanism that uses approximate reasoning algorithms to formulate relationships; and • A defuzzification method to obtain crisp output.
A linguistic variable can be regarded as a variable whose value is a fuzzy number A=
{
x,μ
(x)}
. It describes the relationship between an uncertain quantity x and a membership functionμ
(x
)
, where] 1 , 0 [ ) (x ∈
Old}, a 35 year old may be defined as having, say, a 0.6 membership to “Young” and 0.4 membership to “Middle age” group.
A rule base determines the relationships between the inputs and outputs of a system using linguistic
antecedent and consequent propositions in a set of IF-THEN rules. The fuzzy rule base of a multi-input
single-output (MISO) system may be formulated in a set of IF-THEN rules as follows:
i
R : IF x1is low ANDx2is medium AND … is low THEN is low, xj y
i
=
1
,
Κ
,
n
(2)where
R
i represents the i thrule, n is the total number of rules, xj (j=1,Κ,r)are the input variables,
y
is the output variable, both input and output universe spaces are partitioned by linguistic constants like “low”, “medium”, “Old” etc. For example, if a student is “Smart” and a student is “Motivated” the student’s grades will be “High”. The rule base of a complex system usually requires a large number of rules to describe the behaviour of a system for all possible values of the input variables. The aggregation of the rules in Eq. 2 yields,Υn i i R R 1 = =
= R1 ALSO R2 ALSO … ALSO Rn (3)
Fuzzy inference mechanisms are used to interpret above equations. The most common inference mechanism is based on Mamdani’s approximation reasoning (1977).
Defuzzification is the last step of the inferencing mechanism to obtain a crisp value that is the best representative of the fuzzy output. The most common defuzzification method is center of area, which determines the centroid of output fuzzy sets (Yager and Filev 1994).
3.3. Fuzzy measures theory (FMT)
The term fuzzy measure was first coined by Sugeno (1974). Complex interactions between factors (i.e., sub- and super-additive) are best introduced by assigning a non-additive set function that permits the definition of weights to a subset of factors rather than to an individual factor. It is widely accepted that
additivity is not suitable as a required property of set functions in many real situations, due to the lack of
additivity in many facets of human reasoning (Ross 2004). Sugeno (1974) proposed to replace the
additivity property by a weaker one - monotonicity and called these non-additive (monotonic) measures
‘fuzzy measures’. However, it is important to note that fuzzy measures are not related to fuzzy sets, typically used to express vagueness and human subjectivity (Sugeno 1974).
For a discrete set X of n elements; X = {x1, x2, … , xn}, a (discrete) fuzzy measure on X is a set function μ({xi}): 2
n
− 2 → [0, 1] satisfying the following conditions (where n is the cardinality of a discrete set)
• µ(φ) = 0, µ(X) = 1, (where φ is a null subset) • K ⊆ T ⇒ µ(K) ≤ µ(T). (monotonicity)
For any K, T ⊆ X, µ(K) or µ(T) can be viewed as the weight or strength of the combination K (or T) for the particular decision problem under consideration. Thus, in addition to the usual weights on attributes taken separately, weights on any combination of attributes can also be defined. Monotonicity then means that adding a new element to a combination cannot decrease its importance (Marichal 1999). For example consider, K ={mathematics} and T = {mathematics, physics} are the (sub)sets of X = {mathematics,
physics, chemistry}. The corresponding fuzzy measures (importance weight), e.g., µ({mathematics}) =
0.5 and µ({mathematics, physics})= 0.7 fulfill the monotonicity condition. The fuzzy measure
µ({mathematics, physics, chemistry}) of the discrete set X (or sample space) will always be 1.
One possible meaning of a fuzzy measure can be defined as the level of importance or the degree of belief of a single attribute towards the overall evaluation of the system. In this research, a fuzzy measure was used to show the absolute contribution of a single water quality deterioration mechanism towards a given
type of a water quality failure. For example various types of WQ deterioration mechanisms including, potential for intrusion, potential for internal corrosion, THMs formation, and potential for permeation contribute to physico-chemical WQF (Figure 4B).
Sugeno (1974) also introduced the concept of fuzzy integrals to develop tools capable of integrating all values of a function in terms of the underlying fuzzy measure (μ). Several classes of fuzzy integrals exist, among which the most representatives are those suggested by Sugeno and Choquet (Marichal 1999). In this paper only Choquet integral is discussed.
The Choquet integral Cμ(x) is an aggregation operator, where the integrand is a set of n values X = {x1, x2,
… , xn}. The Choquet integral of a function x with respect to µ is defined by
( )
[
]
(
(1) (2) () 1 () ( 1) , { i n i i i x x x x x x Cμ =∑ − •μ Λ = −)
(4)where x(1) ≥ x(2) ≥ … ≥ x represent the order of x (also called utility values) in set X in descending order. The term where
(n) i
(
{x(1),x(2)Λ x(i))
μ are fuzzy measures similar to causal weights (w ). Interested readers should refer to Grabisch (1996) for details.
ij
4. Proposed Model for Predicting Water Quality Failures in Aging Distribution Networks
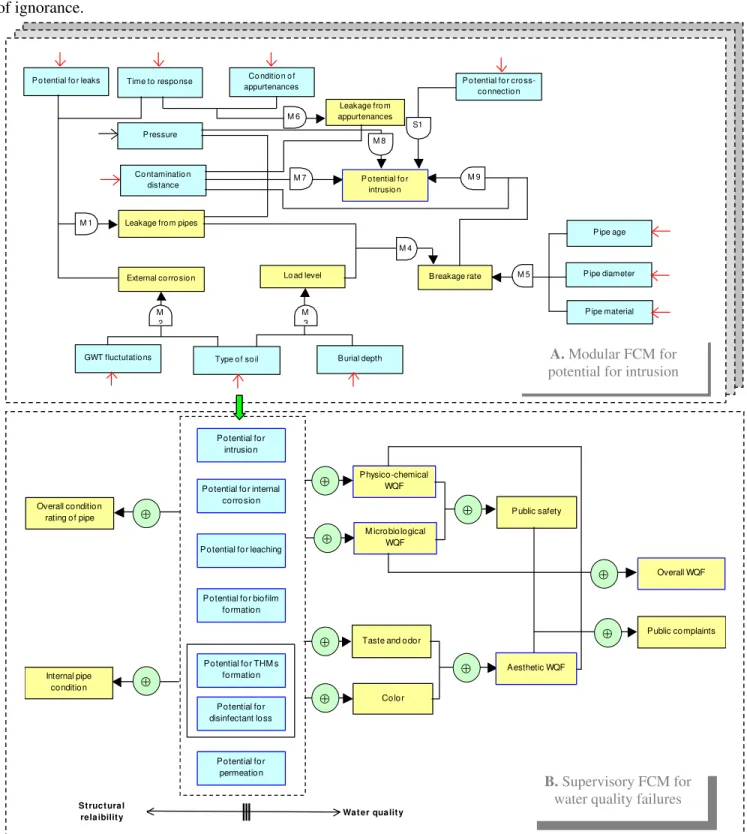
Two tiered (nested) FCMs are developed in the proposed model. At the lower or modular level, the water quality deterioration mechanisms are estimated using fuzzy rule-based modelling inference mechanisms (Section 3.2). At the higher or supervisory level, the water quality failures are estimated using fuzzy measures theory (Section 3.3).
We have identified more than fifty key concepts (factors) to model water quality deterioration in ageing water mains. These concepts were found essential for building a reliable model. While one can conceive additional factors that may influence water quality in distribution networks, it does not necessarily mean that these additional factors will result in more reliable outcome. In our selection of concepts we attempt to adhere to the principle of Occam’s razor, “one should not increase, beyond what is necessary, the number of entities required to explain anything”.
Figure 4 describes the complexity of the proposed FCM. The model is developed using nested FCMs in two levels, as described earlier. At the lower level, six modules containing MISO type fuzzy rule-based FCMs are developed for various water quality deterioration mechanisms including: (1) potential for intrusion (PI), (2) potential for internal corrosion (PC), (3) potential for leaching (PL), (4) potential for biofilm formation (PB), (5) potential for disinfection loss (PD) and potential for THMs formation (PT), and (6) potential for permeation (PP). Each module contains a multitude of basic concepts (nodes). For example, a rule-based FCM for “potential for intrusion” is shown in Figure 4A. The arrow sign (→) indicates a node that requires basic information input. Multiple rule-bases (Mk) are identified in this modular FCM (Figure 4A) to estimate the potential for intrusion. Similar modular FCMs are proposed for the 5 other water quality deterioration mechanisms.
The inferences from each of these FCMs provide an activation signal to the supervisory level FCM, which is used to predict water quality failures (Figure 4B). Three different types of water quality failures are identified, including aesthetic, physico-chemical and microbiological. The overall water quality failures are also estimated based on these three water quality failures. Many basic concepts are common in more than one of the modular FCMs, which demonstrate a strong interconnectivity among the concepts. Fuzzy measures were used to inference this interconnectivity, to account for their non-additivity.
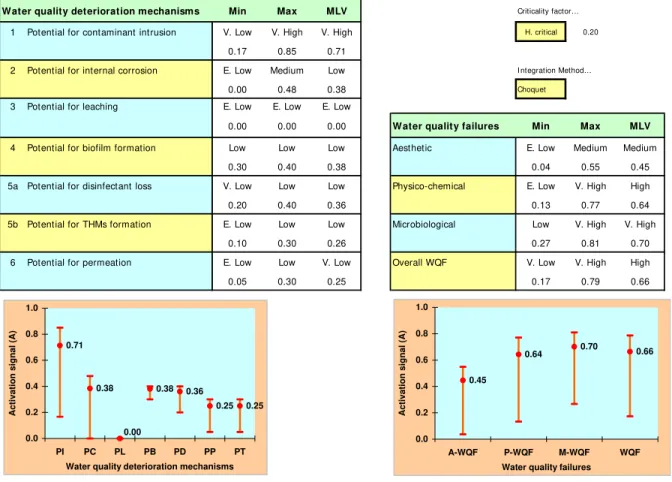
An example of results from the model is provided in Figure 5, where various water quality deterioration mechanisms as well as water quality failures are shown. The three values are provided for each result, minimum, maximum and most likely value (MLV), which is a crisp estimate of the range. The more input
parameters are missing, the larger the result interval [Min, Max.]. A criticality factor (α) is introduced here to help evaluate the crisp output (User’s estimate), based on Hurwicz’s decision strategy in case of missing data. The criticality factor α ∈ [0, 1], where α = 0 refers to “extremely critical”, and α = 1 refers to “not critical” scenarios. These two scenarios can also be linked to attitude of a decision-maker in case of ignorance.
Potential for intrusion
Potential for internal corrosion
Potential for leaching
Potential for biofilm formation Potential for disinfectant loss Potential for THM s formation Potential for permeation
Taste and odor
Color Physico-chemical WQF Overall WQF Public safety Public complaints ⊕ ⊕ ⊕ ⊕ ⊕ M icrobiological WQF ⊕ ⊕ Aesthetic WQF ⊕ Overall condition rating of pipe Internal pipe condition ⊕ ⊕ Wat er quality Structural relaibility GWT fluctutatio ns Co nditio n o f
appurtenances P o tential fo r cro ss-co nnectio n
P ressure
Co ntaminatio n distance
Leakage fro m pipes
M 7
S1
Type o f so il B urial depth
Lo ad level B reakage rate
P ipe age
P ipe diameter
P ipe material M 5
External co rro sio n
M 9 M 2 P o tential fo r intrusio n M 3 Time to respo nse
P o tential fo r leaks M 1 Leakage fro m appurtenances M 6 M 8 M 4 A. Modular FCM for
potential for intrusion
B. Supervisory FCM for
water quality failures
Figure 4. Nested FCMs for predicting water quality failures in distribution networks
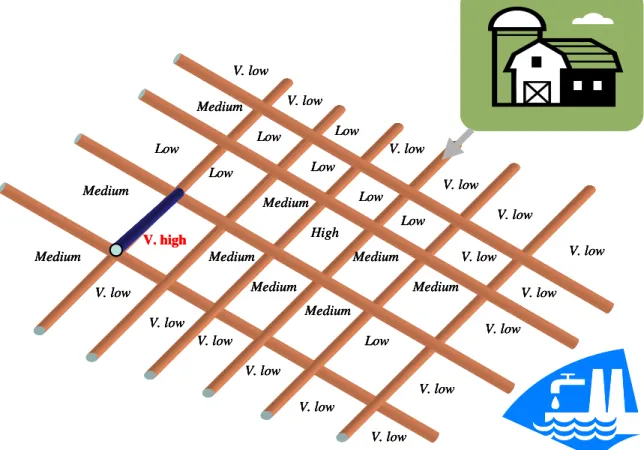
This paper presents an innovative approach that uses soft computing methods to quantify the risk of water quality failures at a given location for a single segment of a pipe in a water distribution network. However, the proposed approach can be applied to a single distribution main as well as extended to full-scale water distribution network. On a network level application, risk-contours of water quality failures could be established using GIS. These risk-contours may help utilities identify sensitive locations in the water distribution networks and prioritize their rehabilitation and control strategies (Sadiq et al. 2006). Figure 6 provides schematics of a risk map for water quality failures in a hypothetical water distribution network. To develop this risk map, the above analysis is repeated for different pipe sections. The risk map can help to develop prioritization strategies for rehabilitation or taking certain mitigative decision actions to reduce the risk of water quality failures.
Water quality deterioration mechanisms Min Max MLV Criticality factor…
1 Potential for contaminant intrusion V. Low V. High V. High H. critical 0.20
0.17 0.85 0.71
2 Potential for internal corrosion E. Low Medium Low I ntegration Method…
0.00 0.48 0.38 Choquet
3 Potential for leaching E. Low E. Low E. Low
0.00 0.00 0.00 Water quality failures Min Max MLV
4 Potential for biofilm formation Low Low Low Aesthetic E. Low Medium Medium
0.30 0.40 0.38 0.04 0.55 0.45
5a Potential for disinfectant loss V. Low Low Low Physico-chemical E. Low V. High High
0.20 0.40 0.36 0.13 0.77 0.64
5b Potential for THMs formation E. Low Low Low Microbiological Low V. High V. High
0.10 0.30 0.26 0.27 0.81 0.70
6 Potential for permeation E. Low Low V. Low Overall WQF V. Low V. High High
0.05 0.30 0.25 0.17 0.79 0.66
Results of Modular FCMs… Results of Supervisory FCM…
0.45 0.64 0.70 0.66 0.0 0.2 0.4 0.6 0.8 1.0 A-WQF P-WQF M-WQF WQF
Water quality failures
Activation signal (A)
0.71 0.38 0.38 0.36 0.25 0.25 0.00 0.0 0.2 0.4 0.6 0.8 1.0 PI PC PL PB PD PP PT
Water quality deterioration mechanisms
Activation signal (A)
Figure 5. An example of results generated from proposed model
This approach can also be implemented and be viewed as two layers in GIS. First layer may represent the risk of water quality failure using crisp estimate “MLV”, whereas the second layer may show the
confidence over those values using uncertainty interval “Max. – Min.”. The pipe segments with higher “MLV” are points of concern, however, pipes with lower “MLV” but larger uncertainty interval would also be of concern.
V. high
Figure 6. Prioritizing rehabilitation strategies for a distribution network based on water quality failures Low Low Low Low V. low Medium High Medium Medium Low Medium Medium Low Medium Medium Low Medium Medium V. low V. low V. low V. low V. low V. low V. low V. low V. low V. low V. low V. low Low V. low V. low V. low V. high Low Low Low Low V. low Medium High Medium Medium Low Medium Medium Low Medium Medium Low Medium Medium V. low V. low V. low V. low V. low V. low V. low V. low V. low V. low V. low V. low Low V. low V. low V. low V. high V. high Low Low Low Low V. low Medium High Medium Medium Low Medium Medium Low Medium Medium Low Medium Medium V. low V. low V. low V. low V. low V. low V. low V. low V. low V. low V. low V. low Low V. low V. low V. low Low Low Low Low V. low Medium High Medium Medium Low Medium Medium Low Medium Medium Low Medium Medium V. low V. low V. low V. low V. low V. low V. low V. low V. low V. low V. low V. low Low V. low V. low V. low
5. Summary and Conclusions
Numerous factors affect water quality in the distribution networks and the interactions amongst them are complex and often not well understood. Water quality failures in distribution networks are scarce, which make statistically significant generalizations difficult. A nested predictive model using fuzzy cognitive maps (FCMs) is proposed to comprehend these ill-defined and complex relationships that govern water quality in the distribution network. At the modular (lower) level, six rule-based FCMs are proposed for various deterioration mechanisms, which contribute to water quality failure. At supervisory (higher) level FCM is proposed which employs fuzzy measures to interpret activation signals received from the modular FCMs to predict water quality failure risk in distribution networks.
The proposed method will help quantify the risk of water quality failures in a given pipe. However, the concept can be extended to water distribution network, which will help establish risk-contours of water quality failures. The risk-contours may help utilities identify sensitive locations in the water distribution networks using GIS and prioritize decision strategies.
Acknowledgements
This paper presents the results of a preliminary investigation of an on-going research project, which is co-sponsored by the American Water Works Association Research Foundation (AwwaRF) and National Research Council (NRC) of Canada.
References
Aschengrau, A., Ozonoff, D., and Paulu, C. (1993). Cancer risk and tetrachloroethylene contaminated drinking water in Massachusetts, Archives of Environmental Health, 48(5): 227-230
Clark, R.M., Reasoner, D.A., Fox, K.R., and Hurst, C.J. (1997). Drinking water treatment and distribution: its role in preventing waterborne outbreaks, Presented at Workshop on Design of Waterborne Disease
Occurrence Studies, Atlanta, GA
Geldreich, E.E. (1990). Microbiological quality control in distribution systems, In: Water Quality and Treatment. Edited by Frederick, W.P., American Water Works Association, NY, McGraw-Hill Inc. Grabisch, M. (1996). The application of fuzzy integrals in multicriteria decision making, European Journal of
Operations Research, 89: 445-456
Holsen, T.M., Park, J.K., Jenkins, D., and Selleck, R.E. (1991). Contamination of potable water by permeation of plastic pipe, JAWWA 83(8): 53-56
Khan, M.S., Khor, S.A. (2004). Framework for Fuzzy rule-based cognitive maps, 8th Pacific Rim International Conference on Artificial Intelligence, Auckland, August 8-13, pp. 454-463
Kirmeyer, G.J., Friedman, M., Martel, K., and Howie, D. (2001). Pathogen intrusion into distribution system, AwwaRF, Denver, CO, US
Kleiner, Y. (1998). Risk factors in water distribution systems, British Columbia Water and Waste Association
26th Annual Conference, Whistler, B.C., Canada
Kosko, B. (1997). Fuzzy engineering, Upper Saddle River, NJ, Prentice Hall
Maier, S.H. (1999). Modelling water quality for water distribution systems, Ph.D. thesis, Brunel University, Uxbridge, UK
Makropoulos, C.K. and Butler, D. (2004). Spatial decisions under uncertainty: fuzzy inference in urban water management, Journal of Hydroinformatics, 6(1): 3-18
Mamdani, E.H. (1977), Application of fuzzy logic to approximate reasoning using linguistic synthesis, IEEE
Transactions on Computers, 26(12): 1182-1191
Marichal, J-L. (1999). Aggregation Operators for Multicriteria Decision Aid, PhD thesis, University of Liege Liege, Belgium
Miao, Y., Liu, Z-Q, Siew, C.K., and Miao, C.Y. (2001). Dynamical cognitive network – an extension of fuzzy cognitive map, IEEE Transactions on Fuzzy Systems, 9(5): 760-770
Rodriguez, M. J., Serodes, J. and Morin, M., (2000). Estimation of water utility compliance with
trihalomethane regulations using modelling approach, Journal of Water Supply Research and Technology –
Aqua, 49(2): 57-73
Ross, T. (2004). Fuzzy logic with engineering applications, 2nd Edition, John Wiley & Sons, New York Sadiq, R., Kleiner, Y. and Rajani, B.B. (2006). Estimating risk of contaminant intrusion in distribution
networks using Dempster-Shafer theory of evidence, Civil Engineering and Environmental Systems, 23(3): 129-141.
Sadiq, R., Kleiner, Y., and Rajani, B.B. (2004). Aggregative risk analysis for water quality failure in distribution networks, AQUA - Journal of Water Supply: Research & Technology, 53(4): 241-261 Sugeno, M. (1974). Theory of Fuzzy Integrals and its Applications, Ph.D. Thesis, Tokyo Institute of
Technology, Tokyo
Thompson, C., and Jenkins, P. (1987). Review of Water Industry Plastic Pipe Practices, AwwaRF, Denver, CO, US
US EPA (2006). US EPA white papers, http://www.epa.gov/safewater/tcr/tcr.html
US EPA (1999). Microbial and disinfection by-product rules – simultaneous compliance guidance manual, United States Environmental Protection Agency, EPA 815-R-99-015
Yager, R.R., and Filev, D.P. (1994). Essentials of fuzzy modeling and control, John Willey & Sons Inc., NY, US
Zadeh, L.A. (1973). Outline of a new approach to the analysis of complex systems and decision processes,