Analysis of Energy Use and Carbon Emissions from
Automobile Manufacturing
by
Sumant S. Raykar
B.E in Mechanical Engineering, University of Pune, 2009
M.Eng in Manufacturing, Massachusetts Institute of Technology, 2011
Submitted to the Department of Mechanical Engineering in Partial Fulfillment of the Requirements for the Degree of
Master of Science at the
MASSACHUSETTS INSTITUTE OF TECHNOLOGY June 2015
0 Massachusetts Institute of Technology. All Rights Reserved.
ARCHIVES
MASSACHUSETTS INSTITUTE OF TECHNOLOLGYJUL 3
0
2015
LIBRAR IES Signature of Author... Certified By ... Accepted By ...Signature redacted
Sumant S. RaykarDepartment of Mechanical Engineering May 18, 2015
Signature redacted
V
Timothy G. Gutowski Professor of Mechanical Engineering Thesis Supervisor
Signature redacted...
David E. Hardt Ralph E. and Eloise F. Cross Professor of Mechanical Engineering Department of Mechanical Engineering
Analysis of Energy Use and Carbon Emissions from Automobile Manufacturing
by
Sumant S. Raykar
Submitted to the Department of Mechanical Engineering on May 18, 2015 in Partial Fulfillment of the Requirements for the Degree of Master of
Science in Mechanical Engineering
Abstract
In this thesis, we study the energy use and emissions arising from automobile manufacturing. The automobile manufacturing sector is the 11th largest industrial sector globally in terms of energy use and emissions. The IPCC has set targets for reduction in emissions so that the average concentration of carbon dioxide in the atmosphere does not exceed dangerous levels. The materials production sectors have achieved significant reduction in energy use in the last few decades. Progress in the production and assembly of components has been harder to prove. Base load energy use continues to be a high fraction of energy use at manufacturing facilities.
We study the energy use and emissions reported by automobile companies in voluntary disclosures to the Carbon Disclosure Project (CDP), and in their sustainability reports. A model of a typical global vehicle assembly plant is created by using data published in literature. We find a good fit of this data with the CDP data. A certain fraction of parts manufacturing is included in-house. Then, a simple thermodynamic model of the factory is developed. This shows that air exchange causes a significant heating and cooling load at factories. Internal heat gains contribute to the cooling load. We then test various emissions reduction scenarios to see their effectiveness in reducing energy use or emissions.
We find that most of the reduction in emissions intensity in the last few years is likely due to the economies of scale effect, in spite of significant emission-reduction efforts by some companies. We predict a trend towards higher manufacturing energy consumption due to use of low weight, high energy intensity materials in order to reduce use phase emissions. At some point, manufacturing emissions might become as significant as use phase emissions. Even if emissions intensity of manufacturing can be decreased, increased demand means that absolute emissions will continue to grow. Right now, it does not appear that this sector is on a pathway towards meeting climate change goals.
Thesis Supervisor: Timothy G. Gutowski Professor of Mechanical Engineering
Acknowledgements
This thesis is the culmination of an unusual, eventful, long-winded journey, and it could not have been possible without the encouragement, strength and companionship provided by so many people.
I extend my gratitude to my advisor, Prof. Gutowski, for being a great educator and a great mentor. He provided numerous opportunities, and showed immense faith in me which drove me to do my best. I learned a lot about research and teaching from him, and these lessons and his kindness will always be cherished.
Equally cherished will be the memories with Prof. Gutowski's research group, Environmentally Benign Manufacturing, which I called home for almost two years. I will be forever grateful to Michael Lloyd for his friendship at a time when I was lonely and not my own self. Dan Cooper and Katie Rossie energized the lab, and we all went from being office-mates to friends because of their ability to connect people so effectively. Dan's advice on matters work and otherwise was always on point. And Katie has been a good friend, a gracious host and a charming story-teller. Sheng Jiang, my comrade-in-arms in spending late nights at the office, going swimming or sailing, and sharing life stories, has been a great friend. And I will fondly remember the times spent in the office and outside with Marta Baldi, Gero Corman, Michael Hausmann, Anne Raymond and Mathias Schmieder. Thanks go especially to Mathias with whom I worked on this project, and who is a wonderful collaborator.
I would also like to thank Karuna Mohindra, David Rodriguera and Carissa Leal in the Laboratory for Manufacturing and Productivity. Also, thanks to Leslie Regan at the MIT Mechanical Engineering Graduate Office, and the
International Students Office who kept me out of trouble and provided terrific support. This extends to Prof. David Hardt as well to whom I have gone often over the last five years seeking direction and counsel.
This thesis benefited from the work done by my peers in the MIT class 2.813/2.83 Energy, Materials and Manufacturing in the spring 2014 term in gathering data from various automobile companies. Thanks again to Katie for motivating the class project and my own thesis in the first place.
MIT presents lot of challenges, and often these challenges lie not in the realm of research, but in overcoming fear, doubt, stress and periods of crippling hopelessness. Alexandra Prior helped me get over these challenges, and in the process made me a more reflective and considerate person, more aware of my weaknesses and ways to overcome them. When I experience doubt or confusion, I remember her advice, and it always gets me through. I cannot thank her enough.
I also thank Cassandra Donnelly, who I wish I had met earlier, because every day that I know her has been better than the last. She kept me going through the thesis-writing process, and always puts a smile on my face.
I would be remiss not to mention my mother and father, my sister, her husband and their two beautiful boys, who provide immense happiness and strength. They are all an inspiration to me. Thanks also go to my school and college friends from Pune, and my current roommates Kit and Kat.
Finally, thanks to all the wonderful people and resources at MIT - the Sailing Pavilion, the Z-Center, the libraries and the Thirsty Ear Pub. And thank you to everyone else who I may have missed mentioning here, but who
Contents
C hapter 1: Introduction... 15
1.1 State of the global automobile industry... 15
1.2 M otivation ... 17
1.3 Problem Statem ent ... 27
1.4 Thesis Structure ... 28
Chapter 2: Literature Review ... 30
Chapter 3: Analysis of CDP Reports ... 36
3.1 Introduction to the CDP ... 36
3.3 C D P Q uestionnaire... 38
3.4 D ata A nalysis... 41
Chapter 4: Case Studies of Component Production and Vehicle Assembly 62 4.1 Engine Manufacturing Plant Energy Use ... 62
4.2 Regression Models for Renault Factory Emissions... 67
Chapter 5: Surrogate Global Assembly Plant Model... 73
5.1 A ssem bly plant m odel... 73
5.2 Assembly plant and the automobile supply chain... 80
Chapter 6: Thermodynamic model and evaluation of emission reduction a ctiv itie s ... 9 1 6.1 Basic therm odynam ic m odel ... 91
6.2 Scenario A nalysis... 112
Chapter 7: Modern Vehicles - Materials, Manufacturing and Use ... 136
7.1 An LCA of the Tesla Model S ... 136
Chapter 8: Conclusions and Future Work... 157
8 .1 C on clu sion s ... 157
8.2 F uture W ork... 162
R eferen ces ... 16 4 Appendix A: Energy Use for Vehicle Manufacturing in Literature ... 174
Appendix B: Renault Factory-Level Data ... 177
Appendix C: Material Content of the Vehicle Modeled ... 180
Appendix D: Solar Radiation on Flat-Plate Collectors in Detroit ... 182
List of Figures
Figure 1.1: Global C02 emissions from fossil fuel combustion by sector,
2 0 1 1 ... ... . 1 8 Figure 1.2: Global industrial (a) primary energy use and (b) CO2
em issions by end-use sector, 2005... 20 Figure 1.3: Primary energy use in the U.S manufacturing sector, 2006 ... 21 Figure 1.4: Non-process energy use in U.S manufacturing, 2006... 22 Figure 3.1: Total number of responses for the Climate Change and
Supply C hain program s ... 38 Figure 3.2: Global production numbers from 2008-2012 for eleven
a u tom ak ers ... 4 3 Figure 3.3: Absolute Scope 1+2 emissions from 2008-2012 for eleven
au tom ak ers ... 4 4 Figure 3.4: Scope 1+2 emissions per vehicle for eleven automakers ... 45 Figure 3.5: Scope 1+2 emissions intensity over the years for eleven
automakers plotted against their global production numbers ... 48 Figure 3.6: Scope 1+2 and Scope 3.1 emissions per vehicle for eleven
autom akers, 20 12 ... 51 Figure 3.7: Use phase emissions in grams C02 per km for eighteen
companies shown against the 2012 CAFE and NEDC standards, 2012.... 53 Figure 3.8: Use phase emissions for U.S fleets, and emissions standards
for different regions, in NEDC gram C02 per km ... 54 Figure 3.9: Use phase emissions for European fleets, and emissions
standards for different regions, in NEDC gram CO2 per km ... 55
Figure 3.10: Average of manufacturing and use phase emissions for five
autom akers in 20 12 ... 56 Figure 3.11: Purchased electricity per vehicle for eleven automakers,
Figure 3.12: Fuel use (MJ per vehicle) for eleven automakers, 2012 ... 59
Figure 3.13: Emissions intensity of purchased electricity in kg CO2 per k W h , 2 0 12 ... . 60
Figure 3.14: Emissions intensity for fuel use, in kg CO2 per MJ, 2012... 61
Figure 4.1: Scaled electricity use vs. scaled engine production... 63
Figure 4.2: Scaled natural gas use vs. scaled engine production ... 64
Figure 4.3: Total natural gas use vs. mean monthly temperature ... 65
Figure 5.1: Sketch of the surrogate factory, its emissions and products ... 77
Figure 5.2: Scope 1, Scope 2 and Scope 1+2 emissions for fifteen autom akers, 20 12 ... 79
Figure 5.3: Comparison of Sullivan's VMA model to literature ... 84
Figure 5.4: Sankey diagram of energy used per vehicle at the factory... 86
Figure 5.5: Calculated in-house energy compared to reported energy use by auto com panies, 2012 ... 87
Figure 5.6: Calculated Scope 1+2 emissions compared with reported 2012 Scope 1+2 em issions ... 88
Figure 5.7: Calculated Scope 1+2 and Scope 3.1 emissions compared with values reported to the CDP by five companies... 89
Figure 6.1: A histogram of employees at some U.S plants ... 104
Figure 6.2: Carbon intensities of the U.S and Japanese electric grids over th e y ears ... 12 5 Figure 7.1: Schematic of the operations covered under the GREET model 140 Figure 7.2: Vehicle cycle primary energy use for various vehicles, GJ per v eh icle ... 14 5 Figure 7.3: Lifecycle primary energy use for various vehicles, MJ per km 146 Figure 7.4: Vehicle cycle CO2 emissions for various vehicles, metric tons p er v eh icle ... 14 7 Figure 7.5: Life-cycle CO2e emissions, gram per km ... 148
Figure 7.6: Model S Life-cycle emissions over 50 states and D.C, gram C O 2e p er k m ... 149
Figure 7.7: Tesla Model S compared to other vehicles from Ashby for use phase energy and CO em issions... 151
Figure 7.8: Lifetime manufacturing and use phase emissions for the
M odel S in th e U .S ... 152
Figure 7.9: V olksw agen XL1 ... 153
Figure 7.10: Estimated lifetime energy use for the XL1 ... 155
Figure 7.11: Estimated lifetime CO2 emissions for the XL1 ... 155
Figure 8.1: Tailpipe emissions: historical and proposed targets for variou s cou n tries ... 158 Figure 8.2: Pathways for manufacturing and use phase emissions till
List of Tables
Table 4.1: Results of regression analysis for scaled electricity and scaled
natural gas use vs. scaled production and temperature ... 65
Table 4.2: Average values of the plant variables in the Renault model .... 67
Table 4.3: Scope 1 emissions intensity regression results... 70
Table 4.4: Scope 2 emissions intensity regression results ... 70
Table 4.5: Scope 2 emissions intensity regression results... 71
Table 4.6: Scope 2 emissions intensity regression results... 71
Table 5.1: Activities performed at the surrogate assembly plant ... 74
Table 5.2: Emissions per vehicle from natural gas and electricity use... 76
Table 5.3: Comparison of the CDP data to Sullivan's data for emissions in te n sity ... 7 7 Table 5.4: Materials and vehicle manufacturing results from Sullivan (19 9 8 ) ... . 8 0 Table 5.5: Vertical integration at Chrysler, Ford and G.M in the late 1 9 9 0 s . ... 8 0 Table 5.6: Energy use and emissions for the entire automobile manufacturing cycle based on Sullivan's data... 82
Table 5.7: Estimated energy required for in-house operations in an assem b ly p lant... 8 5 Table 5.8: Estimated emissions from in-house operations in an assembly p la n t ... 8 5 Table 6.1: Detroit heating and cooling Fahrenheit degree days for 2014.. 92
Table 6.2: O utdoor air flow rates ... 94
Table 6.3: Sensible heating and cooling loads for a year ... 95
Table 6.4: Latent heating and cooling loads for a year... 97
Table 6.6: Average sol-air temperatures for external surfaces for the
w inter and sum m er season ... 100
Table 6.7: Heating and cooling loads across different external surfaces ... 102
Table 6.8: Net process equipment heat release ... 106
Table 6.9: Summary of the internal heat gains on a per vehicle basis ... 107
Table 6.10: Heating load, energy requirement and CO2 emissions... 109
Table 6.11: Cooling load, energy requirement and CO2 emissions... 109
Table 6.12: Comparison of our model to literature ... 110
Table 6.13: Energy use at the surrogate plant in Detroit ... 113
Table 6.14: CO2 emissions from the surrogate plant in Detroit ... 113
Table 6.15: Winter heating loads in the base case and the warmer winter case due to air exchange... 119
Table 6.16: Winter heating loads in the base case and the warmer winter case due to conduction through external surfaces ... 120
Table 6.17: Summer cooling loads in the base case and the less humid sum m er case due to air exchange ... 121
Table 6.18: Maserati energy and emissions data, 2010-2013... 122
Table 6.19: Comparing emissions from purchased electricity for vehicle assem bly in Japan and the U S ... 123
Table 6.20: Aggregate production, Scope 1+2 emissions and emissions intensity of eleven companies from 2008 to 2012 ... 131
Table 6.21: Estimates of the impact of scenarios on emissions... 134
Table 6.22: Change in CO2emitted per vehicle for a change in production volume and capacity, given that all else remains the same ... 135
Table 7.1: Assumptions for the Model S with lightweight and conventional m aterials... 142
Table 7.2: Results for the Tesla Model S vehicle cycle... 143
Table 8.1: Manufacturing and use phase emissions comparison between average European vehicle and the Volkswagen XL1... 159
Chapter 1: Introduction
In this section, we introduce the topic of automobile manufacturing, its impact on the environment in terms of fossil fuel depletion and carbon emissions, and why this sector of the global economy deserves closer attention if we are to meet global C02 emissions reduction targets.
1.1 State of the global automobile industry
Global vehicle production has seen tremendous growth in the last two decades. Assembly of cars and light trucks rose to 83 million vehicles in 2013 from 45 million vehicles in 1990 [1]. This rapid growth in the late 1990s and early 2000s was interrupted by the global recession of 2008-09 in which demand fell dramatically. Since then, the industry has consolidated and has exceeded pre-recession production volumes. However, the effects of the recession are still being felt by the industry. European factories are underutilized, with an average utilization rate 15% points lower than what it was in 2000 [2]. In North America, several production facilities were closed, and entire product divisions (like General Motors' Pontiac and Saturn) were dissolved. In 2009, Chrysler and GM filed for bankruptcy protection with the U.S government to allow them to restructure [3] [4]. In 2009, U.S automobile
utilization dropped down to 60% and China displaced the U.S as the top automobile producer in the world. China has maintained the top spot since then, but U.S automobile manufacturing has made a strong recovery and utilization rates reached 90% in 2013. Most of the growth in automobile capacity and production in the last few years has happened in China, South Korea, India, Brazil and Mexico [5].
The type of vehicles being manufactured is also changing. In 2012, small vehicles accounted for about 30% of global vehicle sales or about 24 million vehicles, and they are expected to reach 30 million vehicles by 2020. Most of this growth is driven by the markets of developing countries [2].
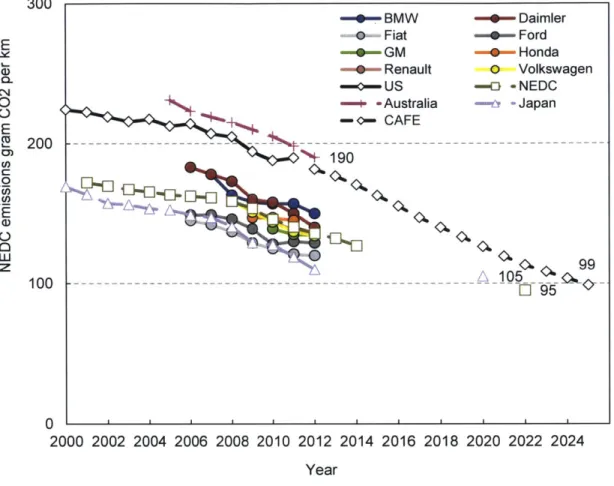
Carmakers are also responding to legislation mandating minimum fuel economy standards in many countries. The New European Driving Cycle (NEDC) standard for European vehicles has set the target at 95 grams CO2
per km for the year 2025. In the US, the Corporate Average Fuel Economy (CAFE) standards originally set a target of 99 grams CO2 per km for the year
2025. However, CAFE standards have been reworked and are now calculated based on vehicle footprint. Thus, each automaker has its own target based on the composition of its fleet. A fine is imposed if the fleet does not meet the prescribed standards. Carmakers have started using light-weight materials in vehicles to increase fuel efficiency. Aluminum, plastics and composites are increasingly used in cars, replacing conventional steel. Often, the low-weight material used as a replacement for steel has a higher material production energy and carbon footprint. However, the savings in energy and emissions which happen over the vehicle use phase are more than enough to offset this higher impact. Hybrid vehicles, electric vehicles, and alternative fuel technologies are also being developed to reduce tailpipe emissions.
1.2 Motivation
Brief introduction to climate change
The Intergovernmental Panel on Climate Change (IPCC) was established by the United Nations in 1988 to study climate change - its causes, potential effects, and mitigation strategies. The IPCC's most recent assessment report, published in 2014, warned that the concentration of greenhouse gases (GHG) in the atmosphere had exceeded levels measured or estimated for as far back as 800,000 years. The report warned that the rate of increase of GHG concentration had not been witnessed in the past 20,000 years. The three main GHGs are carbon dioxide (C02), methane (CH4) and nitrous oxide
(N20). A most certain conclusion is that anthropogenic emissions of CO2 -from fossil fuel burning and land use change - are the main cause of the increase in its concentration in the atmosphere [6, p. 467].
When CO2 is present in the atmosphere, it absorbs long-wave radiation emitted from the earth's surface thereby causing global warming. The IPCC reports that most of the increase in CO2 concentration in the atmosphere has
happened due to fossil fuel burning. Over the period 2002-2011, annual emissions from fossil fuel burning and cement production averaged (8.3 0.7) Gt of carbon [6, p. 486]. From 2005 to 2011, the CO2 concentration in the atmosphere increased by (11.66 0.13) ppm. The 2011 global average CO2 concentration was (390 +- 0.28) ppm [7, p. 166]. The IPCC also reports that the first decade of the 21st century was the warmest on record [7, p. 161].
The global warming potential (GWP) of various GHGs over a certain time period can be expressed in terms of how much CO2 would add the same
GWP potential of methane 20 years after its emissions is 86 whereas after 100 years it is 28 [8, p. 714]. The GWP of a compound depends among other things on its lifetime in the atmosphere, how much radiative forcing it causes, its stability and reactions with other compounds in the atmosphere.
Energy use in industry
Global industrial use of fossil fuels is the largest contributor to CO2
emissions. Figure 1.1 shows how CO2 emissions from fossil fuel burning broke
down by end-use sector.
o Residential and Other o Industrial o Transportation
23%
38%
Total: 31,342 rnillion tons
Figure 1.1: Global CO2 emissions from fossil fuel combustion by sector, 2011
In 2011, industrial emissions accounted for almost 39% of total CO2 emissions. This was followed by emissions from transportation at almost 23%. Of the total transportation emissions, about 72% were from road transport. The category "Other" includes commercial services, public services, agricultural activities among others [9, p. 11].
Total industrial emissions in 2010 amounted to 13.1 GT CO2 out of which 5.3
GT were from direct energy-related emissions, 5.2 GT were indirect emissions from the generation of electricity and heat, 2.6 GT were from process emissions, and the rest were from waste. Total emissions of greenhouse gases in 2010 consisted largely of CO2 (85%) and methane (8.6%) [10].
Globally, industrial energy use (and CO2 emissions) is dominated by a few
sectors - iron and steel, chemicals and petrochemicals, cement, paper, pulp and print, and food and tobacco. These sectors account for 70% of global energy use [11, pp. 476-477]. Their high energy use is attributable to the energy-intensive processes in these industries.
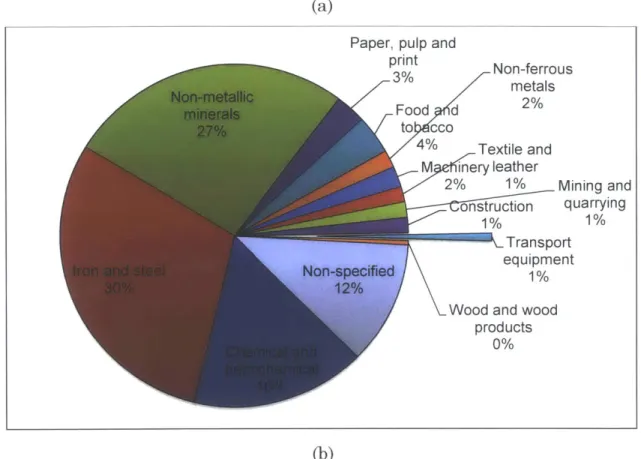
Automobile manufacturing falls under the broader sector of transportation equipment. This sector ranks 11th globally in terms of energy use and CO2
emissions. In 2005, it used 1,423 PJ of primary energy, and emitted 49 million metric tons of CO2 [11, p. 481]. Figure 1.2 shows the major manufacturing sectors by energy use and CO2 emissions.
Food and Paper, pulp and tbcO Non-ferrous print
5% metals 6% Machinery 30% 4% Textile and leatheMining 2% and quarryin Construction 2% 1%/ Transport equipment ood and 1%
(a)
Paper, pulp and rint
(b)
Figure 1.2: Global industrial (a) primary energy use and by end-use sector, 2005
(b) CO2 emissions
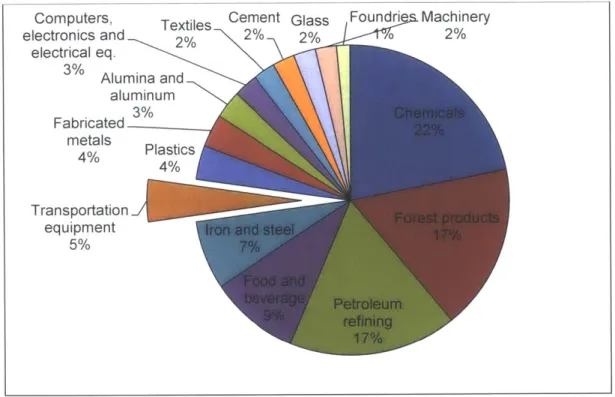
In 2006, the transportation equipment sector was the 6th largest in the U.S in terms of annual primary energy use at 904 TBtu [12, p. 17]. It produced 53 million metric tons of C02-equivalent (CO2e) emissions of which 15 million metric tons were generated on-site [12, p. 37]. Figure 1.3 shows the energy consumption breakdown by sector for the United States. Of the total transportation equipment sector, 8% is due to passenger vehicles and light truck manufacturing (North American Industry Classification System sectors 336111 and 336112). Note that this does not include heavy duty truck manufacturing or the motor vehicle parts manufacturing sectors. Nevertheless, we can draw important lessons by studying automobile assembly, about which sufficient data is available, that can then be applied to the transport equipment sector in general.
V Non-ferrous 3% metals Food d 2% to cco 4% Textile and M inery leather 2% 1% Mining and onstruction quarrying 1% 1% Transport equipment 1%
Wood and wood products
0%
Figure 1.3: Primary energy use in the U.S manufacturing sector, 2006 In the materials production industries, energy costs can be significant, around 20% of the total costs in the steel industry [13, p. 22]. The non-process load (for example, heating, ventilation and air-conditioning (HVAC)) is small compared to the process load [13, p. 17]. Since energy costs are high, these industries have made notable improvements in their processes and reduced their energy footprint. For example, in the U.S, the steel industry has reduced energy intensity by 60% over two-and-a-half decades going back from 2006 [13, p. 19]. The U.S cement industry reduced energy intensity by 30% in the period from 1970 to 1999 [14, p. 10].
Gutowski et al studied energy use for some of the most energy consuming materials - steel, cement, aluminum, paper and plastics - and found that
energy use for these materials could not be halved by 2050, as demand for these materials doubles [15]. This puts additional pressure on other sectors of manufacturing, as well as on residential and transportation sectors to do better than a 50% reduction.
Computers, Textiles Cement Glass Foundri Machinery
electronics and 2% 2% 2% 2% electrical eq. Alumina and aluminum Fabricated metals Plastics 4% 4% Transportation equipment 5%
Process energy needs do not always dominate non-process energy needs. As we move down the supply chain i.e., away from materials production, non-process energy requirements get more significant. While transportation equipment ranks 6th in terms of overall energy use, it ranks 3rd in terms of
energy use for non-process needs, at 196 TBtu, only behind the forest products and chemicals sectors [12, p. 31]. This is shown in Figure 1.4 below. In 2006, the U.S automobile and light truck sectors consumed 44.3 TJ of primary energy to meet HVAC needs [16].
Alumina and Cement aluminum 1% 1% ~ Foundries 2% Glass 2% Textiles 3% Petroleum refining 4%
Iron and steel
5%
Plastics
5% Computers,
Fabricated electronics
metals and electrical
6% Machinery equipment
6% 7%
Figure 1.4: Non-process energy use in U.S manufacturing, 2006
The residential sector is a major end-use contributor to CO2 emissions from fossil fuel burning, as seen in Figure 1.1 above. A residence uses energy for HVAC, water heating, lighting and appliances. To minimize residential energy needs, the concept of passive houses was developed. Careful attention is given to the building construction, exposure to the elements, air flow, employing energy-efficient lighting and appliances and heat recovery techniques. The use of renewable energy sources is emphasized. The passive
meter of treated floor area, total primary energy demand to be less than 120 kWh and air infiltration to be less than 0.6 air exchanges per hour. Thousands of passive houses have been built so far, most of them in Europe. Even conventional residences in cold-climate countries have made notable improvements in reducing heating energy intensity in the past few decades. Harvey [17] presents a summary these improvements.
The same level of attention to heating and cooling loads, and air exchange rates has not been seen in factories. In 2006, the automobile and light truck manufacturing sectors of the U.S economy purchased $886 million of energy, about half of which was spent on purchasing electricity, 43% on natural gas, and the rest on other fuels [16]. According to Galitsky et al [18], about 11% to 20% of electricity use is for HVAC needs, and half of fossil fuel is used for space heating. The heating load in an automobile assembly plant is estimated to be about 555 to 860 kWh per square meter of floor area' [16] [19] [20]. Paint shop air handling requirements are the most stringent.
A few examples of factories incorporating passive house concepts are the SurTec factory [21] and a factory which builds components for passive houses [22]. However, these are small factories. One noteworthy example is the Daimler vehicle assembly plant in Rastatt, Germany. This plant has a floor area of 539,000 m2 and it makes Mercedes Benz A- and B-class cars. Daimler reports that this plant has eliminated conventional heating and air conditioning systems. They utilize groundwater heat by means of a heat pump, and recover factory waste heat to maintain comfortable operating conditions year round [23].
The Kaya identity
1 To estimate this, we assume that the factory floor area is 250,000 M2, and annual
The IPCC presents emissions pathways or scenarios for various levels of CO2e concentrations in the atmosphere predicted for the year 2100, and the reduction in absolute emissions needed to meet that limit. To limit CO2e concentration in the atmosphere between 430-480 ppm by the year 2100,
CO-2e emissions in 2050 would have to be reduced by 41% to 72% compared to
emissions in the year 2000, or 78-118% lower in 2100 compared to 2000 levels [24, p. 431]. We can use these emission pathways to allocate an emission reduction target for different sectors. Grimes-Casey et al [25] did this for U.S automobile use-phase emissions. We can use the Kaya identity (also known as the IPAT equation) to determine how energy-efficient automobile production needs to be, even as it grows over the next few decades, in order to meet its emissions target.
The IPAT identity relates the environmental impact (1) to causative factors like population (P), affluence (A), consumption (C), and technology (T). We write,
I=PxAx Cx T.
For small changes in each factor, we can write the per cent change as,
AI AP AA AC AT
I P A C T
Writing the equation this way helps to identify which controls we can operate to avoid a certain impact. For example, reducing consumption of a certain resource might require a political or social action, whereas reducing the intensity of consumption might require a technological effort. Note that written this way the equation assumes that the parameters on the right side are independent of each other.
Here, we use the IPAT equation in different ways to see how global economic growth poses increasing challenges in reducing energy use and emissions. We
consider the global average economic growth as well as that of the United States economy and how motor vehicle production fits into overall growth. We use C02-only pathways since data on CO2 emissions per dollar of GDP or per
unit kg oil-equivalent of energy used are readily available.
In the IPCC's fourth assessment report (AR4), the most stringent target of a CO2 concentration of 350-400 ppm in 2100 required reducing global C02 emissions in 2050 by 50-85% compared to 2000 levels [26]. Assuming a compounded annual rate, this would require an annual decrease of 1.38 to 3.72% a year. In the IPAT differential equation, we have, A/I= -0.0138 to
-0.0372.
Instead of using the term population literally, we use it here to mean global value-added in terms of dollar value. We use the world and U.S average gross domestic product (GDP) figures, calculated by the purchasing power parity (PPP) method and presented for a constant 2011 international dollar [27]. From 1990 to 2013, world GDP grew at 3.37% and U.S GDP grew at 2.48% annually.
For representing the affluence and consumption term, we use energy use in terms of kg of oil equivalent per $1,000 of GDP, with GDP defined the same way as above. World average energy use defined this way decreased at 1.37% year-on-year (YOY) from 1990 through 2010 while U.S energy use decreased at 1.76% YOY [27].
The technology term is represented by the carbon intensity of fuel use (kg CO2 per MJ of energy). This is calculated based on World Bank data on CO2
use per 2011 international dollar of GDP and the energy use term we used above. World carbon intensity increased from 1990 to 2010 at a rate of 0.14% a year whereas the U.S carbon intensity decreased at 0.07% over the same period.
Entering the values of AP/P, AA/A and ATIT in the IPAT equation, we get,
AI/I = 2.14% for the world, and AI/ = 0.63% for the U.S. Thus, over the past few years, global and U.S emissions have not been on the pathways prescribed by the IPCC. Meeting the targets would still be possible after this initial overshoot if future emissions could be reduced at drastic rates.
For the second case study, we look at the global picture and separate automobile manufacturing from global output, which is different from global GDP. According to the United Nations Industrial Development Organization, global manufacturing output in 2008 totaled $32 trillion out of which, motor vehicles output was $2.7 trillion [28]. From 2000 through 2008, global manufacturing output grew at 9.35% a year, whereas the share of motor vehicle manufacturing fell at 2.66% a year. Now, we consider the IPCC AR4 target of reducing emissions at 1.38% to 3.72% a year. To achieve this, motor vehicle manufacturing would have to improve its energy efficiency (defined as energy use per dollar of sector output) at 7.72% to 10% a year, every year till 2050, if growth continued at the same rate. We can see that allocating the IPCC target to motor vehicle production presents a steep challenge for the industry.
Determining efficacy of emission reduction activities
In the past few years, companies, bowing to societal, regulatory or investor pressures, have begun disclosing the environmental impact of their businesses. The CDP is a successful example of companies sharing information about their operations. In their CDP reports, companies describe their operations, the nature of risks and opportunities they expect from climate change, the management structure and incentives they have in place to reduce their environmental footprint, and actual data on their energy use,
emission reduction projects. However, often it is not easy to discern the actual benefit of these emission reduction activities, whether these can be replicated elsewhere, and whether they make a significant dent in emissions. For example, automobile manufacturing companies may claim that they planted trees on a site adjacent to their factory to offset their direct and indirect emissions. Or an assembly plant may replace existing lighting by energy-efficient light bulbs, and claim that this reduced their CO2 emissions. To really understand the effect of such activities in a factory and to determine if there are any unintended side-effects, we need a model of a factory which operates like a typical global automobile factory so we can determine typical energy loads, and test various scenarios. Such a model can make it possible to compare and prioritize emission reduction activities.
1.3 Problem Statement
The goal of this thesis is to develop a model of a typical global automotive assembly plant to predict its direct and indirect energy usage and CO2
emissions. There have been surprisingly few studies on energy use in automobile manufacturing. The most comprehensive ones published over the past few years rely on data going back several decades. Nonetheless, we use this data as a starting point to construct our model. We validate the model by comparing the data to more recent data published voluntarily by automobile companies to the Carbon Disclosure Project (CDP) and in their sustainability reports. The CDP data on emissions are more detailed than the energy data. So we estimate CO2 emissions from the energy model and compare it with the
CDP data.
The ultimate utility of such a model would be in determining the impact of emissions reduction activities, or the effect of outside factors, like weather or
the carbon intensity of the electric grid, on factory emissions. To achieve this, we construct a simple bottom-up thermodynamic model of the automobile factory. We estimate the magnitude of heat loss in the winter (or gains in the summer) due to air exchange, transmission through walls, and other sources of heat drains (or gains). We can then evaluate scenarios like the effect of a warm winter on the heating load of a factory, the effect of moving a plant from one location to another, or installing more efficient lighting in the factory, to estimate their impact.
This thesis will also present several case studies of automobile manufacturing which illustrate important concepts like the heat-replacement effect in a factory to the move towards lightweight but more energy-intensive materials. We also show how publically available data, including the CDP data, can be used to build linear regression emissions models of major OEM factories. We can identify which factors are significant and how a company can operate different technology levers to reduce the carbon footprint of its factory.
1.4 Thesis Structure
This thesis is structured as follows. In Chapter two, we review existing literature on energy use in automobile manufacturing. Chapter three contains an introduction to the Carbon Disclosure Project and an analysis of automakers reports. Chapter four contains case studies of a component manufacturer and a vehicle assembler for whom we have some factory-level data. In Chapter five, we develop a model of a typical assembly plant. We also determine the level of vertical integration at such a plant. In Chapter six, we develop an energy model to determine the energy needed for heating and cooling activities in the factory. We then test the impact of various emission
S and the Volkswagen XL1 which represent a dramatic shift from conventional vehicles. Chapter eight concludes the thesis with our evaluation about the future of energy use in automobile manufacturing and use, and whether climate change targets can be achieved.
Chapter 2: Literature Review
Literature on automobile production broadly falls into the following mutually non-exclusive categories:
1. Automobile lifecycle assessment (LCA) studies, 2. Plant-level energy use surveys,
3. Bottom-up models of automobile production,
4. Aggregate motor vehicle production (sector-level or company-level) data.
Automobile lifecycle assessment (LCA) studies
Automobile LCAs are the most common studies on the topic. LCA studies have been done for different kinds of vehicles - fictional, generic vehicles (Sullivan 1998 [29]), to conventional gasoline vehicles (Schuckert et al's Polo
LCA [30]), to LCAs of hybrid and electric vehicles (Hawkins 2012 and Hawkins 2013 [31] [32]). The materials production and use phases of the automobile lifecycle are perhaps the best understood. Vehicle component production and final assembly are harder to analyze. This is because a typical
automobile consists of several hundred sub-assemblies and components, manufactured by a vast supply chain. So, actual data on component production or even vehicle assembly is difficult to gather. Nonetheless, Sullivan et al (1998) attempted to narrow down a 20,000 part vehicle into 644 components, and got data on energy use for some of the major components of an automobile. They also obtained actual energy data from assembly plants. Their results for energy use were 94 GJ per vehicle for materials production, and 39 GJ per vehicle for vehicle manufacture. The CO2 emissions were 4.4
tons C02 per vehicle from materials production, and 2.5 tons C02 per vehicle from vehicle manufacturing.
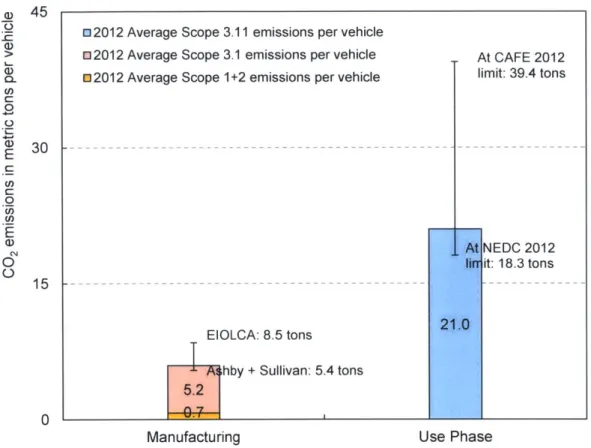
A different approach to LCA is the Economic Input-Output environmental LCA (EIOLCA) as used by Hendrickson et al [33]. It relies on economic interactions between various sectors of an economy. Various products can be analyzed for their environmental impact if its producer or purchaser price is known. For example, Samaras and Meisterling [34] used this model to determine the impact of a Toyota Corolla whose producer price they estimated to be $13,500. They use the 1997 producer price model and give a value of 102 GJ of primary energy use, out of which 22 GJ is electricity use, 26 GJ is coal use, 43 GJ is natural gas use, and 8.5 metric tons of CO2e associated with vehicle production. Note that this includes the entire automobile supply chain. If we use only CO2 (not CO2e), the result is 7.2 metric tons of CO2. The EIOLCA results tend to be higher compared to typical LCA estimates. This is partly because of the aggregate nature of the data, but also because EIOLCA includes lot more activities than a typical LCA. We often consider the EIOLCA estimate to be an upper bound.
Boyd et al [35] collected and analyzed three years of data from 35 assembly plants in the U.S to construct an Energy Star Energy Performance Indicator. They focused only on body weld, painting and final assembly activities, and presented electricity use and fuel use data. The mean value of electricity use per vehicle was 6.9 GJ per vehicle, and fuel use per vehicle was 4.8 GJ per vehicle. They found a strong correlation between energy use and parameters like vehicle wheelbase, weather conditions, and utilization. In this thesis, we will use a similar approach to construct a regression model for emissions from factories.
Galitsky et al [18] reviewed published data to get some rough estimates of electricity use in vehicle assembly plants, and a simple breakdown of fuel use in the factory. They quote a value of 9.2 GJ per vehicle of electricity use. Using the MECS data, they estimate fuel use for automobile production to be 6.8 GJ per vehicle. Their work is cited by others who attempt to construct bottom-up models of assembly plants.
Bottom-up models of automobile production
One of the earliest efforts to construct a bottom-up energy use model of automobile assembly was by Brown et al in 1985 [36]. Their analysis was based on by sector-level surveys like the Annual Survey of Manufacturers (ASM). They developed process flow diagrams for "Motor Vehicles and Car Bodies" as well as "Motor Vehicles Parts and Accessories" sectors under the old Standard Industrial Classification (SIC). Visits to two factories for each sector informed this process. They present mass, heat and energy flow diagrams normalized by weight of the vehicle. Their estimates for production energy use are electricity use of 31 GJ per vehicle, and fuel use of 25 GJ per vehicle. These values are much greater than other sources. This approach
to support the argument that automobile assembly energy use has a strong correlation to vehicle weight.
The most comprehensive model of energy use in automobile manufacturing is developed by Sullivan et al [20], and called the VMA (part manufacturing and vehicle assembly) model. They were able to account for 92.5% of a vehicle's weight by considering the major materials and transformation processes. They found value from literature for each material-transformation pairing. When data on a certain material was not available, they represent the material by a "surrogate" material. Most importantly, they use data from Galitsky et al to represent the base load energy in an assembly plant - for heating, HVAC, lighting and compressed air. However, similar data for plants making components is hard to find. Their estimates for automobile energy use and emissions are 13.8 GJ and 852 kg
CO
2. Including materialtransformation, the estimates are 32 GJ and 1.9 tons C02. However, they used a high value of carbon intensity of the electric grid, about 0.77 kg CO2
per kWh. So the CO2 estimate might be on the high side.
The Argonne National Laboratory's "Greenhouse gases, Regulated Emissions, and Energy Use in Transportation (GREET)" model combines data on vehicle assembly from Boyd with data on unit processes like stamping from other sources. For vehicle assembly, they cite Sullivan's VMA model. Their model is fairly easy to use and can compare different types of vehicles' lifecycles. The assembly data is common to all vehicles, so the differences lie mostly in materials and use phases [37].
Aggregate motor vehicle production (sector level or company level) data
For U.S sector-level information on energy use, we refer to the Manufacturers Energy Consumption Survey (MECS) published by the U.S Energy Information Administration. The survey, conducted approximately every four years, goes back to 1985. In the more recent survey from 2006, over 15,000 establishments, representing some of the largest companies by payroll, were included. The survey is mandatory and it collects information on energy consumed by end use, region, and fuel type. For automobile manufacturing, we look at sectors 3361111 Automobile Manufacturing, and 336112 Light Truck Manufacturing, under the North American Industry Classification System (NAICS). For some sectors, data on Canadian and Mexican manufacturing is included, but the auto sectors only consider U.S manufacturing. In 2006, the two sectors combined consumed 80 trillion BTU of energy (this includes net electricity and is not primary energy). We get automobile production data from other sources, and we estimate that the fuel use per vehicle produced was 5,060 MJ, and electricity use was 8,174 MJ per vehicle (primary energy) [16].
Company-level emissions information can be obtained from the CDP and sustainability reports. The CDP observes the Greenhouse Gases Protocol in defining sources of emissions. Scope 1 emissions or direct emissions are those arising from use of fuels on-site. Scope 2 emissions or indirect emissions are from purchased fuels and electricity. Scope 3 emissions are also indirect emissions but arising from business activities like emissions associated with purchased goods, business travel, use of sold products etc. Companies also may report division-level or company-level energy use by fuel source. However, these are not further split by end-use and it is difficult to analyze these numbers meaningfully. We discuss CDP reports in detail in Chapter 3.
The existence of a base load component and a variable component to equipment or factory energy use has been shown before [38]. Bolin [39] investigated energy use in an engine production facility and found a similar pattern of energy use. We extend Bolin's analysis for the engine production plant, discovering unintended consequences of increased production, and utilize the observations of base loads and process loads in constructing a model of a typical automobile assembly plant.
While models of automobile assembly plants have been developed before, it has been difficult to make comparisons between plants, accounting for variables like utilization, vehicle type, and weather conditions. Moreover, a comparison of the models with recent factory data has been missing. Finally, analysis of emission reduction activities has not received enough attention. This is in part because robust thermodynamic models of assembly plants have not been constructed. In this research, we address these deficiencies. A more in-depth look at assembly plant thermodynamics and an exergy analysis of automobile plants is being undertaken by Schmieder [40].
A summary of the references mentioned here, and a breakdown of the energy use they provide by end-use is given in Appendix A.
Chapter 3: Analysis of CDP Reports
In this chapter, we give an introduction to the Carbon Disclosure Project (CDP) and then study disclosures made by select automakers in the past few years. Some trends on emissions and energy use become apparent. In chapter 5, we will use the CDP data to test our assembly plant model. This chapter is based on work done by Eaton and Raykar for the MIT class 2.83 in the spring of 2014 [41]. We also benefited from data compiled by students in that class for several automobile companies.
3.1 Introduction to the CDP
The CDP is a London-based non-profit whose mission is to "transform the global economic system to prevent dangerous climate change and value our natural resources by putting relevant information at the heart of business, investment, and policy decisions" [42].
In order to advance its mission, the CDP provides "the only global system for companies and cities to measure, disclose, manage and share vital
change, water and forest impacts, goals, risks, and opportunities. In order to motivate company participation, the CDP uses the backing of institutional investors [43].
The CDP is known for its fast growth and high participation rate. Figure 3.1 shows the increase in total responses for the sum of the Climate Change and Supply Chain (starting in 2008) programs. For the first three years, only the Financial Times' Global 500 list of companies received questionnaires. Participation quickly grew to over 70% (and was 81% in 2013) [44] [45]. After 2007, the response rate dropped and remained relatively flat thereafter. However, in each of these years significantly more companies were targeted [44]. In general, a public participation rate tends to increase the year after being targeted. Companies have been increasing participation in other ways as well. For example, from 2011 to 2013 the number of Global 500 companies reporting emissions verification doubled to 71% [45]. Of course, it has not been a steady path towards increased disclosure. Most companies continue to not report Scope 3 emissions (besides business travel). And in a particularly striking case, the percentage of U.S firms reporting Scope 1 emissions dropped from 82% in 2009 to 25% in 2010 [44]. 5000 -o>N
4000
---0C 2030 0 3 2--4-2----2----2--7-2----2----201o 2 11-2- 12 CL NT (1)C0 (IC) 2 0 0 0 -- - - --- - -1000 --- --- --M) cr (O 2003 200 200 20620 0820921 0121Figure 3.1: Total number of responses for the Climate Change and Supply Chain programs
3.3 CDP Questionnaire
The CDP questionnaire is divided into three main modules: Introduction, Management, Risks and Opportunities, and Emissions. The introductory module asks for general description of the organization, the year for which the data is being reported, the list of countries for which data will be provided, and the currency in which financial information will be reported. Here we will only focus on the Emissions module.
Emissions Reporting
Sections 7 to 14 of the questionnaire deal with emissions reporting. A few questions deserve special mention. Section 7.2 asks for the methodology or protocol being used to collect Scope 1 and 2 emissions data. Scope 1 emissions are the emissions arising from consumption of fuel on-site. The on-site energy is supplied by burning fuels, usually natural gas, on the factory premises. Scope 2 emissions are arising from purchased and consumed energy, often electricity. Section 7.3 asks for a reference used to determine Global Warming Potentials (GWP) of different emissions.
Section 8.1 deals with how boundaries are drawn by the company to determine Scope 1 and 2 emissions. Companies typically use Financial Control or Operational Control boundaries. Sections 8.2 and 8.3 are where the Scope 1 and 2 emissions will be entered. Section 8.6 asks to report the status and standards used for verification of emissions reporting. The CDP accepts several standard of emissions verification, including the California Mandatory GHG Reporting Regulations standard, the Climate Registry's
In sections 9 (and 10), Scope 1 (and Scope 2) emissions can be reported on per country and by business division or facility-wise basis. Section 11 deals with the use of direct and indirect energy. In section 11.1, companies can report what fraction their energy costs are of their operational costs. Section 11.2 asks for a breakdown of electricity, fuel, steam, heating and cooling energies in MWh. The type of fuel use is elaborated in section 11.3.
In section 12.1, the reasons for changes in emissions values are listed. These could be due to emission reduction activities, mergers, divestments, changes in boundaries, changes in methodologies or other reasons. In sections 12.2 and 12.3, emissions are reported on a per unit revenue, and per full time equivalent employee basis. Automobile companies also often choose to report emissions on a per vehicle basis in section 12.4.
Note that carbon removal efforts (say, by planting trees) are not to be included in section 12.1. These efforts can be reported as additional information, but section 12.1 only deals with emission reduction efforts.
In section 14, Scope 3 emissions are documented. Scope 3 emissions are segmented into 15 categories, including purchased goods and services, business travel and use of sold products. The flexibility of the CDP questionnaire allows companies to use various methods to determine these emissions.
Of particular interest from an automobile manufacturing perspective is the purchased goods and services section (called Scope 3.1). An automobile is assembled from hundreds of sub-assemblies which in turn may have several hundred parts. Auto companies source these components from hundreds of suppliers. This makes it challenging to actually measure CO2 emissions from part manufacturing. Thus, companies typically use Life-Cycle Assessment (LCA) to get an estimate of the Scope 3.1 emissions. In 2013, BMW, Daimler, Nissan, Renault and Volkswagen reported using LCA software to determine
Scope 3.1 emissions. Since companies usually know the material content and processing steps involved in making the car components, this can lead to a reasonably good estimate. Some companies also participate in the CDP's Supply Chain Program which applies the emissions reporting questionnaire to the upstream supply chain. General Motors (GM) is one such company, requesting its suppliers to document and report their emissions. As was said before, this is a challenging activity, and in 2013, GM reported that its estimate covered only 10% of its suppliers.
Several studies have shown that the use of sold products constitute the significant fraction of lifecycle emissions from an automobile. Burnham et al report that over a lifetime of an internal combustion engine vehicle, vehicle operation constitutes 73% of CO2 emissions, the fuel production and
distribution constitutes 16%, and the vehicle, and the vehicle manufacturing (from raw material extraction to final assembly) constitutes 11%. Regulations in several countries also require companies to make efforts to reduce the emissions from combustion of fuel by the vehicles. Companies typically report the use of sold products emission value by determining the well-to-tank emissions which relate to the production and distribution of gasoline or diesel, and the tank-to-wheel emissions for the fleet of vehicles sold in the preceding year.
AU section
Automakers are asked to provide additional information about their sales across different vehicle platforms and engine types in different regions, emissions from those vehicles (in gram CO2 per km or gram C02 per mile)
and the deployment of clean technologies in the vehicles. Sales-weighted CO2
emissions for different regions and vehicle segments are reported in sections AU2.3 and AU2.4
Section AU3.1 (a-h) offers choices of different clean technologies and companies can report what fraction of their fleet implements that technology. For I.C engine vehicles, the technologies include turbocharger downsizing, exhaust recovery and Flexfuel among other options. For hybrid vehicles, choices include start and stop regenerative braking, full hybrid or plug-in hybrid.
Sustainability Reports
Many automobile companies have begun publishing sustainability reports in recent years. Often, companies extend their corporate social responsibility (CSR) reports to add environmental management data, describing how their design and manufacturing processes incorporate environmental-friendly thinking. We rely on sustainability reports to fill in gaps when data from CDP reports is incomplete.
3.4 Data Analysis
This section contains the analysis of the data gathered from CDP reports. In some cases, data was drawn from sustainability reports of the company. For example, if a company disclosed information to the CDP but did not make it public (for example, Volkswagen in 2012), or if an error was observed in a CDP report but the sustainability report seemed to have the right number, the sustainability report number was chosen. And in cases where a company did not report data to the CDP (for example, Fiat and Ford in 2008) but disclosed that information in their sustainability reports, that data was used. The CDP has restricted access to the 2010 CDP reports, but it has published summary of the data, which along with sustainability reports was used to populate the 2010 numbers.
Of the companies studied over the course of the MIT class, the eleven companies studied here have the most complete data - geographically and over time. Usually, the parent company discloses information of all its divisions and subsidiaries and so we see some consolidation in the numbers. For example, Audi's and Lamborghini's numbers are published by Volkswagen, and Fiat's results include data for Chrysler (from 2011) and Maserati.
Figure 3.2 shows the annual global production of eleven automobile companies from 2008 to 2012 [46]. With the exception of Hyundai and Fiat, all companies reduced production in response to the global recession which struck in 2008-09. Since 2009, companies have largely returned to their pre-recession production levels, and in some cases exceeded those levels. The smallest automaker in terms of production numbers studied here is BMW with 2 million vehicles, and the largest is Toyota with 10.1 million vehicles produced in 2012. We notice some other large shifts in this plot. Fiat's production numbers increase by more than 2 million after it formed an alliance with the Chrysler group. And the effect of the 2011 Fukushima earthquake in Japan and the floods in Thailand on Honda, Toyota, and to some extent Nissan is evident.
12 -o-BMW --- Daimler -+Fiat -+-Ford
-GM --- Honda -- Hyundai -0-Nissan
- Renault -e- Toyota o Volkswagen
c 10 --- -- - - - - -- - -- --- - - --- - - -- -- ---C 0 -0 00 0 2008 2009 2010 2011 2012 Production Year
Figure 3.2: Global production numbers from 2008-2012 for eleven automakers
Figure 3.3 shows the absolute emissions reported by auto companies from 2008 onwards [47] [23] [48] [49] [50] [51] [52] [53] [54] [55] [56]. There are a few missing data points: Renault's 2009 absolute emissions could not be found from their CDP or sustainability reports. GM's emissions data are available from the year 2010. Daimler's numbers are reported only from the year 2010 onwards because prior to that they did not disclose information to the CDP, and it is not possible to separate Daimler's passenger vehicle data from that of their trucks and heavy commercial vehicles.
10
S -e- BMW -e- Daimler -Fiat -+- Ford
C
o --- GM --- Honda -- Hyundai -e- Nissan
C -Renault -0-Toyota o Volkswagen
0 0 8 --- - - -- - - - - - - --- ---0 C 2 -LU 00 0 0 0 U) 0 0. 0IF 0 2008 2009 2010 2011 2012 Production Year
Figure 3.3: Absolute Scope 1+2 emissions from 2008-2012 for eleven
automakers
Comparing Figure 3.2 and Figure 3.3 we notice some outliers. Toyota's
reported emissions stayed almost constant from 2009 even though their
production volume went from 7.2 million to 10 million in that time period.
BMW, Daimler and Fiat reported a decrease in absolute emissions from 2011
to 2012 though their production volumes increased over that time frame.
These companies attribute this reduction -- BMW (5.1%), Daimler (6.4%) and
Fiat (4.2%) -- to emissions reduction activities. Along the same lines, Ford's
absolute emissions fell by 3.2% from 2010 to 2011 although its production
volumes increased by 3.1%. Ford attributes this to emissions reduction
activities, particularly to the implementation of "Three Wet" painting
technology which it claims reduces CO2 emissions by 40%. The boundaries of
this project are not clear from Ford's CDP report. Meanwhile, Honda's