AFPP – 22e CONFÉRENCE DU COLUMA
JOURNÉES INTERNATIONALES SUR LA LUTTE CONTRE LES MAUVAISES HERBES DIJON – 10, 11 ET 12 DÉCEMBRE 2013
COMPETITION AND FACILITATION EFFECTS
OF DIFFERENTIAL INTRA- AND INTER-ROW WEED MANAGEMENT IN SUGARCANE
J. MARTIN (1), M. CHABALIER (2), P. LETOURMY (3), J.-L. CHOPART (4), E. ARHIMAN (5), D. MARION (6)
(1) CIRAD, UR SCA, F-97400 Saint Denis, La Réunion, jose.martin@cirad.fr (2) eRcane, F-97494 Saint Denis, La Réunion, chabalier@ercane.re (3) CIRAD, UR SCA, F-34000 Montpellier, philippe.letourmy@cirad.fr (4) CIRAD, UR SCA, F-97170 Petit-Bourg, Guadeloupe, jean-louis.chopart@cirad.fr
(5) eRcane, F-97494 Saint Denis, La Réunion, arhiman@ercane.re
(6) CIRAD, URSCA / eRcane, F-97494 Saint Denis, La Réunion, marion@ercane.re
SUMMARY
Differential intra- and inter-row weed management can be a mean to reduce herbicide use in sugarcane. In 2011, a field experiment was conducted in La Reunion Island to assess inter-row weed competition. Four inter-row weed competition treatments for a duration of one (T1), two (T2), three (T3) and four (T4) months after planting were compared in a randomized complete block design with 5 replicates; treatment plots were paired with non-weeded inter-row control plots. All intra-rows where kept weed-free all season long. Weeds covered 100% of the inter-rows by three months after planting. Sugarcane grew far above the weed canopy, completely closing the canopy between the rows for all treatments. Sugarcane yield decreased by 13 t/ha/month of early weed competition. However, the control yield, expected to be lower than T4, was similar to the T3 treatment. This suggests a late facilitation effect of the inter-rows vegetation in control plots which partially compensates for its early competition effect. This may be due to the particular flora of our experiment, with high populations of N-fixing weeds and broom weeds. The root length density profiles observed in a couple of plots may support the facilitation hypothesis. However, additional research is needed to corroborate this singular result.
Keywords: sugarcane, differential weed management, competition, facilitation, root profile.
RÉSUMÉ
Une gestion rang inter-rang différenciée pourrait générer des économies d’herbicides en culture de canne à sucre. En 2011 à La Réunion, dans un essai de nuisibilité sur canne vierge à rangs maintenus propres, les adventices des inter-rangs ont amputé le rendement en canne à sucre de 10% par mois de concurrence précoce pendant les quatre premiers mois du cycle. Le rendement des témoins à inter-rangs non désherbés a été significativement supérieur au traitement ayant subi quatre mois de concurrence. Une compensation partielle et tardive de la concurrence précoce est donc intervenue, ce qui suggère des phénomènes de facilitation de la part des adventices confinées dans les inter-rangs sous la canne jusqu’en fin de cycle. La flore atypique de l’essai dominée par des fixatrices d’azote et des malvacées connues pour la puissance de leur enracinement pivotant pourrait être en cause ; les profils de densités de longueur racinaire réalisés sur un couple de parcelles ne sont pas incohérents avec cette hypothèse qui reste à vérifier.
Mots-clés : canne à sucre, désherbage différencié, concurrence, facilitation, profil racinaire.
Advertising: this paper provides a root distribution analysis by Dr. Chopart in addition to the paper
previously presented to the XXVIII ISSCT Congress held in São Paulo (BR), 24-27 Jun 2013.
Avertissement : article présenté au congrès ICSST de juin 2013 à Sao Paulo (BR) enrichi pour la
INTRODUCTION
Differential intra- and inter-row weed management can be a mean to reduce herbicide use in sugarcane. For example, herbicides could be applied as a stripe over the rows and mechanical cultivation implemented between the rows. Inter-cropping of non-creeping legumes as cover-crops or managing the spontaneous vegetation between the rows can be further options.
Most studies show that the critical period of weed competition for sugarcane is the period of crop establishment, from spiking to the “out-of-hand stage” (McMahon et al., 2000), i.e. mainly between one and four months after planting for plant-cane crops (Marion et Marnotte, 1991; Azania et al., 2010). During this period before canopy closure, yield losses commonly ranged between 10 and 12% per month of weed competition. These results were obtained from conventional trials with mixed weed populations and without separation of intra- and inter-row competition.
A field experiment was designed in La Reunion Island to assess inter-row weed competition on sugarcane. The weediness and weed flora of sugarcane fields in Reunion Island are quite well known (Le Bourgeois et al., 2004 ; Lebreton et al., 2009). Weed management relies mainly on chemical control (Marnotte et al., 2010 ; Martin et al. , 2013).
MATERIALS AND METHODS
The experiment was conducted in 2011 in sub-humid lowlands to assess sugarcane yield losses from inter-row weed competition by keeping the intra-rows free of weeds. The experiment was established in a field left as a weedy fallow for 10 years, submitted to moderate grazing and periodic crushing-mowing, where broadleaves weeds became dominant. Conventional cultivation was used for soil preparation. NPK fertilizers were pre-plant applied in the furrows according to soil testing recommendations. The sugarcane cultivar used was ‘R579’. The field was sprinkler-irrigated as needed throughout the growing season. Four treatments T1, T2, T3, and T4 were compared, with inter-row weed competition occurring for (and stopped at) one, two, three and four months after planting, respectively in a randomized complete block design with 5 replicates. Each of these 20 plots was paired at random with an adjacent control plot, whose inter-rows were not weeded for the entire season.
Just after planting, a broadcast application of a non residual, contact herbicide killed the first emergence of weed seedlings before planting, in order to measure the effect of weed competition from planting to harvest. Row spacing was 1.5 m and space allocated to intra- and inter-rows was equally divided. All intra-rows (including those of the control plots) where kept weed-free all season long, using labeled PRE and POST herbicides in stripe applications over the rows (three applications at 14, 43 and 65 days after planting). By mid-season, intra-row colonization by weeds coming from rows in T4 and control plots – mainly vines - was prevented by pushing them back to the inter-rows (up to three times on control plots). For T1 to T4 treatments, inter-inter-rows weed competition was stopped at the respective treatment time and kept weed-free by hand hoeing and hand pulling after weed removal.
Weeds species present in the field are listed in Table I. The percentage of ground covered by weeds in the inter-rows and the percentage of each weed species were assessed visually in each plot, every month until the seventh month (with the exception of the sixth month). The weed biomass in the inter-rows was assessed by harvesting and measuring the dry weight of 3.75 m² areas for T2, T3 and T4 treatments at the end of their respective time of weed competition for cane. Regarding the control plots, dry weight of weeds was also assessed in a lateral inter-row at five, six and seven months after planting. The most abundant species were weighted separately as far as possible. Tillering and stalk elongation were measured monthly; sugarcane was harvested 9.5 months after planting and cane yields were assessed by weighing the two central rows of each plot. Tillering, stalk elongation, cane yield (and difference with control plots) were statistically analyzed with linear models (analysis of variance or covariance and regression analysis), using the GLM procedure of SAS software (SAS Institute Inc. 2002-2011).
Table I: Botanical names and family of weeds present at the study location. Functional groups are relative to their contribution to global coverage (Figure 1) and global biomass (Table II).
Les adventices de l’étude. Les groupes fonctionnels renvoient à leur contribution au recouvrement global (figure 1) et à leur biomasse (tableau II)
Botanical name Family Functional groups
1 Cyperus rotundus Cyperaceae Geophyte plant (as sedge)
2 Brachiaria nana Poaceae Grasses
3 Cenchrus biflorus Poaceae Grasses
4 Digitaria ciliaris Poaceae Grasses
5 Eleusine indica Poaceae Grasses
6 Melinis repens Poaceae Grasses
7 Panicum maximum Poaceae Grasses
8 Paspalum dilatatum Poaceae Grasses
9 Rottboellia cochinchinensis Poaceae Grasses 10 Sorghum verticilliflorum Poaceae Grasses
11 Commelina benghalensis Commelinaceae Commelina benghalensis
12 Achyranthes aspera Amaranthaceae Amaranthaceae + Solanaceae 13 Amaranthus dubius Amaranthaceae Amaranthaceae + Solanaceae 14 Amaranthus viridis Amaranthaceae Amaranthaceae + Solanaceae 15 Bidens pilosa Asteraceae Asteraceae + others broadleaf weeds 16 Parthenium hysterophorus Asteraceae Asteraceae + others broadleaf weeds 17 Sigesbeckia orientalis Asteraceae Asteraceae + others broadleaf weeds 18 Cleome viscosa Brassicaceae Cleome viscosa
19 Ipomoea eriocarpa Convolvulaceae Vines 20 Ipomoea hederifolia Convolvulaceae Vines
21 Ipomoea nil Convolvulaceae Vines
22 Ipomoea obscura Convolvulaceae Vines
23 Acalypha indica Euphorbiaceae Euphorbiaceae 24 Croton bonplandianus Euphorbiaceae Euphorbiaceae 25 Euphorbia heterophylla Euphorbiaceae Euphorbiaceae 26 Euphorbia hypericifolia Euphorbiaceae Euphorbiaceae 27 Phyllanthus amarus Euphorbiaceae Euphorbiaceae 28 Cajanus scarabaeoides Fabaceae N-fixing Fabaceae 29 Centrosema pubescens Fabaceae N-fixing Fabaceae 30 Crotalaria retusa Fabaceae N-fixing Fabaceae 31 Desmanthus virgatus Fabaceae N-fixing Fabaceae 32 Desmodium intortum Fabaceae N-fixing Fabaceae 33 Desmodium tortuosum Fabaceae N-fixing Fabaceae 34 Indigofera hirsuta Fabaceae N-fixing Fabaceae
35 Mimosa invisa Fabaceae N-fixing Fabaceae
36 Mimosa pudica Fabaceae N-fixing Fabaceae
37 Senna occidentalis Fabaceae within others broadleaf weeds 38 Hibiscus surattensis Malvaceae Vines (as creeping plant) 39 Malvastrum coromandelianum Malvaceae Broomweeds Malvaceae 40 Melochia pyramidata Malvaceae Broomweeds Malvaceae
41 Sida acuta Malvaceae Broomweeds Malvaceae
42 Sida glutinosa Malvaceae Broomweeds Malvaceae 43 Oxalis corniculata Oxalidaceae Geophyte plant
44 Argemone mexicana Papaveraceae Asteraceae + other broadleaf weeds 45 Passiflora foetida Passifloraceae Vines
46 Portulaca oleracea Portulacaceae Asteraceae + other broadleaf weeds 47 Cardiospermum halicacabum Sapindaceae Vines
48 Solanum americanum Solanaceae Amaranthaceae + Solanaceae 49 Solanum lycopersicum Solanaceae Amaranthaceae + Solanaceae 50 Solanum nigrum Solanaceae Amaranthaceae + Solanaceae 51 Striga asiatica Scrofulariaceae none (parasitic plant, scarse)
Root mapping and distribution were assessed 5.4 months after planting in two adjacent plots including a T1 treatment and its adjacent control using the trench-profile method (Chopart et al., 2008 ; Azevedo et al., 2011). Roots interceptions (RI) were counted using a grid with a 5 x 5 cm mesh, down to a depth of 1.2 m over 1.5 m wide soil profiles. Sugarcane roots and weed roots were not distinguished at counting. RI values were processed using RACINE2 software application in order to assess root length densities (RLD) (Chopart et al., 2009).
RESULTS
Weeds covered 96% of the inter-rows two months after planting, reaching 100% cover at around 3 months and then declining to 96% at 7 months in non-weeded treatments (Figure 1). Weed composition was quite diverse (Table I), but at 4months N2-fixing weeds (9 among 10 Fabaceae) and
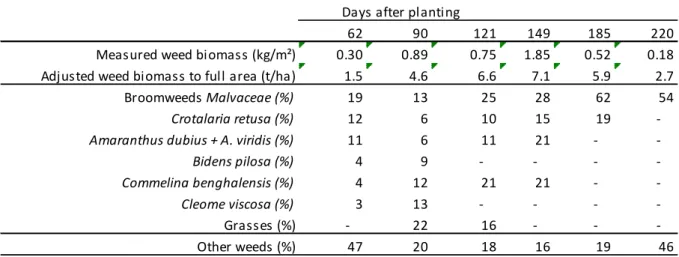
broomweeds (4 among 5 Malvaceae) became dominant, accounting for approximately 30 and 32% of total coverage at 7months, respectively (Figure 1). Weed biomass (dry matter) reached a maximum of 1.8 kg/m² in the inter-rows of the control plots five months after planting; when adjusted to a curvilinear model and extrapolated, this maximum value becomes 7.1 t/ha (Table II). At 6 months, broom weeds and Crotalaria retusa accounted for 62 and 19% of weed biomass, respectively (Table II). N2-fixing Fabaceae other than C. retusa were not separated from other weeds because of their
voluble, spiny or sticky traits.
Figure 1: Inter-row weed coverage (%) and number of species (red bars) of treatment plots before their weeding at 1, 2, 3 and 4 months plus control plots. All intra-rows, including those of control plots, were kept weed-free using chemical plus manual control.
Recouvrement moyen (en %) et nombre d’espèces (barres rouges) dans les inter-rangs avant leur désherbage à 1, 2, 3, 4 mois et des parcelles témoins. Tous les rangs de canne, y compris ceux des témoins, ont été maintenus propres par voie chimique ou manuelle.
0 5 10 15 20 25 30 35 40 45 50 0 10 20 30 40 50 60 70 80 90 100 0 31 60 91 121 152 182 213 % W e e d c o v e ra g e
Days after planting
Number of species and composition of weed coverage of the inter-rows
N-fixing Fabaceae Broomweeds Malvaceae Euphorbiaceae
Amaranthaceae + Solanaceae Asteraceae + others broadleaf weeds
Cleome viscosa
Vines (+ Hibiscus surratensis) Commelina benghalensis Annual and perennial grasses Sedges (+ Oxalis corniculata)
N u m b e r o f sp e ci e s
Table II: Total biomass of weeds in the inter-rows and contribution of some specific weeds or group of weeds to the total biomass (%). Missing values correspond to an apparent declining contribution of the referred species or groups.
Biomasse d’adventices dans les interlignes et contribution de certaines espèces ou groups d’espèces à la biomasse totale (%). Les valeurs manquantes correspondent à une contribution apparemment en baisse de l’espèces ou groupe considéré.
Sugarcane height was far above weed canopy by mid-season, completely closing the canopy between the rows for all treatments. Overall, sugarcane tillering (Table III) and production were significantly reduced by weed competition. Stalk elongation and sugar content were not affected by weed competition (results not shown).
The effect of the duration of weed competition was highly significant on sugarcane tillering (p < 0.0001 at 3 and 6 months after planting) despite one significant effect of the initial shoot emergence rate on tillering (p = 0.006 and p = 0.015). Effects other than initial shoot emergence rate and duration of weed competition were not significant (not shown).
Table III: Sugarcane tillering at 3 and 6 months after planting. Tallage de la canne à sucre 3 et 6 mois après plantation. Time after planting Average
(number of tillers / m)
Initial shoot emergence rate effect (covariance analysis)
Duration of weed competition effect
3 months 17.8 P = 0.006 P < 0.0001
6 months 13.6 P = 0.015 P < 0.0001
Sugarcane yield was 131 t/ha for T1 and significantly decreased by 13.5 t/ha/month for consecutive months of early competition through T4 (p = 0.0015, Figure 2-A). The differences observed between the treatments and their respective control plots ranged from +33 t/ha for T1 to -23 t/ha for T4; a significant decrease (p = 0.0029) of 17.2 t/ha/month was recorded for consecutive months of early competition from T1 to T4 (Figure 2-B). The checking of treatments minus control yield differences showed (Table IV) that T1 was significantly superior to control (T4-control > 0) and T4 was significantly inferior to control (T4-control < 0) whereas T3 minus control and T2 minus control were not significantly different from zero.
Days after planting
62 90 121 149 185 220
Measured weed biomass (kg/m²) 0.30 0.89 0.75 1.85 0.52 0.18
Adjusted weed biomass to full area (t/ha) 1.5 4.6 6.6 7.1 5.9 2.7
Broomweeds Malvaceae (%) 19 13 25 28 62 54
Crotalaria retusa (%) 12 6 10 15 19
-Amaranthus dubius + A. viridis (%) 11 6 11 21 -
-Bidens pilosa (%) 4 9 - - -
-Commelina benghalensis (%) 4 12 21 21 -
-Cleome viscosa (%) 3 13 - - -
-Grasses (%) - 22 16 - -
Figure 2: A - Average sugarcane yields (blue bars) and linear regression of treatment yields over the 20 plots (y, t/ha) against time of weed control (x, months); B - Average yield differences between treatments and their control plots (red bars) and linear regression of the 20 yield differences (y, t/ha) against time of weed control (x, months). MAP: months after planting. A - Rendements moyens en canne à sucre (barres bleues) et régression linéaire des rendements individuels (20 parcelles) (y, t/ha) sur la durée de concurrence des adventices (x, mois) ; B – moyennes des différences de rendements entre les traitements et leurs témoins adjacents (barres rouges) et régression linéaire des 20 différences de rendements (y, t/ha) sur la durée de concurrence des adventices (x, mois). MAP : mois après la plantation.
Table IV: Confidence intervals at p=0.05 for the yield differences predicted by the equation of regression from figure 2-B [y (yield difference, t/ha) = -17.16x (months) + 47.24]. Intervalles de confiance à p=0.05 des différences de rendement calculées avec l’équation de régression de la figure 2B [y (différence de rendement, en t/ha) = -17.16x (en mois) + 47.24].
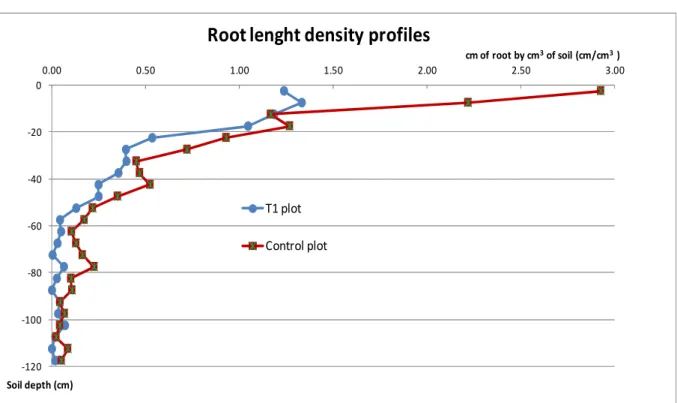
RLD profiles observed in a single T1 plot (as weeded sugarcane) and its adjacent control plot (unweeded inter-rows) at 5.4 months after planting are shown in Figure 3. The mean RLD values for the T1 plot were 1.20, 0.42 and 0.06 cm/cm3 in the 0-20, 20-40 and 40-120 cm layers, respectively. In contrast, the control plot (sugarcane plus weeds roots) exhibited higher RLD values over the profile, with +156%, +150% and +236% in the 0-20, 20-40 and 40-120 cm layers, respectively. However, these differences are not supported by statistical analysis (no replicated lectures). These differences can obviously be due to the weeds, particularly those with strong taproots dominant in this trial (N-fixing weeds and broomweeds). However, this assumption is not supported by differential counting of sugarcane roots versus weeds roots.
T1 (weeding at 1 MAP) T2 (weeding at 2 MAP) T3 (weeding at 3 MAP) T4 (weeding at 4 MAP) Treatments 131 117 109 91 y = -13,5x + 142,5 P = 0,0015 0 20 40 60 80 100 120 140 C a n e y ie d s (t /h a )
A - Cane response to delayed weed control
y = -13.5x + 142.5 p = 0.0015 T1 (weeding at 1 MAP) T2 (weeding at 2 MAP) T3 (weeding at 3 MAP) T4 (weeding at 4 MAP)
Differences from control 33.1 5.3 2 -23
-30 -20 -10 0 10 20 30 40 C a n e y ie d s (t /h a )
B- Treatment minus control differences
y = -17.16x + 47.24 p = 0.0029
Predicted yield differences (sugarcane, t/ha)
differences predicted value standard error confidence interval (p=0.05)
T1 - control 30.1 9.3 10.5 49.7
T2 - control 12.9 6.1 0.1 25.8
T3 - control -4.2 6.1 -17.1 8.6
The RLD of the control plot reached +200% when compared with the T1 plot in the 0-10 cm layer (Figure 3), with a maximum value of 2.92 cm/cm3 in the upper 5 cm layer. This contrasted distribution pattern in the upper soil supports the existence of a strong early weed competition for sugarcane in this surface layer. This assumption is also consistent with the depth of the furrows opened for sugarcane plantation (around 15 cm): sugarcane cannot develop significant rooting upon this depth. In contrast, sugarcane roots could have a stronger development in depth, as a response to the strong early weed competition in the surface layer.
RLD values decreased rapidly in depth, with values lower than 0.5 cm/cm3 at 25 cm depth in the T1 plot, and at 50 cm depth in the control plot. Thus, competition relations between roots, either belonging to sugarcane or weeds in the case of the control plot, probably decreased too.
Finally, the main trait resulting from this comparison of RLD profiles in a couple of trenches by mid-season is that the association of strong sugarcane in the intra-rows with limited weeds in the inter-rows probably originated a higher density of mixed roots over the profile.
Figure 3: Profiles of root lenght density (RLD) expressed as cm of roots by cm3 of soil, in a couple of adjacent plots belonging to T1 treatment (weeded sugarcane in the intra-rows plus weeded inter-rows) and the control treatment (weeded sugarcane in the intra-rows plus unweeded inter-rows) at 5.4 months after planting. For the control plot, RLD included both sugarcane and weed roots without distinguishing them.
Profils de longueur de racines (RLD, en cm de racines par cm3 de sol) observés sur un couple de parcelles adjacentes, correspondant à la modalité T1 (propre) et à son témoin adjacent (rangs de canne propres et inter-rangs non désherbés) 5,4 mois après la plantation. Sans distinction des racines de canne et d’adventices pour le témoin.
-120 -100 -80 -60 -40 -20 0 0.00 0.50 1.00 1.50 2.00 2.50 3.00 Soil depth (cm) cm of root by cm3of soil (cm/cm3)
Root lenght density profiles
T1 plot Control plot
DISCUSSION AND CONCLUSION
Results from this study were similar to those of Marion and Marnotte (1991) in terms of weed and maximum cane biomass accumulation, despite the fact that their study was conducted in quite different conditions and harvested at 12.7 months versus 9.5 for this study. The cane yield reduction documented with total intra-row weed control in this study is almost as high as Marion and Marnotte (1991) recorded without intra-row weed control (-13.5 versus -14.5 t/ha/month of exposure to weed competition). Thus, mitigation of weed competition by intra-row weed control above ground is probably less than proportional to the space allocated to the intra-row: we observed in some soil profiles evidence that weed roots coming from inter-rows colonize intra-row space and meet sugarcane roots.
However, the average yield of our control plots (whose inter-rows were kept unweeded over the cycle), logically expected to be lower than T4 (whose inter-rows were weeded at four months after planting), were significantly higher than T4 (p = 0.05), reaching the yield level of T3. This finding suggests a late facilitation effect of the inter-row vegetation in control plots which partially compensated for an early competition effect. This may be due to the particular flora of our study, with high populations of N2-fixing weeds and broomweeds, probably associated with a higher global
root length density over the soil profile, as observed in this study by the observation of a single couple of trench-profiles by mid-season. Could this higher density of mixed roots over the profile be involved in and responsible for the partial yield compensation significantly recorded in the control plots?
Additional research is needed (i) to corroborate the results in terms of yields over several cropping seasons, (ii) to assess the root distribution and the potential root extraction ratio for water and nutrients for sugarcane and weeds separately, and (iii) to investigate the diversity of facilitation processes involved.
ACKNOWLEDGMENTS
This research was conducted by ERCANE and CIRAD in La Reunion. It was supported by funding from Europe (FEADER) and France (ONEMA) for MAGECAR Project, and from CIRAD and ERCANE. Authors acknowledge Régis Goebel, Guillaume Lestrelin, Florent Tivet and Krishna Naudin for the revision of the manuscript.
REMERCIEMENTS
Cette expérimentation conçue et conduite par le Cirad et eRcane à La Réunion a été majoritairement financée par l’Union européenne (FEADER) et la France (ONEMA) à travers le projet MAGECAR. Les auteurs tiennent à remercier Régis Goebel, Guillaume Lestrelin, Florent Tivet et Krishna Naudin pour la relecture du manuscrit.
REFERENCES
Azania C.A.M., Rolim J.C. and Azania A.A.de P.M., 2010 - Plantas daninhas. In : Cana de açucar Dinardo-Miranda L.L., Machado de Vasconcelos A.C., Landell M. G. de A. IAC, Campinas (BR) 465-490.
Azevedo M.C.B., Chopart J.L., Medina de Conti C. 2011. Sugarcane root length density and distribution from root intersection counting on a trench-profile. Sci. Agric., v.68, 1, 94-101. Chopart J.-L. et al., 2009 - RACINE2: Software application for processing spatial distribution of root length density from root intersections on trench profiles, in: ISSR 7th Symp. Vienna.
Chopart J.-L., Rodrigues S.R., Azevedo M., Medina C., 2008 - Estimating sugarcane root length density through root mapping and orientation modelling. Plant Soil, 313, 101-112.
Le Bourgeois T., Lebreton G., Grillet N., Chiroleu F., 2004 - Caractérisation des enherbements en culture de canne à sucre à la Réunion. 19ème Conférence Internationale du Columa, Dijon, France,
AFPP. 8p.
Lebreton G., Le Bourgeois T., Marnotte P., 2009 - Effect of harvesting season of sugar cane on weed
growth dynamic in La Reunion Island. Effet de l'époque de coupe sur la dynamique de
développement de l'enherbement de la canne à sucre à la Réunion. XIIIe Coll. Internat. sur la biologie des mauvaises herbes, Dijon, France, 8-10 septembre 2009, AFPP : 153-162.
Marion D. & Marnotte P., 1991 - Nuisibilité de l'enherbement sur une culture de canne à sucre. Coll. AFCAS. 1ère Rencontre internationale en langue française sur la canne à sucre. 10-15 juin 1991, Montpellier (France), p.188-191
Marnotte P., Esther J-J. & Martin J., 2010 - A network of sugarcane herbicide weeding trials in La
Reunion Island. Un réseau d’essais sur le désherbage de la canne à sucre à La Réunion. AFPP – 21ème
Conf. Columa. Journées internationales sur la lutte contre les mauvaises herbes. AFPP CD-Rom. Martin J., Maillary L., Thomas P., Gossard C., 2013 - L’IFT herbicides canne à sucre à La Reunion : premières estimations (cette conférence).
Mc Mahon G., Lawrence P. and O’Grady T., 2000 - Weed control in sugarcane. In : Hogarth, D.M. and Allsopp, P.G. (eds). Manual of Canegrowing. BSES, Brisbane (AU), 436 pp.


![Table IV: Confidence intervals at p=0.05 for the yield differences predicted by the equation of regression from figure 2-B [y (yield difference, t/ha) = -17.16x (months) + 47.24]](https://thumb-eu.123doks.com/thumbv2/123doknet/13915464.449327/6.892.158.760.775.903/table-confidence-intervals-differences-predicted-equation-regression-difference.webp)