Dietary intakes and food sources of phenolic acids in the European
Prospective Investigation into Cancer and Nutrition (EPIC) study
Raul Zamora-Ros
1*, Joseph A. Rothwell
2, Augustin Scalbert
3, Viktoria Knaze
3, Isabelle Romieu
3,
Nadia Slimani
3, Guy Fagherazzi
4, Florence Perquier
4, Marina Touillaud
4, Esther Molina-Montes
5,6,
Jose´ Marı´a Huerta
6,7, Aurelio Barricarte
6,8, Pilar Amiano
6,9, Virginia Mene´ndez
10, Rosario Tumino
11,
Maria Santucci de Magistris
12, Domenico Palli
13, Fulvio Ricceri
14, Sabina Sieri
15, Francesca L. Crowe
16,
Kay-Thee Khaw
17, Nicholas J. Wareham
18, Verena Grote
19, Kuanrong Li
19, Heiner Boeing
20,
Jana Fo
¨rster
20, Antonia Trichopoulou
21,22, Vassiliki Benetou
21,22, Konstantinos Tsiotas
21,22,
H. Bas Bueno-de-Mesquita
23,24, Martine Ros
23, Petra H. M. Peeters
25,26, Anne Tjønneland
27,
Jytte Halkjær
27, Kim Overvad
28, Ulrika Ericson
29, Peter Wallstro
¨m
30, Ingegerd Johansson
31,
Rikard Landberg
32, Elisabete Weiderpass
33, Dagrun Engeset
33, Guri Skeie
33, Petra Wark
26,
Elio Riboli
26and Carlos A. Gonza´lez
11Unit of Nutrition, Environment and Cancer, Cancer Epidemiology Research Programme, Catalan Institute of Oncology
(ICO-IDIBELL), Avda Gran Via 199-203, 08907 L’Hospitalet de Llobregat, Spain
2INRA, Centre Clermont-Ferrand – Theix, UMR1019, Unite´ de Nutrition Humaine, Saint-Gene`s-Champanelle, France 3Nutrition and Metabolism Unit, International Agency for Research on Cancer (IARC), Lyon, France
4Institut National de la Sante´ et de la Recherche Me´dicale (INSERM), Center for Research in Epidemiology and Population
Health (CESP), U1018 Villejuif, France
5Andalusian School of Public Health, Granada, Spain
6CIBER Epidemiologı´a y Salud Pu´ blica (CIBERESP), Barcelona, Spain
7Department of Epidemiology, Murcia Regional Health Council, Murcia, Spain 8Navarre Public Health Institute, Pamplona, Spain
9Public Health Division of Gipuzkoa, Department of Health of the Regional Government of the Basque Country,
BIODonostia Research Institute, San Sebastian, Spain
10Public Health Directorate, Asturias, Spain
11Cancer Registry and Histopathology Unit, ‘Civile M.P. Arezzo’ Hospital, Ragusa, Italy 12Department of Clinical and Experimental Medicine, Federico II University, Naples, Italy
13Molecular and Nutritional Epidemiology Unit, Cancer Research and Prevention Institute – ISPO, Florence, Italy 14Human Genetic Foundation (HuGeF), Turin, Italy
15Nutritional Epidemiology Unit, Fondazione IRCCS Istituto Nazionale dei Tumori, Milan, Italy 16
Cancer Epidemiology Unit, Nuffield Department of Clinical Medicine, University of Oxford, Oxford, UK
17Department of Public Health and Primary Care, University of Cambridge, Cambridge, UK 18MRC Epidemiology Unit, Cambridge, UK
19Department of Cancer Epidemiology, German Cancer Research Center, Heidelberg, Germany
20Department of Epidemiology, German Institute of Human Nutrition Potsdam-Rehbru¨ cke, Nuthetal, Germany
21Department of Hygiene, Epidemiology and Medical Statistics, WHO Collaborating Center for Food and Nutrition Policies,
University of Athens Medical School, Athens, Greece
22Hellenic Health Foundation, Athens, Greece
23National Institute for Public Health and the Environment, Bilthoven, The Netherlands
24Department of Gastroenterology and Hepatology, University Medical Centre, Utrecht, The Netherlands
25Julius Center for Health Sciences and Primary Care, University Medical Center Utrecht, Utrecht, The Netherlands 26Department of Epidemiology and Biostatistics, School of Public Health, Faculty of Medicine, Imperial College, London, UK 27Danish Cancer Society Research Center, Copenhagen, Denmark
* Corresponding author: Dr R. Zamora-Ros, fax þ 34 932607787, email rzamora@iconcologia.net
Abbreviations: EPIC, European Prospective Investigation into Cancer and Nutrition; FCDB, food composition database.
British Journal of Nutrition (2013), 110, 1500–1511 doi:10.1017/S0007114513000688
qThe Authors 2013
British
Journal
of
Nutrition
Downloaded from https://www.cambridge.org/core . IP address: 118.70.52.165 , on 24 Jun 2021 at 12:17:06, subject to the Cambridge Core terms of use, available at
https://www.cambridge.org/core/terms
.
28Section of Epidemiology, Department of Public Health, Aarhus University, Aarhus, Denmark 29Department of Clinical Sciences, Diabetes and Cardiovascular disease, Genetic Epidemiology,
Lund University, Malmo¨, Sweden
30Nutrition Epidemiology Research Group, Department of Clinical Sciences, Lund University, Malmo¨, Sweden 31
Department of Odontology, Umea˚ University, Umea˚, Sweden
32Department of Food Science, BioCenter, Swedish University of Agricultural Sciences, Uppsala, Sweden 33Department of Community Medicine, Faculty of Health Sciences, University of Tromsø, Tromsø, Norway (Submitted 17 October 2012 – Final revision received 4 February 2013 – Accepted 4 February 2013 – First published online 14 March 2013)
Abstract
Phenolic acids are secondary plant metabolites that may have protective effects against oxidative stress, inflammation and cancer in experimental studies. To date, limited data exist on the quantitative intake of phenolic acids. We estimated the intake of phenolic acids and their food sources and associated lifestyle factors in the European Prospective Investigation into Cancer and Nutrition (EPIC) study. Phenolic acid intakes were estimated for 36 037 subjects aged 35 – 74 years and recruited between 1992 and 2000 in ten European countries using a standardised 24 h recall software (EPIC-Soft), and their food sources were identified. Dietary data were linked to the Phenol-Explorer database, which contains data on forty-five aglycones of phenolic acids in 452 foods. The total phenolic acid intake was highest in Aarhus, Denmark (1265·5 and 980·7 mg/d in men and women, respectively), while the intake was lowest in Greece (213·2 and 158·6 mg/d in men and women, respectively). The hydroxycinnamic acid subclass was the main contributor to the total phenolic acid intake, accounting for 84·6 – 95·3 % of intake depending on the region. Hydroxybenzoic acids accounted for 4·6 – 14·4 %, hydroxy-phenylacetic acids 0·1 – 0·8 % and hydroxyphenylpropanoic acids # 0·1 % for all regions. An increasing south – north gradient of consump-tion was also found. Coffee was the main food source of phenolic acids and accounted for 55·3 – 80·7 % of the total phenolic acid intake, followed by fruits, vegetables and nuts. A high heterogeneity in phenolic acid intake was observed across the European countries in the EPIC cohort, which will allow further exploration of the associations with the risk of diseases.
Key words:Phenolic acids: Dietary intakes: Food sources: European Prospective Investigation into Cancer and Nutrition
Phenolic acids are secondary plant metabolites widely spread throughout the plant kingdom(1). Alongside the better-known flavonoids, they form one of the two major classes of dietary polyphenols. Chemically, phenolic acids are hydroxylated derivatives of benzoic, cinnamic, phenylacetic and phenylpro-panoic acids. Hydroxycinnamic acids occur most frequently as simple esters with hydroxy carboxylic acids or sugars, whereas hydroxybenzoic acids are present mainly in glycosylated forms(2). Most often, only low amounts of phenolic acids in the free form (aglycones) are found in foods. In nature, hundreds of phenolic acids have been identified, although only ninety (thirty-six aglycones) were found to be consumed by a French cohort(3). They are most abundant in coffee, tea, red wine and some vegetables and fruits, especially berries(1). Recent interest in phenolic acids stems from their potential protective role against oxidative stress, inflammation, diabetes and cancer in experimental studies(4 – 7). However, very few
epidemiological studies have evaluated the effects of dietary phenolic acids upon chronic diseases due to a lack of food composition data on these compounds(8). Phenol-Explorer (www.phenol-explorer.eu) is a comprehensive food compo-sition database (FCDB) on polyphenols, including phenolic acids, that has been available to the scientific community since 2009(9). This FCDB enables researchers to more accu-rately assess the intake of phenols, their food sources and their potential effects on health, taking into account both the chemical structure of phenolic acids and their combination in glycosidic or ester forms.
To our knowledge, only three groups have assessed the dietary intake of phenolic acids. Using their own FCDB, German(10) and Finnish(11) studies estimated mean daily intakes of 222 and 641 mg of dietary phenolic acids (expressed as aglycones), respectively. Using Phenol-Explorer, the French cohort SUpple´mentation en VItamines et Mine´raux Antio-Xydants (SU.VI.MAX) estimated mean intakes of 599 mg/d (316 mg as aglycones/d) and 41 mg/d (40 mg as aglycones/d) for hydroxycinnamic acids and hydroxybenzoic acids, respect-ively(3). It is difficult to determine whether these differences are due to different dietary and lifestyle patterns or to differ-ences in the FCDB used. Therefore, the aim of the present study was to estimate the intake of phenolic acids and their main food sources across the ten European countries partici-pating in the European Prospective Investigation into Cancer and Nutrition (EPIC) study and across population subgroups using the same FCDB and dietary assessment tools.
Materials and methods Study population
The EPIC is an ongoing multi-centre prospective cohort study involving twenty-three centres in ten European countries: Greece; Spain; Italy; France; Germany; The Netherlands; UK; Denmark; Sweden; Norway(12). Over half a million subjects
(29·5 % men) aged 20 – 85 years were enrolled between 1992 and 2000. Participants were mostly recruited from the general population within defined geographical areas, with some
Phenolic acid intakes in Europe 1501
British
Journal
of
Nutrition
Downloaded from https://www.cambridge.org/core . IP address: 118.70.52.165 , on 24 Jun 2021 at 12:17:06, subject to the Cambridge Core terms of use, available at
https://www.cambridge.org/core/terms
.
exceptions: women who were members of a health insurance scheme for state school employees (France); women atten-ding breast cancer screening (Utrecht, The Netherlands and Naples, Italy); mostly blood donors (some centres in Italy and Spain); mainly vegetarians (the ‘health conscious’ cohort in Oxford, UK). For the purpose of dietary analyses, the twenty-three administrative EPIC centres were redefined into twenty-seven geographical areas(13), of which nineteen included both male and female participants and eight recruited women only.
Data used in the present study were derived from the EPIC calibration study, in which a 24 h recall was adminis-tered. The cohort comprises an 8 % (n 36 994) age- and sex-stratified random sample, weighted according to the number of cancer cases expected over 10 years of follow-up(13). After 957 exclusions due to an age restriction to 35 – 74 years or incomplete dietary information, 36 037 subjects were included in the present analysis. Approval for the study was obtained from ethical review boards of the International Agency for Research on Cancer (IARC) and from all local participating institutions. All participants provided written informed consent.
Dietary and lifestyle information
Dietary information was collected through a single 24 h recall using specialised software (EPIC-Soft)(14,15), which was devel-oped to ensure standardisation of the interviews. All centres administered the interviews face to face, except in Norway where telephone interviews were conducted(16).
Data on other lifestyle factors, including educational level, anthropometry, physical activity (combining both occupation and leisure-time activities) and smoking history, were col-lected at baseline through standardised questionnaires and clinical examinations(12,13,17). Data on age, as well as on body weight and height, were mostly self-reported by the participants during the 24 h recall interview. The mean time interval between these baseline measures and the 24 h recall interview varied by country, from 1 d to 3 years later(13).
Food composition database on phenolic acids
A food composition table was generated based on the mean content of individual phenolic acids in the Phenol-Explorer database and on the 24 h recall occurrences. Phenol-Explorer provides data on 502 polyphenol compounds in 452 plant-based foods(9), including data on 109 phenolic acids, of which forty-five are aglycones. They are distributed across four different subclasses: hydroxybenzoic acids (n 16); hydro-xycinnamic acids (n 21); hydroxyphenylacetic acids (n 5); hydroxyphenylpropanoic acids (n 3). Total phenolic acid intake was calculated as the sum of the total intake of individ-ual phenolic compounds using Phenol-Explorer food content values determined by chromatography without hydrolysis(9). Intakes were expressed as aglycone equivalents (n 45) after the conversion of phenolic acid glycoside and ester contents into aglycone contents on the basis of their respective molecu-lar weights. For phenolic acids linked to the food matrix, food
content values obtained by chromatography after hydrolysis(9) were used; this applied to hydroxycinnamic acids in cereals, legumes and olives. In addition, when data obtained by chro-matography without hydrolysis were unavailable, phenolic acid contents obtained by chromatography after hydrolysis were used.
Phenolic acid composition data for a small number of foods reported in the 24 h recall were absent from the Phenol-Explorer database and therefore obtained from scientific litera-ture. These food items included honey, roasted chicory powder, orange and lemon peels, carob flour, mushrooms, okra seed pod, sweet potato, jujube, vanilla pod, seaweed and rose hip. A few more food items reported in the 24 h recall and expected to contain phenolic compounds (coconut, some liquors and spirits, hop, grapevine leaves, orgeat, pump-kin flower and some minor vegetable oils) were not available in the Phenol-Explorer database. However, the frequency of consumption or the polyphenol content of these foods was low and their contribution to phenolic acid intake was there-fore considered minimal. Caffeic, ferulic, sinapic and p-couma-ric acids in orange fruit were obtained by extrapolation from orange juice data. For some concentrated foods (e.g. tomato pure´e, tomato paste), dried foods (e.g. dried fruit, sun-dried tomato) and dehydrated foods (e.g. garlic and onion in powder) reported in the 24 h recall but not included in Phenol-Explorer, yield factors were applied to adjust for the gain or loss of moisture during food processing or cooking. The effect of cooking on phenolic acid content was not con-sidered due to the paucity of data available. To estimate the phenolic acid contents of generic food items reported in the 24 h recall (e.g. fruit not specified), the profile of consumption of individual foods in that group and in each country was applied. Complex foods (e.g. cakes, sauces) were calculated as recipes taking into account the individual ingredients and their corresponding proportions as estimated from data avail-able on the Internet.
Statistical analyses
Dietary phenolic acid intakes were calculated using general-ised linear models and presented as means with their standard errors stratified by sex and the redefined centres, which are ordered geographically from south to north. These models were adjusted for age (continuous variable) and weighted by season and weekday of the 24 h recall to control for differ-ent distributions of participants across seasons and days of the recall. The contribution of each individual and subgroup of phenolic acids to the total intake was calculated as a percen-tage for each of the three European regions (south: all centres in Greece, Spain, Italy and the south of France; central: all centres in the north-east and north-west of France, Germany, The Netherlands and the UK; north: all centres in Denmark, Sweden and Norway). The contribution of each food group to the total phenolic acid intake by European region was also computed as a percentage.
Differences in phenolic acid intakes were compared using general linear models according to the categories of sex, age (35 – 44, 45 – 54, 55 – 64 and 65 – 74 years), BMI (, 25, 25 – 30
R. Zamora-Ros et al. 1502
British
Journal
of
Nutrition
Downloaded from https://www.cambridge.org/core . IP address: 118.70.52.165 , on 24 Jun 2021 at 12:17:06, subject to the Cambridge Core terms of use, available at
https://www.cambridge.org/core/terms
.
and . 30 kg/m2), European regions (south, central and north), educational level (none, primary completed, technical/ professional, secondary school and university degree), smoking status (never smoker, current smoker and former smoker) and level of physical activity (inactive, moderately inactive, moderately active and active). All these models were adjusted for sex (categorical), age (years, continuous), centre (categorical), BMI (kg/m2, continuous) and energy intake (kJ/d, continuous), and weighted by season and weekday. P values , 0·05 (two-tailed) were considered as significant. All analyses were conducted using SPSS Statistics software (version 19.0; SPSS, Inc.).
Results
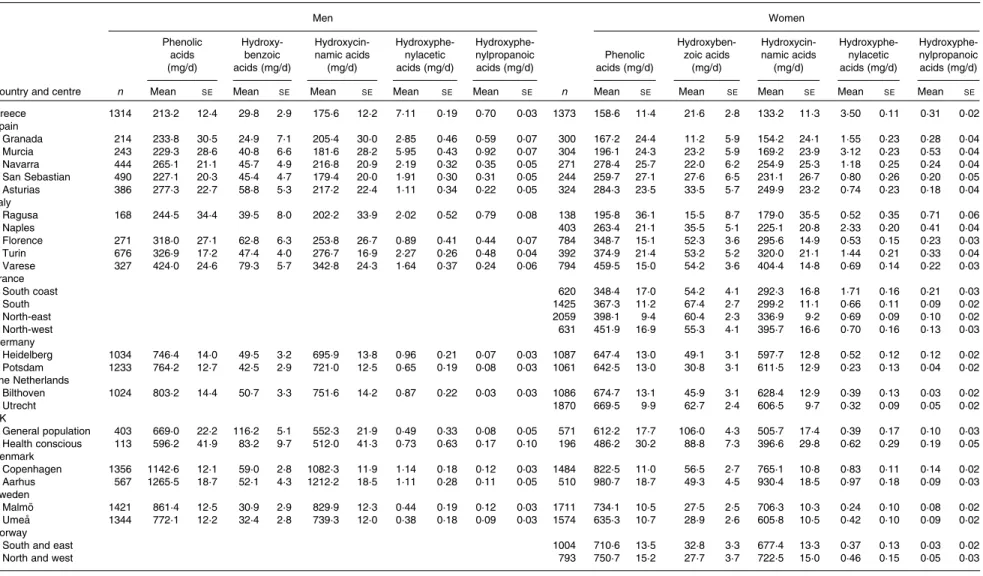
Table 1 shows the centre-specific daily mean intakes of total and classes of phenolic acids, stratified by sex, adjusted for age and weighted for season and weekday of the 24 h recall. A south-to-north gradient in the mean intake of total phenolic acids and hydroxycinnamic acids was observed among the EPIC centres in both men and women. The highest total phe-nolic acid intake was observed in Aarhus, Denmark (1265·5 and 980·7 mg/d in men and women, respectively), whereas the lowest intake was in Greece (213·2 and 158·6 mg/d in men and women, respectively).
The main phenolic acid contributors were hydroxycinnamic acids (ranging from 84·6 % in the south region to 95·3 % in the north region), followed by hydroxybenzoic acids (ranging from 4·6 % in the north region to 14·4 % in the south region), hydroxyphenylacetic acids (ranging from 0·1 % in both central and north regions to 0·8 % in the south region) and, finally, hydroxyphenylpropanoic acids (# 0·1 % in all regions). The main hydroxybenzoic acid contributors were gallic acid, ellagic acid and 4-hydroxybenzoic acid. For hydro-xycinnamic acids, the main contributors were caffeic acid and ferulic acid. Homovanillic and 4-hydroxyphenylacetic acids were the most abundant hydroxyphenylacetic acids, while the three hydroxyphenylpropanoic acid aglycones contributed in similar proportions.
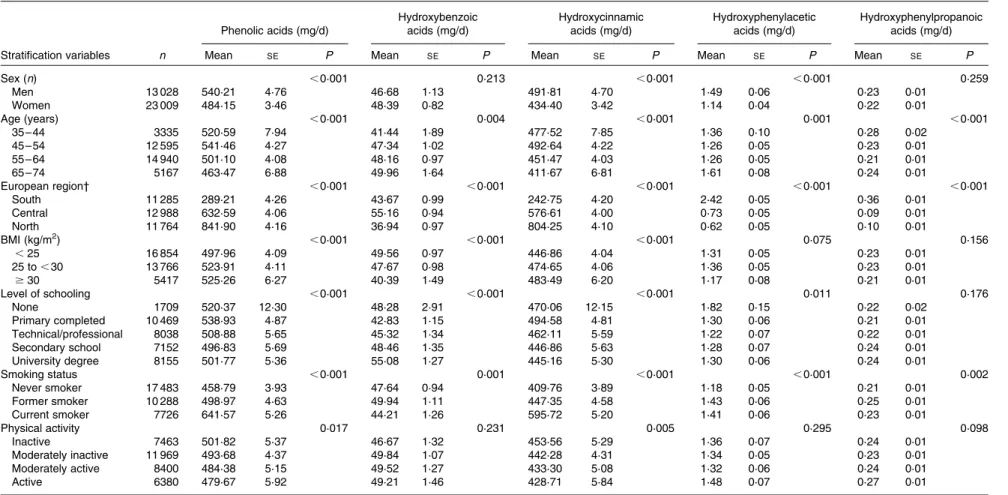
Table 2 shows the evaluation of the relationship between sociodemographic, lifestyle and anthropometric characteristics and phenolic acid intakes adjusted for age, sex, centre, energy and BMI and weighted for season and weekday. Men had a statistically significant higher intake of total phenolic acids (540·2 v. 484·2 mg/d), hydroxycinnamic acids (491·8 v. 434·4 mg/d) and hydroxyphenylacetic acids (1·49 v. 1·14 mg/ d) than women. There were no statistically significant differences in total hydroxybenzoic acid and hydroxyphenyl-propanoic acid intakes between sexes. Participants who were between 45 and 54 years had the highest intakes of total phenolic acids. A geographical gradient of increasing total phenolic acids, and hydroxycinnamic acids from south to north, was observed. The opposite geographical gradient was found for hydroxyphenylacetic acids and hydroxyphenyl-propanoic acids, whereas hydroxybenzoic acid intake was highest in the central region. Physically inactive individuals, current smokers, obese participants and those with a low level of education had higher intakes of phenolic acids and
hydroxycinnamic acids. However, for hydroxybenzoic acids, the opposite association was observed with BMI and level of education.
The main food sources of phenolic acid intake by European region were also studied (Table 3). Coffee was the most abundant food source of phenolic acids in all regions, with contributions ranging from 55 to 81 %. Other major food sources were fruits, nuts and seeds, some vegetables, and cereal and cereal products. For hydroxycinnamic acids, the main contributor was coffee, accounting for 67, 84 and 85 % in the south, central and north European regions, respectively. For hydroxybenzoic acids, the main food sources were tea in the central and north European regions, while in the south region, they were nuts and seeds. Other important contri-butors were wine, leafy vegetables and berries. For hydroxy-phenylacetic acids, the major food sources were olives, particularly in the south European region, beer and ciders, and wines. The most abundant sources of hydroxyphenylpro-panoic acids were olives and some condiments and sauces.
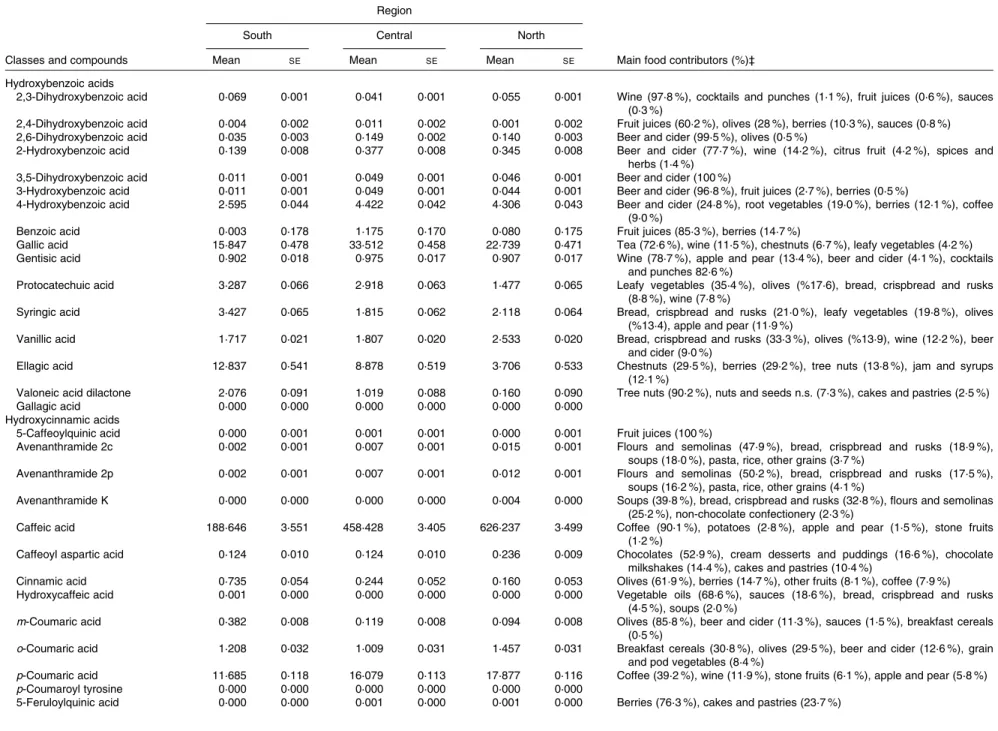
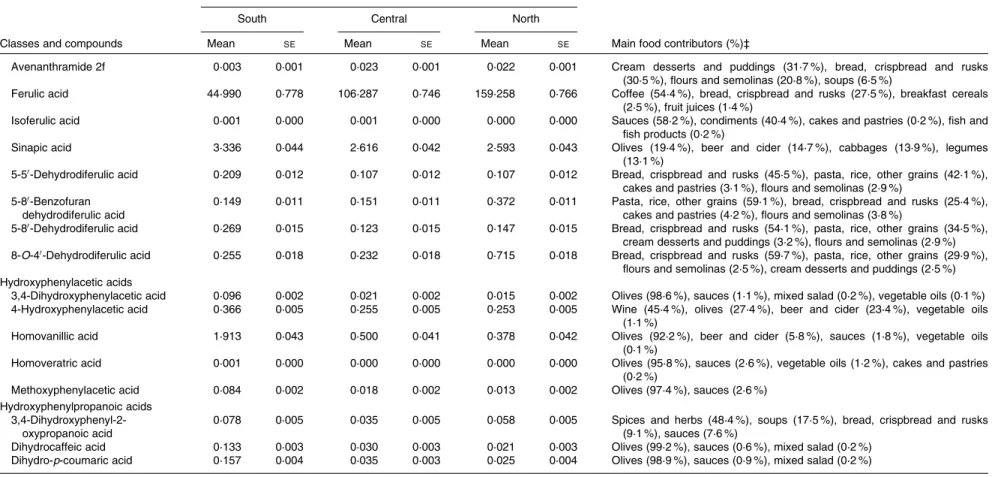
Table 4 shows the mean intakes of individual phenolic acids and their main food sources by European region, adjusted for sex and age and weighted by season and weekday. The most frequently consumed phenolic acids were caffeic acid (188·6 – 626·2 mg/d), ferulic acid (45·0 – 159·3 mg/d) and p-coumaric (11·7 – 17·9 mg/d) from coffee, gallic acid (15·8 – 33·5 mg/d) from tea and ellagic acid (3·7 – 12·8 mg/d) from nuts and berries.
Discussion
Estimating phenolic acid intake is the first step towards docu-menting the protective effects of these compounds against the risk of chronic diseases in epidemiological studies. This is the first study to assess the intake of phenolic acids across European countries. Moreover, the present study also shows the main food sources and associated factors of phenolic acid intakes using the same FCDB (Phenol-Explorer) and a common dietary assessment method (24 h recall).
Intake of total phenolic acids was the greatest in northern European countries, particularly Denmark, Sweden and Norway. In these countries, mean intake after adjustment was as much as five times higher than that of the lowest intake (Greece). Most of the phenolic acid intake in all regions was from hydroxycinnamic acids, in agreement with previous local studies(3,10,11). The principal source of these in all regions was coffee, which contributes high levels of caffeic acid derived from as much as 150 mg chlorogenic acids/ 100 ml(18). The high phenolic acid intake in Scandinavian and northern European countries is largely a consequence of high coffee consumption(19,20). Southern European
countries consume considerably less coffee, despite the appar-ent importance of coffee in Mediterranean culture. Ferulic acid, to a lesser extent, also contributes clearly to this differ-ence in phenolic acid intake, with high intakes in the northern countries. As well as being present in coffee, this hydroxycin-namate is found complexed with hemicelluloses in high-fibre foods, and consequently, other important dietary sources are wheat bran, whole-grain flour and cereals(21). Therefore,
Phenolic acid intakes in Europe 1503
British
Journal
of
Nutrition
Downloaded from https://www.cambridge.org/core . IP address: 118.70.52.165 , on 24 Jun 2021 at 12:17:06, subject to the Cambridge Core terms of use, available at
https://www.cambridge.org/core/terms
.
Table 1. Adjusted* mean daily intakes of total and classes of phenolic acids by sex and centre ordered from south to north (Mean values with their standard errors)
Men Women Phenolic acids (mg/d) Hydroxy-benzoic acids (mg/d) Hydroxycin-namic acids (mg/d) Hydroxyphe-nylacetic acids (mg/d) Hydroxyphe-nylpropanoic acids (mg/d) Phenolic acids (mg/d) Hydroxyben-zoic acids (mg/d) Hydroxycin-namic acids (mg/d) Hydroxyphe-nylacetic acids (mg/d) Hydroxyphe-nylpropanoic acids (mg/d)
Country and centre n Mean SE Mean SE Mean SE Mean SE Mean SE n Mean SE Mean SE Mean SE Mean SE Mean SE
Greece 1314 213·2 12·4 29·8 2·9 175·6 12·2 7·11 0·19 0·70 0·03 1373 158·6 11·4 21·6 2·8 133·2 11·3 3·50 0·11 0·31 0·02 Spain Granada 214 233·8 30·5 24·9 7·1 205·4 30·0 2·85 0·46 0·59 0·07 300 167·2 24·4 11·2 5·9 154·2 24·1 1·55 0·23 0·28 0·04 Murcia 243 229·3 28·6 40·8 6·6 181·6 28·2 5·95 0·43 0·92 0·07 304 196·1 24·3 23·2 5·9 169·2 23·9 3·12 0·23 0·53 0·04 Navarra 444 265·1 21·1 45·7 4·9 216·8 20·9 2·19 0·32 0·35 0·05 271 278·4 25·7 22·0 6·2 254·9 25·3 1·18 0·25 0·24 0·04 San Sebastian 490 227·1 20·3 45·4 4·7 179·4 20·0 1·91 0·30 0·31 0·05 244 259·7 27·1 27·6 6·5 231·1 26·7 0·80 0·26 0·20 0·05 Asturias 386 277·3 22·7 58·8 5·3 217·2 22·4 1·11 0·34 0·22 0·05 324 284·3 23·5 33·5 5·7 249·9 23·2 0·74 0·23 0·18 0·04 Italy Ragusa 168 244·5 34·4 39·5 8·0 202·2 33·9 2·02 0·52 0·79 0·08 138 195·8 36·1 15·5 8·7 179·0 35·5 0·52 0·35 0·71 0·06 Naples 403 263·4 21·1 35·5 5·1 225·1 20·8 2·33 0·20 0·41 0·04 Florence 271 318·0 27·1 62·8 6·3 253·8 26·7 0·89 0·41 0·44 0·07 784 348·7 15·1 52·3 3·6 295·6 14·9 0·53 0·15 0·23 0·03 Turin 676 326·9 17·2 47·4 4·0 276·7 16·9 2·27 0·26 0·48 0·04 392 374·9 21·4 53·2 5·2 320·0 21·1 1·44 0·21 0·33 0·04 Varese 327 424·0 24·6 79·3 5·7 342·8 24·3 1·64 0·37 0·24 0·06 794 459·5 15·0 54·2 3·6 404·4 14·8 0·69 0·14 0·22 0·03 France South coast 620 348·4 17·0 54·2 4·1 292·3 16·8 1·71 0·16 0·21 0·03 South 1425 367·3 11·2 67·4 2·7 299·2 11·1 0·66 0·11 0·09 0·02 North-east 2059 398·1 9·4 60·4 2·3 336·9 9·2 0·69 0·09 0·10 0·02 North-west 631 451·9 16·9 55·3 4·1 395·7 16·6 0·70 0·16 0·13 0·03 Germany Heidelberg 1034 746·4 14·0 49·5 3·2 695·9 13·8 0·96 0·21 0·07 0·03 1087 647·4 13·0 49·1 3·1 597·7 12·8 0·52 0·12 0·12 0·02 Potsdam 1233 764·2 12·7 42·5 2·9 721·0 12·5 0·65 0·19 0·08 0·03 1061 642·5 13·0 30·8 3·1 611·5 12·9 0·23 0·13 0·04 0·02 The Netherlands Bilthoven 1024 803·2 14·4 50·7 3·3 751·6 14·2 0·87 0·22 0·03 0·03 1086 674·7 13·1 45·9 3·1 628·4 12·9 0·39 0·13 0·03 0·02 Utrecht 1870 669·5 9·9 62·7 2·4 606·5 9·7 0·32 0·09 0·05 0·02 UK General population 403 669·0 22·2 116·2 5·1 552·3 21·9 0·49 0·33 0·08 0·05 571 612·2 17·7 106·0 4·3 505·7 17·4 0·39 0·17 0·10 0·03 Health conscious 113 596·2 41·9 83·2 9·7 512·0 41·3 0·73 0·63 0·17 0·10 196 486·2 30·2 88·8 7·3 396·6 29·8 0·62 0·29 0·19 0·05 Denmark Copenhagen 1356 1142·6 12·1 59·0 2·8 1082·3 11·9 1·14 0·18 0·12 0·03 1484 822·5 11·0 56·5 2·7 765·1 10·8 0·83 0·11 0·14 0·02 Aarhus 567 1265·5 18·7 52·1 4·3 1212·2 18·5 1·11 0·28 0·11 0·05 510 980·7 18·7 49·3 4·5 930·4 18·5 0·97 0·18 0·09 0·03 Sweden Malmo¨ 1421 861·4 12·5 30·9 2·9 829·9 12·3 0·44 0·19 0·12 0·03 1711 734·1 10·5 27·5 2·5 706·3 10·3 0·24 0·10 0·08 0·02 Umea˚ 1344 772·1 12·2 32·4 2·8 739·3 12·0 0·38 0·18 0·09 0·03 1574 635·3 10·7 28·9 2·6 605·8 10·5 0·42 0·10 0·09 0·02 Norway
South and east 1004 710·6 13·5 32·8 3·3 677·4 13·3 0·37 0·13 0·03 0·02
North and west 793 750·7 15·2 27·7 3·7 722·5 15·0 0·46 0·15 0·05 0·03
* Adjusted for age and weighted by season and day of recall.
R.
Zamora-Ros
et
al.
1504
British Journal of Nutrition
Downloaded from
https://www.cambridge.org/core
. IP address: 118.70.52.165 , on 24 Jun 2021 at 12:17:06
, subject to the Cambridge Core terms of use, available at
https://www.cambridge.org/core/terms
.
Table 2. Adjusted* mean daily intakes of total and classes of phenolic acids by sex and selected characteristics (Mean values with their standard errors)
Phenolic acids (mg/d) Hydroxybenzoic acids (mg/d) Hydroxycinnamic acids (mg/d) Hydroxyphenylacetic acids (mg/d) Hydroxyphenylpropanoic acids (mg/d)
Stratification variables n Mean SE P Mean SE P Mean SE P Mean SE P Mean SE P
Sex (n) ,0·001 0·213 ,0·001 ,0·001 0·259 Men 13 028 540·21 4·76 46·68 1·13 491·81 4·70 1·49 0·06 0·23 0·01 Women 23 009 484·15 3·46 48·39 0·82 434·40 3·42 1·14 0·04 0·22 0·01 Age (years) ,0·001 0·004 ,0·001 0·001 ,0·001 35 – 44 3335 520·59 7·94 41·44 1·89 477·52 7·85 1·36 0·10 0·28 0·02 45 – 54 12 595 541·46 4·27 47·34 1·02 492·64 4·22 1·26 0·05 0·23 0·01 55 – 64 14 940 501·10 4·08 48·16 0·97 451·47 4·03 1·26 0·05 0·21 0·01 65 – 74 5167 463·47 6·88 49·96 1·64 411·67 6·81 1·61 0·08 0·24 0·01 European region† ,0·001 ,0·001 ,0·001 ,0·001 ,0·001 South 11 285 289·21 4·26 43·67 0·99 242·75 4·20 2·42 0·05 0·36 0·01 Central 12 988 632·59 4·06 55·16 0·94 576·61 4·00 0·73 0·05 0·09 0·01 North 11 764 841·90 4·16 36·94 0·97 804·25 4·10 0·62 0·05 0·10 0·01 BMI (kg/m2) ,0·001 ,0·001 ,0·001 0·075 0·156 ,25 16 854 497·96 4·09 49·56 0·97 446·86 4·04 1·31 0·05 0·23 0·01 25 to , 30 13 766 523·91 4·11 47·67 0·98 474·65 4·06 1·36 0·05 0·23 0·01 $30 5417 525·26 6·27 40·39 1·49 483·49 6·20 1·17 0·08 0·21 0·01 Level of schooling ,0·001 ,0·001 ,0·001 0·011 0·176 None 1709 520·37 12·30 48·28 2·91 470·06 12·15 1·82 0·15 0·22 0·02 Primary completed 10 469 538·93 4·87 42·83 1·15 494·58 4·81 1·30 0·06 0·21 0·01 Technical/professional 8038 508·88 5·65 45·32 1·34 462·11 5·59 1·22 0·07 0·22 0·01 Secondary school 7152 496·83 5·69 48·46 1·35 446·86 5·63 1·28 0·07 0·24 0·01 University degree 8155 501·77 5·36 55·08 1·27 445·16 5·30 1·30 0·06 0·24 0·01 Smoking status ,0·001 0·001 ,0·001 ,0·001 0·002 Never smoker 17 483 458·79 3·93 47·64 0·94 409·76 3·89 1·18 0·05 0·21 0·01 Former smoker 10 288 498·97 4·63 49·94 1·11 447·35 4·58 1·43 0·06 0·25 0·01 Current smoker 7726 641·57 5·26 44·21 1·26 595·72 5·20 1·41 0·06 0·23 0·01 Physical activity 0·017 0·231 0·005 0·295 0·098 Inactive 7463 501·82 5·37 46·67 1·32 453·56 5·29 1·36 0·07 0·24 0·01 Moderately inactive 11 969 493·68 4·37 49·84 1·07 442·28 4·31 1·34 0·05 0·23 0·01 Moderately active 8400 484·38 5·15 49·52 1·27 433·30 5·08 1·32 0·06 0·24 0·01 Active 6380 479·67 5·92 49·21 1·46 428·71 5·84 1·48 0·07 0·27 0·01
* Adjusted for sex, age, energy intake and BMI and weighted by season and day of recall. P values are for overall differences in mean consumption by the general linear model among the sociodemographic, lifestyle and anthropometric subgroups.
† European region: south (all centres in Greece, Spain, Italy and the south of France); central (all centres in the north-east and north-west of France, Germany, The Netherlands and the UK); north (all centres in Denmark, Sweden and Norway).
Phenolic acid intakes in Europe 1505
British Journal of Nutrition
Downloaded from
https://www.cambridge.org/core
. IP address: 118.70.52.165 , on 24 Jun 2021 at 12:17:06
, subject to the Cambridge Core terms of use, available at
https://www.cambridge.org/core/terms
.
Table 3. Major food sources of total and classes of dietary phenolic acids in the south, central and north European regions*† Phenolic acids (%) Hydroxybenzoic acids (%) Hydroxycinnamic acids (%) Hydroxyphenylacetic acids (%) Hydroxyphenylpropanoic acids (%) Food groups and foods South Central North South Central North South Central North South Central North South Central North
Potatoes and other tubers 2·7 1·9 1·8 0·0 0·0 0·0 3·2 2·1 1·9 0·0 0·0 0·0 0·0 0·0 0·0
Vegetables 7·1 2·6 1·1 13·4 8·2 4·1 6·0 2·0 0·9 0·1 0·0 0·0 0·2 0·0 0·0 Leafy vegetables 3·1 1·3 0·0 9·4 5·7 0·2 2·1 0·9 0·0 0·0 0·0 0·0 0·0 0·0 0·0 Fruiting vegetables 2·2 0·4 0·1 0·3 0·1 0·1 2·5 0·4 0·1 0·0 0·0 0·0 0·0 0·0 0·0 Root vegetables 0·6 0·4 0·5 1·2 1·3 3·1 0·5 0·3 0·3 0·0 0·0 0·0 0·0 0·0 0·0 Cabbages 0·2 0·1 0·1 0·3 0·3 0·2 0·2 0·1 0·1 0·0 0·0 0·0 0·0 0·0 0·0 Grain vegetables 0·2 0·1 0·1 0·0 0·0 0·0 0·2 0·1 0·1 0·0 0·0 0·0 0·0 0·0 0·0 Onion, garlic 0·1 0·0 0·0 0·4 0·1 0·2 0·0 0·0 0·0 0·0 0·0 0·0 0·0 0·0 0·0 Sprout vegetables 0·3 0·1 0·0 1·0 0·4 0·0 0·1 0·0 0·0 0·0 0·0 0·0 0·0 0·0 0·0 Other vegetables 0·5 0·2 0·2 0·8 0·3 0·3 0·4 0·2 0·2 0·1 0·0 0·0 0·2 0·0 0·0 Legumes 1·3 0·2 0·1 0·1 0·0 0·0 1·5 0·2 0·1 0·0 0·0 0·0 0·0 0·0 0·0
Fruits, nuts and seeds 18·0 4·8 2·0 49·1 19·7 8·9 11·6 3·2 1·6 90·6 60·0 50·4 77·1 62·2 38·1
Citrus fruit 1·2 0·3 0·2 0·1 0·1 0·1 1·3 0·3 0·2 0·0 0·0 0·0 0·0 0·0 0·0
Apple and pear 3·5 1·2 0·8 0·7 1·1 1·8 4·0 1·2 0·7 0·0 0·0 0·0 0·0 0·0 0·0
Grape 0·1 0·0 0·0 0·0 0·0 0·0 0·1 0·0 0·0 0·0 0·0 0·0 0·0 0·0 0·0 Stone fruits 3·3 1·1 0·3 0·0 0·0 0·0 3·8 1·2 0·4 0·0 0·0 0·0 0·0 0·0 0·0 Berries 1·1 0·9 0·3 7·0 8·9 4·1 0·1 0·1 0·1 0·0 0·0 0·0 0·0 0·0 0·0 Banana 0·0 0·0 0·0 0·2 0·4 0·7 0·0 0·0 0·0 0·0 0·0 0·0 0·0 0·0 0·0 Kiwi 0·0 0·0 0·0 0·0 0·0 0·0 0·0 0·0 0·0 0·0 0·0 0·0 0·0 0·0 0·0 Other fruits 0·1 0·0 0·0 0·1 0·0 0·0 0·1 0·0 0·0 0·0 0·0 0·0 0·0 0·0 0·0
Nuts and seeds 5·4 0·9 0·2 34·5 8·5 1·2 0·2 0·2 0·1 0·0 0·0 0·0 0·0 0·0 0·0
Olives 3·5 0·3 0·1 6·4 0·7 0·9 1·9 0·2 0·1 90·6 60·0 50·4 77·1 62·2 38·1
Dairy products 0·2 0·2 0·0 0·6 1·4 0·4 0·1 0·1 0·0 0·0 0·0 0·0 0·0 0·0 0·0
Cereal and cereal products 4·7 5·5 8·7 0·9 2·5 8·6 5·4 5·8 8·7 0·2 0·1 0·0 3·5 0·0 17·1
Meat and meat products 0·0 0·0 0·0 0·0 0·0 0·1 0·0 0·0 0·0 0·0 0·0 0·0 0·5 2·0 6·5
Fish and shellfish 0·0 0·0 0·0 0·0 0·0 0·0 0·0 0·0 0·0 0·0 0·0 0·0 0·0 0·0 0·0
Egg and egg products 0·0 0·0 0·0 0·0 0·0 0·0 0·0 0·0 0·0 0·0 0·0 0·0 0·0 0·0 0·0
Fat 0·3 0·0 0·1 0·1 0·0 0·1 0·3 0·0 0·1 0·4 0·1 0·1 0·0 1·5 0·0
Sugar and confectionery 0·6 0·4 0·4 2·6 2·4 5·3 0·3 0·3 0·1 0·0 0·0 0·0 0·0 0·0 0·0
Cakes and biscuits 1·2 0·7 0·3 2·7 1·6 1·8 0·9 0·6 0·3 0·0 0·0 0·0 0·0 0·0 1·1
Non-alcoholic beverages 58·2 81·3 83·7 13·5 52·2 51·5 66·9 84·3 85·4 0·0 0·3 0·0 0·0 0·0 0·0 Juices 0·5 1·1 0·4 0·1 2·2 0·1 0·6 0·9 0·4 0·0 0·3 0·0 0·0 0·0 0·0 Carbonated drinks 0·0 0·0 0·1 0·0 0·0 0·0 0·0 0·0 0·1 0·0 0·0 0·0 0·0 0·0 0·0 Coffee 55·3 75·0 80·7 0·4 0·9 1·9 65·8 82·5 84·6 0·0 0·0 0·0 0·0 0·0 0·0 Tea 2·2 5·0 2·6 13·0 49·1 49·4 0·3 0·6 0·3 0·0 0·0 0·0 0·0 0·0 0·0 Herbal tea 0·2 0·1 0·0 0·0 0·1 0·0 0·3 0·1 0·0 0·0 0·0 0·0 0·0 0·0 0·0 Alcoholic beverages 4·9 2·0 1·7 15·6 11·0 18·4 3·0 1·1 0·9 7·0 39·1 46·7 0·0 0·0 0·0 Wine 4·6 1·1 1·1 14·4 6·0 11·1 2·8 0·6 0·6 6·1 14·1 19·9 0·0 0·0 0·0
Beer and ciders 0·3 0·8 0·6 1·1 4·7 7·0 0·2 0·4 0·3 0·8 24·4 26·4 0·0 0·0 0·0
Spirits 0·0 0·0 0·0 0·1 0·0 0·1 0·0 0·0 0·0 0·0 0·0 0·0 0·0 0·0 0·0
Cocktails, punches 0·0 0·0 0·0 0·0 0·2 0·2 0·0 0·0 0·0 0·0 0·5 0·4 0·0 0·0 0·0
Condiments and sauces 0·4 0·1 0·1 0·6 0·2 0·3 0·3 0·1 0·1 1·7 0·3 2·7 18·1 20·6 16·8
Soups, bouillons 0·4 0·2 0·1 0·9 0·4 0·5 0·3 0·2 0·1 0·0 0·0 0·0 0·1 11·1 20·4
Soya products 0·0 0·0 0·0 0·0 0·1 0·0 0·0 0·0 0·0 0·1 0·0 0·0 0·5 2·7 0·0
* Values are percentages derived from models adjusted for centre, age and sex, and weighted by season and day of recall.
† European region: south (all centres in Greece, Spain, Italy and the south of France); central (all centres in the north-east and north-west of France, Germany, The Netherlands and the UK); north (all centres in Denmark, Sweden and Norway).
R.
Zamora-Ros
et
al.
1506
British Journal of Nutrition
Downloaded from
https://www.cambridge.org/core
. IP address: 118.70.52.165 , on 24 Jun 2021 at 12:17:06
, subject to the Cambridge Core terms of use, available at
https://www.cambridge.org/core/terms
.
Table 4. Adjusted* intakes of individual phenolic acids (mg/d) in the European Prospective Investigation into Cancer and Nutrition cohort and their main food sources by European region† (Mean values with their standard errors)
Region
South Central North
Classes and compounds Mean SE Mean SE Mean SE Main food contributors (%)‡
Hydroxybenzoic acids
2,3-Dihydroxybenzoic acid 0·069 0·001 0·041 0·001 0·055 0·001 Wine (97·8 %), cocktails and punches (1·1 %), fruit juices (0·6 %), sauces (0·3 %)
2,4-Dihydroxybenzoic acid 0·004 0·002 0·011 0·002 0·001 0·002 Fruit juices (60·2 %), olives (28 %), berries (10·3 %), sauces (0·8 %) 2,6-Dihydroxybenzoic acid 0·035 0·003 0·149 0·002 0·140 0·003 Beer and cider (99·5 %), olives (0·5 %)
2-Hydroxybenzoic acid 0·139 0·008 0·377 0·008 0·345 0·008 Beer and cider (77·7 %), wine (14·2 %), citrus fruit (4·2 %), spices and herbs (1·4 %)
3,5-Dihydroxybenzoic acid 0·011 0·001 0·049 0·001 0·046 0·001 Beer and cider (100 %)
3-Hydroxybenzoic acid 0·011 0·001 0·049 0·001 0·044 0·001 Beer and cider (96·8 %), fruit juices (2·7 %), berries (0·5 %)
4-Hydroxybenzoic acid 2·595 0·044 4·422 0·042 4·306 0·043 Beer and cider (24·8 %), root vegetables (19·0 %), berries (12·1 %), coffee (9·0 %)
Benzoic acid 0·003 0·178 1·175 0·170 0·080 0·175 Fruit juices (85·3 %), berries (14·7 %)
Gallic acid 15·847 0·478 33·512 0·458 22·739 0·471 Tea (72·6 %), wine (11·5 %), chestnuts (6·7 %), leafy vegetables (4·2 %) Gentisic acid 0·902 0·018 0·975 0·017 0·907 0·017 Wine (78·7 %), apple and pear (13·4 %), beer and cider (4·1 %), cocktails
and punches 82·6 %)
Protocatechuic acid 3·287 0·066 2·918 0·063 1·477 0·065 Leafy vegetables (35·4 %), olives (%17·6), bread, crispbread and rusks (8·8 %), wine (7·8 %)
Syringic acid 3·427 0·065 1·815 0·062 2·118 0·064 Bread, crispbread and rusks (21·0 %), leafy vegetables (19·8 %), olives (%13·4), apple and pear (11·9 %)
Vanillic acid 1·717 0·021 1·807 0·020 2·533 0·020 Bread, crispbread and rusks (33·3 %), olives (%13·9), wine (12·2 %), beer and cider (9·0 %)
Ellagic acid 12·837 0·541 8·878 0·519 3·706 0·533 Chestnuts (29·5 %), berries (29·2 %), tree nuts (13·8 %), jam and syrups (12·1 %)
Valoneic acid dilactone 2·076 0·091 1·019 0·088 0·160 0·090 Tree nuts (90·2 %), nuts and seeds n.s. (7·3 %), cakes and pastries (2·5 %)
Gallagic acid 0·000 0·000 0·000 0·000 0·000 0·000
Hydroxycinnamic acids
5-Caffeoylquinic acid 0·000 0·001 0·001 0·001 0·000 0·001 Fruit juices (100 %)
Avenanthramide 2c 0·002 0·001 0·007 0·001 0·015 0·001 Flours and semolinas (47·9 %), bread, crispbread and rusks (18·9 %), soups (18·0 %), pasta, rice, other grains (3·7 %)
Avenanthramide 2p 0·002 0·001 0·007 0·001 0·012 0·001 Flours and semolinas (50·2 %), bread, crispbread and rusks (17·5 %), soups (16·2 %), pasta, rice, other grains (4·1 %)
Avenanthramide K 0·000 0·000 0·000 0·000 0·004 0·000 Soups (39·8 %), bread, crispbread and rusks (32·8 %), flours and semolinas (25·2 %), non-chocolate confectionery (2·3 %)
Caffeic acid 188·646 3·551 458·428 3·405 626·237 3·499 Coffee (90·1 %), potatoes (2·8 %), apple and pear (1·5 %), stone fruits (1·2 %)
Caffeoyl aspartic acid 0·124 0·010 0·124 0·010 0·236 0·009 Chocolates (52·9 %), cream desserts and puddings (16·6 %), chocolate milkshakes (14·4 %), cakes and pastries (10·4 %)
Cinnamic acid 0·735 0·054 0·244 0·052 0·160 0·053 Olives (61·9 %), berries (14·7 %), other fruits (8·1 %), coffee (7·9 %) Hydroxycaffeic acid 0·001 0·000 0·000 0·000 0·000 0·000 Vegetable oils (68·6 %), sauces (18·6 %), bread, crispbread and rusks
(4·5 %), soups (2·0 %)
m-Coumaric acid 0·382 0·008 0·119 0·008 0·094 0·008 Olives (85·8 %), beer and cider (11·3 %), sauces (1·5 %), breakfast cereals (0·5 %)
o-Coumaric acid 1·208 0·032 1·009 0·031 1·457 0·031 Breakfast cereals (30·8 %), olives (29·5 %), beer and cider (12·6 %), grain and pod vegetables (8·4 %)
p-Coumaric acid 11·685 0·118 16·079 0·113 17·877 0·116 Coffee (39·2 %), wine (11·9 %), stone fruits (6·1 %), apple and pear (5·8 %)
p-Coumaroyl tyrosine 0·000 0·000 0·000 0·000 0·000 0·000
5-Feruloylquinic acid 0·000 0·000 0·001 0·000 0·001 0·000 Berries (76·3 %), cakes and pastries (23·7 %)
Phenolic acid intakes in Europe 1507
British Journal of Nutrition
Downloaded from
https://www.cambridge.org/core
. IP address: 118.70.52.165 , on 24 Jun 2021 at 12:17:06
, subject to the Cambridge Core terms of use, available at
https://www.cambridge.org/core/terms
.
Table 4. Continued
Region
South Central North
Classes and compounds Mean SE Mean SE Mean SE Main food contributors (%)‡
Avenanthramide 2f 0·003 0·001 0·023 0·001 0·022 0·001 Cream desserts and puddings (31·7 %), bread, crispbread and rusks (30·5 %), flours and semolinas (20·8 %), soups (6·5 %)
Ferulic acid 44·990 0·778 106·287 0·746 159·258 0·766 Coffee (54·4 %), bread, crispbread and rusks (27·5 %), breakfast cereals (2·5 %), fruit juices (1·4 %)
Isoferulic acid 0·001 0·000 0·001 0·000 0·000 0·000 Sauces (58·2 %), condiments (40·4 %), cakes and pastries (0·2 %), fish and fish products (0·2 %)
Sinapic acid 3·336 0·044 2·616 0·042 2·593 0·043 Olives (19·4 %), beer and cider (14·7 %), cabbages (13·9 %), legumes (13·1 %)
5-50-Dehydrodiferulic acid 0·209 0·012 0·107 0·012 0·107 0·012 Bread, crispbread and rusks (45·5 %), pasta, rice, other grains (42·1 %), cakes and pastries (3·1 %), flours and semolinas (2·9 %)
5-80-Benzofuran dehydrodiferulic acid
0·149 0·011 0·151 0·011 0·372 0·011 Pasta, rice, other grains (59·1 %), bread, crispbread and rusks (25·4 %), cakes and pastries (4·2 %), flours and semolinas (3·8 %)
5-80-Dehydrodiferulic acid 0·269 0·015 0·123 0·015 0·147 0·015 Bread, crispbread and rusks (54·1 %), pasta, rice, other grains (34·5 %), cream desserts and puddings (3·2 %), flours and semolinas (2·9 %) 8-O-40-Dehydrodiferulic acid 0·255 0·018 0·232 0·018 0·715 0·018 Bread, crispbread and rusks (59·7 %), pasta, rice, other grains (29·9 %),
flours and semolinas (2·5 %), cream desserts and puddings (2·5 %) Hydroxyphenylacetic acids
3,4-Dihydroxyphenylacetic acid 0·096 0·002 0·021 0·002 0·015 0·002 Olives (98·6 %), sauces (1·1 %), mixed salad (0·2 %), vegetable oils (0·1 %) 4-Hydroxyphenylacetic acid 0·366 0·005 0·255 0·005 0·253 0·005 Wine (45·4 %), olives (27·4 %), beer and cider (23·4 %), vegetable oils
(1·1 %)
Homovanillic acid 1·913 0·043 0·500 0·041 0·378 0·042 Olives (92·2 %), beer and cider (5·8 %), sauces (1·8 %), vegetable oils (0·1 %)
Homoveratric acid 0·001 0·000 0·000 0·000 0·000 0·000 Olives (95·8 %), sauces (2·6 %), vegetable oils (1·2 %), cakes and pastries (0·2 %)
Methoxyphenylacetic acid 0·084 0·002 0·018 0·002 0·013 0·002 Olives (97·4 %), sauces (2·6 %) Hydroxyphenylpropanoic acids
3,4-Dihydroxyphenyl-2-oxypropanoic acid
0·078 0·005 0·035 0·005 0·058 0·005 Spices and herbs (48·4 %), soups (17·5 %), bread, crispbread and rusks (9·1 %), sauces (7·6 %)
Dihydrocaffeic acid 0·133 0·003 0·030 0·003 0·021 0·003 Olives (99·2 %), sauces (0·6 %), mixed salad (0·2 %) Dihydro-p-coumaric acid 0·157 0·004 0·035 0·003 0·025 0·004 Olives (98·9 %), sauces (0·9 %), mixed salad (0·2 %)
n.s., Not specified.
* Adjusted for sex and age, and weighted by season and day of recall.
† European region: south (all centres in Greece, Spain, Italy and the south of France); central (all centres in the north-east and north-west of France, Germany, The Netherlands and the UK); north (all centres in Denmark, Sweden and Norway).
‡ Four main food sources for each phenolic acid; a lower number indicates the absence of other food sources.
R.
Zamora-Ros
et
al.
1508
British Journal of Nutrition
Downloaded from
https://www.cambridge.org/core
. IP address: 118.70.52.165 , on 24 Jun 2021 at 12:17:06
, subject to the Cambridge Core terms of use, available at
https://www.cambridge.org/core/terms
.
another contributory factor could be the greater consumption of whole-grain bread, crisp bread and breakfast cereals in northern European countries than in southern Europe(22), which often contain a relatively high proportion of wheat bran. The third most consumed hydroxycinnamate was p-coumaric acid, primarily provided by fruits, nuts and spices, although its intake was minor in relation to that of caffeic and ferulic acids.
Even in southern European countries, hydroxycinnamic acids were by far the greatest contributor to the total phenolic acid intake, although the percentage contribution tended to be lower than that in northern Europe, due to lower coffee consumption(19). Hydroxybenzoic acids, whose principal
diet-ary sources are tea, wine and rosaceous fruits, constituted 14·4 % of total phenolic acids in the southern region, yet the contribution of nuts, seeds and fruit vegetables to total hydroxybenzoic acids was the greatest here. Intake of hydro-xyphenylacetic and hydroxyphenylpropanoic acids was higher in the southern region than in the northern and central regions. Hydrophenylacetic acids in the southern region were represented mainly by homovanillic acid (77·8 %). This is found primarily in olives and olive oils, whose consumption is more frequent in southern European diets. Hydroxyphenyl-propanoic acids were the least consumed phenolic acids in all regions, although significantly more were consumed in the southern region than in the northern and central regions. Again, this difference may be attributed to a greater consump-tion of olives and olive oils in the southern region.
Men from the EPIC cohort had higher phenolic acid intakes overall than women after adjustment for age, centre, energy and BMI, in agreement with the Finnish(11), but inconsistent with the findings of the German study(10). A greater intake of hydroxycinnamic acids was largely responsible for the higher phenolic acid intake among men, which reflects a greater coffee consumption overall in European men than in women. Phenolic acid and hydroxycinnamic acid intakes were also related to health-detrimental lifestyle characteristics. Lack of exercise, smoking and obesity, as well as a low level of education, were linked to higher intakes among the study subjects. This is consistent with previous findings where coffee consumption was strongly associated with smoking and a less health-conscious lifestyle(23). In sharp contrast, sub-jects who had consumed greater amounts of hydroxybenzoic acids (through main dietary sources such as tea, wine and fruit) tended to exercise more, smoke less and avoid obesity. Over a decade ago, it was proposed that phenolic acids contributed approximately to one-third of total polyphenol intake(24), with flavonoids accounting for the remaining two-thirds. This was expected to vary considerably as a function of coffee consumption, with heavy coffee consumers ingesting a greater proportion of polyphenols as phenolic acids. As detailed databases on polyphenol composition were not avail-able at this time, this hypothesis was generated by roughly estimating the flavonoid and phenolic acid contents of typical diets, based on the polyphenol compositions of commonly consumed food and beverage items. In the present study, the mean adjusted phenolic acid intake across all European countries was 512 mg/d. A recent study on the EPIC cohort,
using Phenol-Explorer food composition data, indicated a mean flavonoid intake of 372 mg/d in Europe(25). Therefore, we can estimate that 58 % of polyphenols are ingested as phe-nolic acids on average across Europe. Again, this proportion varies along the north – south axis from 44 % in countries bordering the Mediterranean Sea to 66 % in the northern and central European countries.
To date, this is the largest study describing phenolic acid intake across several countries of diverse dietary habits. The use of a single FCDB and a standardised 24 h recall allowed reliable comparisons among countries to be drawn. However, as not all the EPIC cohorts are representative of their respect-ive countries, the observed level of intake cannot be extrapo-lated to the general population of each region. In addition, for some demographic groups, profiles of phenolic acid intake could be very different from those observed in the EPIC. For example, phenolic acid intake would be quite different for children, as well as for adults who consume little or no tea and coffee. Another limitation of the present study could be possible inaccuracies in estimations due to the variation in the methods of preparation of some foods between countries. In the case of coffee, larger volumes are undoubtedly con-sumed in northern Europe, but the strength of a typical brew is thought to vary considerably from country to country and larger volumes might be offset by a weaker average brew(26,27). Moreover, Phenol-Explorer contains data on raw foods only, although many processes, such as cooking and peeling, can cause variable losses in the concentrations of polyphenols(2,28). Therefore, vegetables and cereals might overestimate their contribution to phenolic acid intake, although these were not the most important food sources in the present study. Further underestimation may arise due to the omission of dietary supplements in this analysis. However, there are few consumers of herb or plant supplements in the present study (up to 5 % in Denmark, the highest consumer country) and supplements containing phenolic acid are not commonly consumed(29). Despite these limitations, Phenol-Explorer is currently the most extensive FCDB on phenolic acids. A compilation of new data on the effects of food proces-sing and cooking on polyphenol content in foods is in progress, and these data should further enrich the Phenol-Explorer database and the accuracy of polyphenol intake estimations. Therefore, the present estimations of phenolic acid intake might be revised when more data become available. In conclusion, the present study presents the most extensive description so far of both total and individual phenolic acid intakes and their food sources across the ten European countries. Phenolic acids account for the major fraction of the total polyphenols ingested through Western diets in all European countries examined. Coffee is the main food source of phenolic acids. Differences in the nature and amount of the individual phenolic acids consumed are observed between countries along a north – south gradient, mainly due to the differences found in the consumption of phenolic acid-rich foods, particularly coffee. These differences were shown to be related to sociodemographic, anthropo-metric and lifestyle factors. More epidemiological studies on
Phenolic acid intakes in Europe 1509
British
Journal
of
Nutrition
Downloaded from https://www.cambridge.org/core . IP address: 118.70.52.165 , on 24 Jun 2021 at 12:17:06, subject to the Cambridge Core terms of use, available at
https://www.cambridge.org/core/terms
.
phenolic acids should be undertaken to explore links with the risk of chronic diseases.
Acknowledgements
The present study was supported by the European Commis-sion: Public Health and Consumer Protection Directorate 1993 – 2004; Research Directorate-General 2005; Ligue contre le Cancer, Institut Gustave Roussy, Mutuelle Ge´ne´rale de l’Education Nationale, Institut National de la Sante´ et de la Recherche Me´dicale (INSERM) (France); Institut National du Cancer (France), German Cancer Aid; German Cancer Research Center; German Federal Ministry of Education and Research; Danish Cancer Society: Health Research Fund (FIS) of the Spanish Ministry of Health (RTICC (DR06/0020); the participating regional governments from Asturias, Andalu-cı´a, Murcia, Navarra and Vasco Country and the Catalan Insti-tute of Oncology of Spain; Cancer Research UK; Medical Research Council, UK; the Stroke Association, UK; British Heart Foundation; Department of Health, UK; Food Standards Agency, UK; the Wellcome Trust, UK; Hellenic Ministry of Health, the Stavros Niarchos Foundation and the Hellenic Health Foundation; Italian Association for Research on Cancer; Compagnia San Paolo, Italy; Dutch Ministry of Public Health, Welfare and Sports; Dutch Ministry of Health; Dutch Prevention Funds; LK Research Funds; Dutch ZON (Zorg Onderzoek Nederland); World Cancer Research Fund (WCRF); Statistics Netherlands (The Netherlands); Swedish Cancer Society; Swedish Scientific Council; Regional Govern-ment of Skane, Sweden; Nordforsk – Centre of Excellence programme. Some authors are partners of ECNIS, a network of excellence of the 6FP of the EC. R. Z.-R. is thankful for a postdoctoral programme Fondo de Investigacio´n Sanitaria (FIS; no. CD09/00133) from the Spanish Ministry of Science and Innovation. We thank Raul M. Garcı´a for developing an application to link the FCDB on phenolics and the 24 h dietary recall occurrences. We also thank Bertrand He´mon for com-puting the intake of phenolic acids in the EPIC study. The authors’ contributions are as follows: R. Z.-R., A. S. and C. A. G. designed the research; R. Z.-R. and J. A. R. conducted the research; R. Z.-R. performed the statistical analysis; R. Z.-R. and J. A. R. wrote the manuscript. All authors contributed to the acquisition and interpretation of the data, to the critical revision of the manuscript and to the approval of the final manuscript. The authors have no conflict of interest.
References
1. Pe´rez-Jime´nez J, Neveu V, Vos F, et al. (2010) Systematic
analysis of the content of 502 polyphenols in 452 foods and beverages: an application of the Phenol-Explorer data-base. J Agric Food Chem 58, 4959 – 4969.
2. Manach C, Scalbert A, Morand C, et al. (2004) Polyphenols:
food sources and bioavailability. Am J Clin Nutr 79, 727 – 747.
3. Pe´rez-Jime´nez J, Fezeu L, Touvier M, et al. (2011) Dietary
intake of 337 polyphenols in French adults. Am J Clin Nutr 93, 1220 – 1228.
4. Nagasaka R, Chotimarkorn C, Shafiqul IM, et al. (2007)
Anti-inflammatory effects of hydroxycinnamic acid deriva-tives. Biochem Biophys Res Commun 358, 615 – 619.
5. De P, Baltas M & Bedos-Belval F (2011) Cinnamic acid
derivatives as anticancer agents – a review. Curr Med Chem 18, 1672 – 1703.
6. Kylli P, Nousiainen P, Biely P, et al. (2008) Antioxidant
poten-tial of hydroxycinnamic acid glycoside esters. J Agric Food Chem 56, 4797 – 4805.
7. Thom E (2007) The effect of chlorogenic acid enriched
coffee on glucose absorption in healthy volunteers and its effect on body mass when used long-term in overweight and obese people. J Int Med Res 35, 900 – 908.
8. Arts IC & Hollman PC (2005) Polyphenols and disease risk in
epidemiologic studies. Am J Clin Nutr 81, 317S – 325S.
9. Neveu V, Pe´rez-Jime´nez J, Vos F, et al. (2010)
Phenol-Explorer: an online comprehensive database on polyphenol contents in foods. Database (Oxford) 2010, bap024.
10. Radtke J, Linseisen J & Wolfram G (1998) Phenolic acid
intake of adults in a Bavarian subgroup of the national food consumption survey. Z Ernahrungswiss 37, 190 – 197.
11. Ovaskainen ML, Torronen R, Koponen JM, et al. (2008)
Diet-ary intake and major food sources of polyphenols in Finnish adults. J Nutr 138, 562 – 566.
12. Riboli E, Hunt KJ, Slimani N, et al. (2002) European
Prospec-tive Investigation into Cancer and Nutrition (EPIC): study populations and data collection. Public Health Nutr 5, 1113 – 1124.
13. Slimani N, Kaaks R, Ferrari P, et al. (2002) European
Prospective Investigation into Cancer and Nutrition (EPIC) calibration study: rationale, design and population character-istics. Public Health Nutr 5, 1125 – 1145.
14. Slimani N, Deharveng G, Charrondiere RU, et al. (1999)
Structure of the standardized computerized 24-h diet recall interview used as reference method in the 22 centers partici-pating in the EPIC project. European Prospective
Investi-gation into Cancer and Nutrition. Comput Methods
Programs Biomed 58, 251 – 266.
15. Slimani N, Ferrari P, Ocke M, et al. (2000) Standardization of
the 24-hour diet recall calibration method used in the Euro-pean Prospective Investigation into Cancer and Nutrition (EPIC): general concepts and preliminary results. Eur J Clin Nutr 54, 900 – 917.
16. Brustad M, Skeie G, Braaten T, et al. (2003) Comparison of
telephone vs face-to-face interviews in the assessment of dietary intake by the 24 h recall EPIC SOFT program – the Norwegian calibration study. Eur J Clin Nutr 57, 107 – 113.
17. Wareham NJ, Jakes RW, Rennie KL, et al. (2003) Validity and
repeatability of a simple index derived from the short physi-cal activity questionnaire used in the European Prospective Investigation into Cancer and Nutrition (EPIC) study. Public Health Nutr 6, 407 – 413.
18. Pe´rez-Jime´nez J, Neveu V, Vos F, et al. (2010) Identification
of the 100 richest dietary sources of polyphenols: an appli-cation of the Phenol-Explorer database. Eur J Clin Nutr 64, Suppl. 3, S112 – S120.
19. Michaud DS, Gallo V, Schlehofer B, et al. (2010) Coffee and
tea intake and risk of brain tumors in the European Prospec-tive Investigation into Cancer and Nutrition (EPIC) cohort study. Am J Clin Nutr 92, 1145 – 1150.
20. Slimani N, Fahey M, Welch AA, et al. (2002) Diversity of
dietary patterns observed in the European Prospective Investigation into Cancer and Nutrition (EPIC) project. Public Health Nutr 5, 1311 – 1328.
R. Zamora-Ros et al. 1510
British
Journal
of
Nutrition
Downloaded from https://www.cambridge.org/core . IP address: 118.70.52.165 , on 24 Jun 2021 at 12:17:06, subject to the Cambridge Core terms of use, available at
https://www.cambridge.org/core/terms
.
21. Kroon PA, Faulds CB, Ryden P, et al. (1997) Release of covalently bound ferulic acid from fiber in the human colon. J Agric Food Chem 45, 661 – 667.
22. Wirfalt E, McTaggart A, Pala V, et al. (2002) Food sources of
carbohydrates in a European cohort of adults. Public Health Nutr 5, 1197 – 1215.
23. van Dam RM & Feskens EJ (2002) Coffee consumption and
risk of type 2 diabetes mellitus. Lancet 360, 1477 – 1478.
24. Scalbert A & Williamson G (2000) Dietary intake and
bio-availability of polyphenols. J Nutr 130, 2073S – 2085S.
25. Zamora-Ros R, Knaze V, Luja´n-Barroso L, et al. (2013)
Differ-ences in dietary intakes, food sources, and determinants of total flavonoids between Mediterranean and non-Mediterra-nean countries participating in the European Prospective Investigation into Cancer and Nutrition (EPIC) study. Br J Nutr 109, 1498–1507.
26. Sa´nchez-Gonza´lez I, Jime´nez-Escrig A & Saura-Calixto F
(2005) In vitro antioxidant activity of coffees brewed using different procedures (Italian, espresso and filter). Food Chem 90, 133 – 139.
27. Parras P, Martı´nez-Tome M, Jime´nez AM, et al. (2007)
Antiox-idant capacity of coffees of several origins brewed following three different procedures. Food Chem 102, 582 – 592.
28. Amarowicz R, Carle R, Dongowski G, et al. (2009) Influence
of postharvest processing and storage on the content of phenolic acids and flavonoids in foods. Mol Nutr Food Res 53, Suppl. 2, S151 – S183.
29. Skeie G, Braaten T, Hjartaker A, et al. (2009) Use of dietary
supplements in the European Prospective Investigation into Cancer and Nutrition calibration study. Eur J Clin Nutr 63, Suppl. 4, S226 – S238.
Phenolic acid intakes in Europe 1511
British
Journal
of
Nutrition
Downloaded from https://www.cambridge.org/core . IP address: 118.70.52.165 , on 24 Jun 2021 at 12:17:06, subject to the Cambridge Core terms of use, available at
https://www.cambridge.org/core/terms
.