Analysis of trace metals (Cu, Cd, Pb, and Fe) in seawater using
single batch nitrilotriacetate resin extraction and isotope
dilution inductively coupled plasma mass spectrometry
The MIT Faculty has made this article openly available. Please sharehow this access benefits you. Your story matters.
Citation Lee, Jong-Mi, Edward A. Boyle, Yolanda Echegoyen-Sanz, Jessica N. Fitzsimmons, Ruifeng Zhang, and Richard A. Kayser. “Analysis of Trace Metals (Cu, Cd, Pb, and Fe) in Seawater Using Single Batch Nitrilotriacetate Resin Extraction and Isotope Dilution Inductively Coupled Plasma Mass Spectrometry.” Analytica Chimica Acta 686, no. 1–2 (February 2011): 93–101.
As Published http://dx.doi.org/10.1016/j.aca.2010.11.052
Publisher Elsevier
Version Author's final manuscript
Citable link http://hdl.handle.net/1721.1/103932
Terms of Use Creative Commons Attribution-NonCommercial-NoDerivs License Detailed Terms http://creativecommons.org/licenses/by-nc-nd/4.0/
Analysis of trace metals (Cu, Cd, Pb, and Fe) in seawater using single batch
1
Nitrilotriacetate resin extraction and isotope dilution inductively coupled plasma
2
mass spectrometry
3 4
Jong-Mi Leea, Edward A. Boylea,*, Yolanda Echegoyen-Sanza, Jessica N. Fitzsimmonsa,
5
Ruifeng Zhangb, Richard A. Kaysera 6
7
a Department of Earth, Atmospheric, and Planetary Sciences, Massachusetts Institute of 8
Technology, Cambridge, Massachusetts, MA 02139, USA 9
b State Key Laboratory of Estuarine and Coastal Research, East China Normal University, 10
Shanghai 200062, China 11
* Corresponding author. Tel: +1 617 253 3388; fax: +1 617 253 8630; e-mail address: 12
eaboyle@mit.edu 13
Abstract
15
A simple and accurate low-blank method has been developed for the analysis of total 16
dissolved copper, cadmium, lead, and iron in a small volume (1.3-1.5ml per element) of 17
seawater. Pre-concentration and salt-separation of a stable isotope spiked sample is 18
achieved by single batch extraction onto nitrilotriacetate (NTA)-type Superflow® 19
chelating resin beads (100-2400 beads depending on the element). Metals are released 20
into 0.1-0.5M HNO3, and trace metal isotope ratios are determined by ICPMS. The
21
benefit of this method compared to our previous Mg(OH)2 coprecipitation method is that
22
the final matrix is very dilute so cone-clogging and matrix sensitivity suppression are 23
minimal, while still retaining the high accuracy of the isotope dilution technique. 24
Recovery efficiencies are sensitive to sample pH, number of resin beads added, and the 25
length of time allowed for sample-resin binding and elution; these factors are optimized 26
for each element to yield the highest recovery. The method has a low procedural blank 27
and high sensitivity sufficient for the analysis of pM-nM open-ocean trace metal 28
concentrations. Application of this method to samples from the Bermuda Atlantic Time-29
Series Study station provides oceanographically consistent Cu, Cd, Pb, and Fe profiles 30
that are in good agreement with other reliable data for this site. In addition, the method 31
can potentially be modified for the simultaneous analysis of multiple elements, which 32
will be beneficial for the analysis of large number of samples. 33
1. Introduction
35
It has been widely recognized that trace metals play important roles in the ocean. 36
Trace metals such as iron, copper, and cadmium are essential for the growth of marine 37
phytoplankton [1-5]; for instance, iron is known to be used in chlorophyll production and 38
nitrogen fixation [3, 6], thereby regulating primary productivity and marine 39
biogeochemical cycles [7-8], and copper and cadmium can be toxic under some 40
conditions [9-10]. Other trace elements, such as lead, document the impact of 41
anthropogenic trace metal inputs to the ocean for the past two centuries [11-12]. 42
In spite of their importance, however, global-scale trace metal data are sparse 43
because of difficulties in sampling and analysis. Because of their extremely low 44
concentrations (10-9~10-12 mol l-1) compared to the high-salt matrix in seawater, analysis 45
of trace metals requires pre-concentration and purification before detection, which 46
includes solvent extraction [13-15] and extraction onto chelating resin columns (e.g. 47
Chelex-100, 8-HQ chelating resin) [14, 16-17] followed by trace metal quantification 48
using graphite furnace atomic absorption spectrometry (GFAAS) or inductively coupled 49
plasma mass spectrometry (ICPMS). Trace metal concentrations can be also measured 50
electrochemically (e.g. anodic stripping voltammetry), where pre-concentration is 51
achieved by long deposition times [18-19]. However, these methods are relatively labor-52
intensive (i.e. reagent purification and sample processing) and time-consuming as they 53
require large sample volumes (hundreds mililiter to liter scale). 54
In the last decade, various methods have been developed to allow trace metal 55
analysis with a simpler procedure and a smaller sample volume. One of these is the 56
Mg(OH)2 co-precipitation method coupled with isotope dilution ICPMS [20-22]. This
method uses small volumes (1.5 to 50ml) of seawater and reagents and has good 58
sensitivity with low procedural blanks. However, the resulting sample matrix contains 59
high Mg2+ and seasalt occluded in the precipitates that can clog the nebulizer and leave 60
deposits on the ICPMS cones, which limits runs to a few hours, suppresses ICPMS signal 61
strength, and requires frequent cleaning of the nebulizer and cones. Thus, this method is 62
not ideal for the routine measurement of many samples. 63
Other approaches that have been employed are on-line column extraction methods 64
using recently developed chelating resins that have higher affinity for metal ions [23-25]. 65
For instance, Lohan et al. [23] used on-line preconcentration by nitriloacetic acid (NTA)-66
type chelating resin columns coupled to flow injection analysis by ICPMS. This study 67
demonstrated that dissolved Fe3+ and Cu2+ can be quantitatively recovered at pH below 2 68
after oxidization of Fe2+ to Fe3+ by addition of trace H2O2, which is extremely
69
advantageous in that samples can be processed without further pH adjustment (trace 70
metal samples are routinely acidified and stored at pH 1.7-2.0 to preserve metal ions in 71
soluble inorganic form). However, because these on-line column extraction methods 72
assign trace metal concentrations by external standardization, accuracies are affected by 73
sample matrix and recovery variation during pre-concentration. In cases where the 74
sample pH needs to be adjusted to a higher pH (e.g., EDTA-type resin, or NTA resin for 75
other trace metals except Fe and Cu), recovery efficiencies may also vary during pH 76
adjustment because metal ions may be lost by re-complexation with organic ligands or 77
binding to bottle walls. A very recently developed method tackles this problem by using 78
isotope dilution and standard additions prior to on-line column extraction to analyze 79
multiple elements simultaneously [26]. However, on-line column extraction methods 80
generally have low ICPMS throughput because sample analysis rate is limited by sample 81
uptake and elution times, and they are also relatively sample consuming as large sample 82
volumes are used to rinse the entire system and precondition the resin column. 83
In this study, we utilized the same resin as in Lohan et al.’s method, but modified 84
the method by using 1) isotope dilution to avoid recovery efficiency and sensitivity issues 85
and 2) offline batch extraction from 100-2400 resin beads to keep blanks low and 86
improve ICPMS throughput. This method requires relatively little analyst time and 87
minimal volume of sample (only 1.3-1.5ml), which is beneficial under circumstances 88
when sample volume is limited. In addition, the use of small amounts of resin lowers the 89
Fe procedural blank in particular by reducing the Fe released from the NTA resin (see 90
section 3.2.). With this method we were able to analyze dissolved Cu, Cd, Pb, and Fe in 91
seawater samples to demonstrate oceanographically consistent profiles near Bermuda. 92 93 2. Experimental 94 2.1. Reagents 95
All reagent and sample preparations were carried out in a Class 100 clean laminar 96
flow bench or recirculating fume hood in a positive-pressure clean lab. High purity H2O
97
was prepared by redistillation of “ultrapure” deionized water in a Corning “Mega-Pure” 98
Vycor®/borosilicate still. Nitric acid was prepared by distilling reagent-grade HNO3 four
99
times in a Vycor still and diluting with high-purity water to make 0.1M or 0.5M HNO3.
100
Clean Suprapur® hydrogen peroxide (30% solution, EMD chemicals) was diluted to 101
0.75% with high purity H2O. Acetic acid (HAc) was prepared by Vycor-distilling
102
reagent-grade acetic acid, and clean ammonium hydroxide (NH4OH) was purchased
(Optima® grade, Fisher Scientific) or alternatively made by purifying reagent-grade 104
NH4OH by vapor-distillation.
105
Ammonium acetate buffer solution was prepared by mixing clean NH4OH and
106
HAc. The mixing ratio was determined empirically to keep the pH of the buffer between 107
7.9-7.98 because at pH higher than 8.0, Mg(OH)2 can be precipitated when buffer meets
108
the sample, potentially resulting in the loss of metals. The buffer was used without further 109
dilution to minimize the volume of buffer added to the samples. Because ammonia gas is 110
lost relatively rapidly through plastic bottle walls, the buffer was refrigerated when not in 111
use to reduce buffer weakening. 112
113
2.2. Materials 114
All the 1.5ml polyethylene vials (Eppendorf AG or Molecular BioProducts, Inc. 115
with o-rings removed) and bottles were acid-leached for one day at 60°C with 10% 116
reagent-grade HCl. The vials and bottles were then rinsed 3-5 times with pure distilled 117
water, filled with high-purity 0.06M HCl, and then leached for another day at 60°C. The 118
dilute HCl was left in the vials until just before use. Pipette tips were rinsed with dilute 119
HCl and high purity H2O immediately before use. Before sample preparation, 1.5ml-size
120
vials from different companies were tested for their Fe blank by adding 150µl of clean 121
0.5M HNO3 to acid-cleaned, empty vials and measuring Fe concentrations in the acid
122
after 5-days of leaching. The Fe detected herein represents the Fe blank coming from the 123
vial walls since during sample preparation Fe is eluted from the resin beads in the same 124
way (i.e., store 150µl of 0.5M HNO3 in resin-containing vials for five days). We also
125
conducted the same test while the vials were kept upside-down to check for potential 126
contamination from vial caps. Eppendorf vials (no longer commercially available; reused 127
repeatedly) were found to be cleaner for Fe compared to the other brands tested, so only 128
these vials were used for Fe analysis, although different lots of vials resulted in variable 129
Fe blanks (Table 1). We also found that vial caps are the largest contributor to Fe blanks 130
even after they are cleaned by the acid-leaching steps described above, so vials were kept 131
upright during sample preparation, and every effort was made to avoid contact between 132
acidic sample solution and caps. Cu, Cd, and Pb blanks were low regardless of what 133
brand vials were used, and vials from Eppendorf AG and Molecular BioProducts, Inc. 134
were both used for these elements. 135
136
2.3. Standards 137
Cu, Cd, and Pb standards with natural isotope abundance were prepared by 138
diluting ULTRA grade ICP standards (ULTRA Scientific, North Kingstown, RI) with 139
0.1M HNO3. For the natural isotope abundance Fe standard, 99.99% pure Fe metal was
140
dissolved in 1% (V/V) HNO3 and further diluted with 0.5M HNO3.
Scarcer-stable-141
isotope-enriched spikes (65Cu, 110Cd, and 204Pb) were made by dissolution of CuO, CdO 142
and PbCO3 (Oak Ridge National Laboratories) in 1% HNO3, and working isotope spikes
143
were made by subsequent dilution with 0.1M HNO3. A 54Fe-57Fe enriched isotope spike
144
was shared with us from the laboratory of Dan Schrag (Harvard Univ., Cambridge, MA, 145
USA). The concentrations of these working isotope spikes were adjusted to minimize 146
error propagation of the isotope dilution method, i.e. to match approximately the isotope 147
ratio of the sample-spike mixture with the geometric mean of the isotope ratios of the 148
isotope spike and the natural sample, and not too far from 1:1 to minimize blank errors 149
[27-28]. The exact concentrations of Cu, Cd, Pb, and Fe in the isotope spikes were 150
determined by isotope dilution calibration against the natural abundance standard of each 151 element. 152 153 2.4. NTA resin 154
We have used NTA Superflow® resin (Qiagen Inc., Valencia, CA) supplied in 155
both Ni2+ and non-Ni2+ forms, although the non-Ni2+ form was preferred. The resin was 156
cleaned by multiple rinsing steps in acid-cleaned polypropylene centrifuge tubes. When 157
not being used or cleaned, the resin was kept refrigerated. The resin was first washed 158
several times with high purity H2O, then multiple times with high purity 1.5M HCl, and
159
then again multiple times with high purity H2O until the pH was higher than 3. Then the
160
resin was rinsed several times with high purity 0.5M HNO3; for the first washes, it was
161
left on a shaker table for several hours, and then left overnight for the final wash. Finally, 162
the resin was rinsed with high purity H2O several times until the pH was higher than 3.
163
After each wash, the resin was centrifuged down and the supernatant was discarded. 164
Cleaned NTA resin was then diluted with high purity H2O so the resin suspension
165
contained ~100-400 resin beads per 25µl, and was stored in a refrigerator. The resin 166
blank was checked by leaching the resin beads in 0.5M HNO3 and measuring trace metal
167
concentrations (see section 3.4.); if the blank was higher than expected, we repeated the 168
0.5M HNO3 and high purity H2O rinsing steps. Cleaning the resin is particularly
169
important for Fe. It seems that Fe within the beads diffuses to the surface of the beads 170
where it can be dissolved into the samples, so even after the resin is cleaned once, 171
significant amounts of Fe are slowly released from the resin beads over time. We found a 172
high resin blank for Fe (up to ~2.5nM) when the resin was stored for a long time (a few 173
months), and it decreased to the normal level (<0.2nM) after re-cleaning the resin. 174
175
2.5. Seawater for method calibration 176
Two seawater samples, SAFe MIT “A” and SAFe D2, were used as reference 177
samples in this study. They were collected from the surface and 1000m depth at 30oN 178
140oW in the North Pacific during the SAFe program in 2004 [29]. This program 179
provides reference samples (SAFe S for surface seawater and SAFe D2 for deep water) 180
from a homogenized large volume tank, filtered and acidified (pH 1.7.) in a uniform way. 181
The SAFe MIT “A” was taken at the surface at the same station during the same cruise 182
using a towed fish sampler and thus should have comparable concentration to the 183
“official” SAFe S. The SAFe MIT “A” was filtered through clean 0.2µm Osmonics 184
capsule filters and acidified to pH 2.0. 185
Samples for an oceanographic profile were collected at the Bermuda Atlantic 186
Time-Series Study station (BATS, 31o40’N, 64o10’W) in June 2008 during
187
GEOTRACES IC1 intercalibration cruise. The samples used for Cu, Cd, and Pb profiles 188
were taken using a Moored In-situ Trace Element Serial Sampler (MITESS) or with a 189
single MITESS “ATE” (Automated Trace Element) [30-31]. Soon after sample collection 190
(within 24 hours), the samples were filtered through acid-cleaned 0.4µm Nuclepore filters 191
in a class 100 laminar flow bench. The samples used for Fe were collected by the 192
GEOTRACES GOFlo rosette system, filtered through 0.2µm Osmonics capsule filters. 193
All samples were acidified to pH 2.0 with 4x vycor-distilled 6N HCl (except SAFe D2 194
that was acidified to pH 1.7 with sub-boiling distilled 6N HCl). 195
196
2.6. Instrumentation 197
A Quadrupole ICPMS (VG PlasmaQuad 2+) was used for Cu, Cd, and Pb 198
analysis. Measured isotopes were 63Cu and 65Cu for Cu; 95Mo, 110Cd, 114Cd and 118Sn for
199
Cd; and 202Hg, 204Pb, and 208Pb for Pb. The sensitivity of the instrument was ~100,000 200
counts per second for 1 ppb Indium when a nominal 50 µl min-1 MicroMist® concentric 201
nebulizer (Glass Expansion, measured flow rate of 70 µl min-1) was used in conjunction 202
with a water-cooled Scott double by-pass spray chamber and a Fassel quartz torch (Glass 203
Expansion). Free-aspiration was used for sample uptake, and a frit filter was used at the 204
tip of the sipper tubing to prevent clogging from the resin beads. The operating details are 205
listed in Table 2a. Isobaric interferences on 110Cd (94Mo16O) and 114Cd (98Mo16O) were 206
corrected using 95Mo counts of each sample and the MoO/95Mo of a Mo standard, and the 207
magnitude of this correction was negligibly small (<0.1%). The 114Sn interference on 208
114Cd and 204Hg interference on 204Pb were corrected by monitoring 118Sn and 202Hg.
209
For Fe analysis, 52Cr, 54Fe, and 56Fe were determined simultaneously with Faraday 210
cups using static mode on a multi-collector magnetic sector ICPMS (GV/Micromass 211
IsoProbe) with a hexapole collision cell using Ar and H2 collision gases to minimize
212
40Ar14N+ and 40Ar16O+ interferences and thermalize the ion beam. The same nominal 50
213
µl min-1 MicroMist® concentric nebulizer was used along with an APEX Q inlet system
214
(Elemental Scientific, Inc.) with a passive desolvating membrane and a Fassel quartz 215
torch (Glass Expansion). A frit filter was placed on the tip of the sipper tube to avoid 216
clogging by resin beads. This instrument provides very precise Fe data at high sensitivity 217
because 40Ar16O+ and 40Ar14N+ interferences on 56Fe and 54Fe are eliminated by the 218
hexapole collision cell and the instrument can be run in low resolution mode. The Cr 219
interference on mass 54 was corrected by monitoring 52Cr, but was negligibly small 220
because the resin does not take up Cr at the analytical pH range. The operating details for 221
the IsoProbe are listed in Table 2b. 222
Dilute nitric acid (the same acid used as for eluates, i.e. 0.1M HNO3 for Cu, Cd,
223
and Pb and 0.5M HNO3 for Fe) was measured at appropriate intervals (“on-peak zero”,
224
OPZ) to correct for changes in instrumental background. Instrumental mass bias was 225
corrected by running the “natural” isotope standards of each element (spiked gravimetric 226
standards for Pb) at the beginning and end of the sample run each day. The average of 227
these two values was used for the correction, and a linear % per amu model was used to 228
correct for instrumental mass bias. 229
230
2.7. General procedure 231
Because we have found that optimal conditions vary slightly for Cu-Cd, Pb, and 232
Fe, we generally perform these analyses separately, although because of isotope dilution 233
calibration, it is possible to do all simultaneously at pH~5 so long as the isotope spikes do 234
not have contamination for the other elements. 235
The samples were prepared by the following procedure. Initially, an acid-leached 236
1.5ml vial was rinsed with a small volume (~0.5ml) of the acidified seawater sample (pH 237
1.7-2.0), and then 1.3-1.5ml of the sample was poured into the vials. The vial was 238
weighed before and after pouring the sample, and the exact sample volume was 239
determined by converting the weight of sample to volume using the density of seawater. 240
Alternatively, for Cu, Cd, and Pb analysis where constant volume of sample is desirable 241
for easier pH adjustment (because the volume of buffer added to samples can be fixed), 242
we poured the sample into the vial and pipetted out exactly 1.3ml of the sample using a 243
clean pipette tip. The 1.3ml sample in the pipette tip was pipetted back into the same vial 244
after quickly emptying the vial. Then, the sample was spiked with 25µl of stable isotope 245
spikes (enriched in 65Cu, 110Cd, 204Pb, and 54Fe) and left for a few minutes after vortex
246
mixing to establish isotopic equilibrium. At this pH (<1.7), two minutes were proven to 247
be sufficient to reach isotope equilibrium [20]. Then, for Cu, Cd, and Pb analysis, the pH 248
of the sample was adjusted to pH>5 using ammonium acetate solution (80-200 ul, 249
depending on the initial sample pH and target pH). Buffer was not added for Fe analysis 250
samples, but 10ul of 0.75% H2O2 was added to oxidize Fe(II) to Fe(III). After the
251
addition of buffer or H2O2, sample vials were vortexed again for a few seconds. Finally,
252
25-150µl of the NTA resin suspension (100-2400 beads) was added to the vial, vortexed 253
again, and then the sample vial was shaken on an orbital table for >24 hrs to allow the 254
trace metals and resin to bind. After 1-4 days, the sample vial was centrifuged (for 45 255
seconds at 14,500 rpm) and the overlying seawater was siphoned off carefully, leaving 256
the resin beads at the bottom. The resin beads were then rinsed three times with high 257
purity H2O to remove seasalt; in each rinse, the vial was filled with high purity H2O,
258
centrifuged down, and the supernatant was siphoned off. After rinsing, the 150 µl of 259
0.5M HNO3 (Fe) or 0.1M HNO3 (Cu, Cd, Pb) was added to the vial, and the trace metals
260
were allowed one to five days (five days for Fe) to be released into solution. The final 261
solution was then brought to the ICPMS, and the isotope ratios (56Fe/54Fe, 63Cu/65Cu, 262
114Cd/110Cd, and 208Pb/204Pb) of this solution (after OPZ blank correction) were measured
263
to calculate the concentration of each element. 264
Procedural blanks for Cu, Cd, and Fe were determined by processing small 265
volumes (0.1-0.3 ml) of the SAFe MIT “A” seawater in the same way as samples because 266
their concentrations in this water is small (although a correction for this contribution is 267
made nonetheless). For Pb, 0.3ml of low-Pb seawater was used to determine Pb 268
procedure blank, made by removal of Pb in seawater (taken from BATS, 1997) using 269
Mg(OH)2 coprecipitation followed by filtration through clean 0.4µm Nuclepore filters. In
270
order to estimate accurate procedural blanks, the trace metal contents that were initially 271
included in the SAFe MIT “A” seawater or low-Pb seawater were established by running 272
3-6 replicates of this seawater as a sample in every sample run. 273
274
3. Results and Discussion
275
Because this method uses isotope dilution, recovery efficiency is not as critical as 276
in flow-injection methods or other methods based on external standardization. However, 277
a sufficient amount of trace metals should be recovered from the resin to ensure that the 278
ICPMS signals from the sample are well above (order of magnitude at least) instrumental 279
background, especially when trace metal concentrations are very low. The sample 280
preparation procedure was optimized by testing various factors that may affect recovery 281
efficiencies of Cu, Cd, Pb, and Fe from NTA resin beads, such as sample pH, resin 282
volume, and the length of time allowed for sample-resin binding and elution from the 283
resin. The accuracy of the method was evaluated by measuring SAFe seawaters, and the 284
method was applied to determine vertical profiles of total dissolved Cu, Cd, Pb, and Fe 285
concentrations in samples collected from the BATS station. 286
3.1. Sample pH 288
A previous study showed that pH is critical for trace metal recoveries from the 289
NTA resin [23]. In Lohan et al.’s study, where a resin column and flow-injection system 290
were used, recovery efficiency of Cu was ~50% at pH<2, ~90% at pH 2-3, and near 291
100% at pH>3.5. Cd was recovered only at a pH higher than 5.5, with ~80% recovery 292
efficiency. In the case of Fe(III), ~80% of Fe(III) was recovered at pH 1.5 and Fe(III) was 293
almost fully recovered at pH higher than 2. The relationship between pH and Pb recovery 294
from NTA resin was not investigated in Lohan et al.’s study. 295
Based on this previous study, we tested the effect of pH on recovery efficiencies 296
of Cu, Cd, and Pb in our batch-extraction method. Fe was not studied here because Fe is 297
recovered well (50-75%) at a typical sample pH (1.7-2.0) without pH adjustment. We 298
added 50µl of isotope spike to 1.3ml of the acidified seawater samples (pH 1.7-2.0), and 299
then adjusted the pH of samples using ammonium acetate buffer. The Cu and Cd 300
recoveries were tested for pH values ranging from 5.0-6.7, and Pb was tested from pH 2.0 301
to 6.7. The amount of buffer added to the sample was empirically determined in each test 302
depending on the target pH. Finally, 50µl of NTA resin (~200 beads) were added to the 303
samples, and the samples were processed following the general procedure described in 304
section 2.4. The recovery efficiency of each element was calculated by comparing the 305
count rates of 65Cu, 110Cd, and 204Pb in the enriched isotope spike to those in the final 306
sample solution. 307
Under our batch-extraction conditions, 70-100% of Cu was recovered in the pH 308
range 5.0-6.7. Cd recoveries were very low (1~2%) at pH below 6.0 and higher at pH 6.5 309
(Figure 1a), but even the highest recovery at pH 6.5 was only ~5%. The low recovery of 310
Cd compared to the other elements is probably because of its low binding ability with 311
nitriloacetate (NTA) ligands [32]. Also, the much lower recovery of Cd at the same pH 312
compared to Lohan et al.’s study is likely because we used only ~200 resin beads, 313
whereas Lohan et al. used a column packed with ~105 resin beads (inner volume of the 314
1cm-column: 85µl; bead size: 60–160µm). Pb recoveries were low at pH<4.5, highest at 315
pH ~5.0, and they decreased as pH increased above 5.0 (Figure 1b). In a more detailed 316
study using a different seawater sample, the optimal pH for Pb appeared to be 5.0-5.4 317
(Figure 1b). Another thing we noticed was that recovery efficiencies seem to be different 318
for different samples, presumably depending on the strength of natural ligands in each 319
sample relative to that of NTA resin. The low overall recovery efficiency of the later 320
experiment (experiment for pH 5.0-5.6) compared to the others seems to be caused by 321
this natural variability of the samples, and it emphasizes the importance of using the 322
isotope dilution technique. 323
324
3.2. Number of resin beads 325
In order to test our hypothesis that the low Cd recovery is due to the low number 326
of resin beads used for extraction, we prepared samples by adding larger numbers of 327
beads. Recovery efficiencies of Cu and Cd increased by ~20% and ~100% by doubling 328
the resin volume (~400 beads) (Figure 2, white squares), and Pb recovery also increased 329
as a function of the number of resin beads added to the samples (Figure 3). Higher 330
recovery efficiencies were achieved by further increasing the number of resin beads; for 331
instance, we could achieve up to 80-90% Pb recovery when 2400 beads were added to the 332
sample. Because the volume of vial is limited to 1.5 ml, in that experiment we made a 333
more concentrated NTA resin suspension (400 beads per 25µl) and added 150µl of resin 334
suspension to the sample. 335
The concern with using larger volume of resin beads is that adding more beads 336
may increase the procedure blank. When the resin blank was checked for each element 337
(details in section 3.4.), it was negligibly low for Cu, Cd, and Pb, but was significant for 338
Fe. Thus, for Fe analysis, we did not increase the resin volume (we continued to use ~100 339
resin beads) to keep the procedural blank low. 340
341
3.3. Sample-resin binding and trace metal elution times 342
The influences of sample-resin binding time and elution time on recovery 343
efficiency were tested with the SAFe MIT “A” seawater. In the first experiment, the 344
samples were allowed to bind to the resin beads on a shaker table for one to four days 345
while the rest of the procedure was kept the same. Cu recovery efficiency increased 346
slightly when a longer time was allowed for sample-resin binding (Figure 2a), whereas 347
Cd recovery efficiency showed no detectable difference (Figure 2b) depending on the 348
binding time. In case of Pb, higher recovery efficiency was achieved when the samples 349
were left with resin beads for longer than 2 days (Figure 2c). The Fe recovery was tested 350
for 24-48 hours, and Fe recovery efficiency increased by ~25% when the samples were 351
left for a longer time. The Fe could be optimally recovered (>75%) when the samples 352
were left for about 36-48 hours with the resin; if left longer, chance of contamination 353
from the vial walls/caps increased. 354
For the sample-resin binding, speed of the shaker table also affects the binding 355
efficiency because a certain speed is necessary to keep the resin beads suspended in the 356
sample. John and Adkins [33] showed that Fe binding to the resin is achieved within a 357
shorter time if samples are shaken vigorously. The optimal speed we found for Cu, Cd, 358
and Pb was ~2000 rpm. For Fe, shaking samples too vigorously increased the chance of 359
contamination from contact of the sample with the vial caps. The most favorable speed 360
we found to minimize the Fe procedural blank was 1200-1300 rpm. 361
In the second experiment, the samples were allowed to bind to the resin for the 362
same length of time, but different amounts of time (1 to 5 days) were provided after the 363
addition of nitric acid, and before the ICPMS run. A longer elution time did not increase 364
Cu, Cd, or Pb recoveries between 1-5 days, so these elements were clearly released from 365
the resin in a relatively short time. The recovery of Fe increased significantly when a 366
longer time was allowed for elution. However, five days was chosen as the optimal length 367
of time for Fe elution because procedural blank also increases with time, likely because 368
of the slow release of Fe from the NTA resin beads. When samples could not be run on 369
the ICPMS on schedule, they were refrigerated (<4oC) to slow down the release of Fe 370
from the resin beads. 371
According to our investigation, several days to a week for sample preparation 372
yields the highest recovery efficiencies. However, because most of this process time 373
does not involve analyst’s work, actual analyst time for sample preparation is relatively 374
small, e.g., several hours for ~100 samples. In addition, when high recovery efficiency is 375
not critical (i.e., for samples with moderate to high trace metal concentrations), samples 376
can be processed and run on the ICPMS within 3 days. 377
378
3.4. Procedural blank, detection limit, and accuracy 379
The procedural blanks and detection limits of this method are shown in Table 3. 380
The detection limits are considered as three times the standard deviations of the 381
procedural blanks. The potential sources of the procedural blank of this batch-extraction 382
method are ammonium acetate buffer or H2O2, resin beads, dilute nitric acid, sample vials
383
and contamination during handling. Here we examine the contribution of these sources to 384
the procedural blank. 385
The Fe blank for H2O2 was measured by adding 10µl of H2O2 to 100µl of 0.5M
386
HNO3 and comparing the Fe counts of this solution to those of the Fe standard. The
387
contribution of H2O2 to the Fe procedural blank was small, less than 0.004 nM.
388
The Cu, Cd, and Pb concentrations of ammonium acetate buffer were determined 389
as follows. Because organic solvents cannot be analyzed by ICPMS directly (without 390
addition of oxygen to the nebulizer gas), 2ml of buffer solution was evaporated on a 391
hotplate in a V-shaped clean Teflon vial, and the remaining material was re-dissolved in 392
200µl of 0.1M HNO3. 10µl of enriched isotope spike was then added to the vial followed
393
by a thorough mixing, and Cu, Cd, and Pb concentrations in this solution were 394
determined by isotope dilution ICPMS. The metal content was measured in every new 395
batch of buffer to check for contamination. In general, when 150µl of buffer was added to 396
1.3ml sample (buffer to sample ratio used for most of our samples), it added ~0.001nM of 397
Cu and 0.26-0.71 pM of Pb to the procedural blanks. The contribution of buffer to the Cd 398
blank was negligible (<d.l.). The trace metal concentrations in HAc and NH4OH were
399
also measured separately in the same manner, and HAc was found to be the dominant 400
source of trace metals in the buffer. Purifying HAc by further distillation will lower the 401
present buffer blank, and consequently lower the procedural blank. 402
In order to assess the trace metals coming from the resin suspension, 50µl of resin 403
suspension (~200 beads) was added to 1.5ml Eppendorf vials. After the addition of 150µl 404
0.1M HNO3, the resin was left for 1-5 days so any trace metals in the resin could be
405
released. Following the addition of 10µl isotopically-enriched standard, the metal 406
concentration in this solution was determined by isotope dilution ICPMS. The Cu, Cd, 407
and Pb contents in the resin suspension were negligible (<d.l.), and the procedural blanks 408
were almost the same even though the number of resin beads was increased. The resin 409
blank for Fe was equivalent to 0.05-0.25nM for samples depending on the time since the 410
resin was cleaned, which means that the resin is the major source of the Fe procedural 411
blank. 412
The accuracy of the NTA resin batch-extraction method was tested in several 413
ways. The Cu, Cd, Pb, and Fe concentrations in SAFe seawaters analyzed by this method 414
were compared with the SAFe consensus values 415
(www.geotraces.org/Intercalibration.html#Standards) (Table 3), and they agreed well. 416
The surface Cd concentrations are below detection limit for the sample size of 1.3ml; if 417
lower detection limits are desired, they could be attained by increasing recovery 418
efficiency using more resin beads and concentrating Cd from a larger sample volume. In 419
addition, the fact that the Cu, Cd and Fe data at BATS station generated by this method 420
match those from previous studies (see section 3.7) demonstrates that the ID-NTA bead- 421
ICPMS method can provide accurate data. 422
423
3.5. Multi-element analysis 424
This method has the potential to detect multi-element concentrations from a single 425
1.3ml-size sample. The sample can be spiked with a multi-isotope standard (a mixture of 426
the enriched isotope standard of each element), and the isotope ratios of the multiple 427
elements in the sample can be detected concurrently on the ICPMS. In order to achieve 428
this goal, each scarcer-isotope-enriched spike should be clean with respect to the other 429
elements to yield low procedural blank for all analyzed elements. When 65Cu-, 110Cd-, 430
and 204Pb-enriched isotope spikes were checked for Cu, Cd, and Pb concentrations (Table 431
4), they were relatively clean for each other except the 65Cu isotope spike, which was 432
slightly contaminated with Pb probably during storage and handling (this 65Cu spike 433
solution was more than 10yrs old). Spiking 25µl of this 65Cu spike to samples will
434
increase the Pb procedural blank by 0.28pM; however, this is still acceptable considering 435
typical Pb concentrations in the ocean. Cross-contamination was not investigated for Fe 436
because we measure Fe on a different instrument (IsoProbe) from the other elements 437
(PQ2+). Because mixing the 65Cu, 114Cd, and 204Pb isotope spikes will slightly change the 438
fraction of each isotope and isotope ratios (contamination from the other isotope spikes), 439
they should be precisely measured before use. Also, the accuracy of this multi-element 440
analysis can be improved by adjusting the mixing ratio and concentrations of each 441
isotope standard to minimize error propagation. The Cu and Cd concentrations in SAFe 442
seawaters were assessed simultaneously by spiking the samples with 65Cu- and 114 Cd-443
enriched isotope spike, and the result agreed well with the SAFe consensus value, 444
affirming that multiple elements can be analyzed simultaneously using this method. 445
446
3.6. Cu, Cd, Pb, and Fe concentrations from open ocean (BATS) samples 447
This new method was applied to the open ocean seawater samples taken from the 448
BATS site during June 2008 GEOTRACES IC1 cruise (Figure 4). The Cu, Cd, and Pb 449
data shown here are from the samples collected by MITESS samplers, and Fe is from 450
GEOTRACES GoFlo samplers (GPrI Isotope cast). 451
The Cu profile generated by this method agrees well with the previous data 452
obtained in the Sargasso Sea (Figure 4a) [34-35]. Dissolved Cu is low in the upper layer 453
and it increases almost linearly with increasing depth. This characteristic feature of Cu 454
has been observed in other studies [20, 34-37], and is attributed to the combination of 455
biological uptake and remineralization, scavenging onto particles, and the release of Cu 456
from surface sediments. Otherwise, the profile might be maintained by a relatively 457
uniform supply of Cu from decomposing organic particles at depth combined with a rapid 458
exchange of dissolved Cu with sinking particulate Cu by analogy to 230Th and 231Pa 459
profiles [38]. 460
The vertical distribution of Cd is characterized by extremely low values in the 461
surface waters and an intermediate maximum at ~1000 m (Figure 4b), the result of 462
biological removal at the surface and regeneration at depth. The concentrations of Cd are 463
close to the results of the previous studies carried out in the similar region [35, 39]. The 464
station lying at the northwest of the BATS (35o40’N, 71o53’W; BATS: 31o40’N, 465
64o10’W) has slightly lower Cd concentrations in deep sea, but all these stations show a 466
consistent Cd-P relationship (Figure 5). 467
The comparison of this Pb data with the previous data in the NW Atlantic [11, 20, 468
40] shows the continuing decline in oceanic Pb due to the phase-out of leaded gasoline in 469
the United States and Europe (Figure 4c). The Fe data show low values below the 470
seasonal mixed layer increasing to a maximum in deep waters because of biological 471
uptake at surface and regeneration at depth (Figure 4d). These data are consistent with 472
published Fe data from the same cruise [26] although there is an offset in the upper ocean 473
(<500m). The samples used for Milne et al.’s work are from a different sampling system 474
(CLIVAR rosette) on a different day, and the offset in the shallow water could be caused 475
by a natural variation in Fe with time. Strong eddy activity observed in T-S profiles 476
supports this possibility. The Fe profile also shows a similar trend to that from a nearby 477 station (34.8oN, 57.8oW) [41]. 478 479 4. Conclusion 480
This paper describes a simple analytical method for measuring total dissolved Cu, 481
Cd, Pb, and Fe in seawater using batch-extraction of metals onto NTA Superflow resin 482
beads and isotope dilution ICPMS. The method uses only 1.3-1.5 ml of seawater per 483
element and small volume of reagents that can be purified easily, removes salt effectively, 484
and has low procedural blanks and a low detection limit. In addition, accuracy and 485
precision is ensured regardless of sample matrix (e.g. organic ligands in samples) because 486
isotope dilution is used. This study also demonstrates the potential of the simultaneous 487
analysis of multi-elements by spiking a sample with a multi-isotope enriched standard. 488
The method was applied to measure total dissolved Cu, Cd, Pb, and Fe in open ocean 489
seawaters and the results showed excellent agreement with SAFe reference values and the 490
data from previous studies. This method will be beneficial for the analysis of a large 491
number of samples, as planned in GEOTRACES program, because multiple elements can 492
be measured from a small volume of sample, which will make sample collection, storage 493
and handling much easier. 494
495
Acknowledgements
496 497
We thank the officers and crew of the R/V Melville and R/V Knorr, and Bridget 498
Bergquist and Seth John for their assistance in obtaining seawater samples; Ken Bruland 499
and Geoff Smith for collecting, bottling, distributing and compiling data for the SAFe 500
reference samples; and SAFe chief scientist Ken Johnson and GEOTRACES IC chief 501
scientist Greg Cutter. This research was supported by NSF Grants 0751409, OCE-502
0751409, and OCE-0926197 (to University of Hawaii, C-MORE subcontract) and by the 503
Kuwait/MIT Center for Resources and the Environment at MIT with funding provided by 504
the Kuwait Foundation of Science. 505
[1] W.G. Sunda, S.A. Huntsman, Limnol Oceanogr, 40 (1995) 132. 507
[2] F.M.M. Morel, N.M. Price, Science, 300 (2003) 944. 508
[3] F.M.M. Morel, A.J. Milligan, M.A. Saito, in: H. Elderfield (Ed.), Treatise on 509
Geochemistry, Elsevier-Pergamon, Oxford, 2003, p. 113. 510
[4] T.W. Lane, M.A. Saito, G.N. George, I.J. Pickering, R.C. Prince, F.M.M. Morel, 511
Nature, 435 (2005) 42. 512
[5] J. Granger, B. Ward, Limnol Oceanogr, 48 (2002) 313. 513
[6] J.G. Rueter, D.R. Ades, J Phycol, 23 (1987) 452. 514
[7] J.K. Moore, S.C. Doney, K. Lindsay, Global Biogeochem Cy, 18 (2004). 515
[8] K.H. Coale, S.E. Fitzwater, R.M. Gordon, K.S. Johnson, R.T. Barber, Nature, 379 516
(1996) 621. 517
[9] L.E. Brand, W.G. Sunda, R.R.L. Guillard, J Exp Mar Biol Ecol, 96 (1986) 225. 518
[10] P.D. Tortell, N.M. Price, Mar Ecol-Prog Ser, 138 (1996) 245. 519
[11] E.A. Boyle, S.D. Chapnick, G.T. Shen, M.P. Bacon, Journal of Geophysical 520
Research-Oceans, 91 (1986) 8573. 521
[12] J.F. Wu, E.A. Boyle, Geochim Cosmochim Ac, 61 (1997) 3279. 522
[13] J.H. Martin, R.M. Gordon, Deep-Sea Res, 35 (1988) 177. 523
[14] K.W. Bruland, R.P. Franks, G.A. Knauer, J.H. Martin, Anal Chim Acta, 105 524
(1979) 233. 525
[15] W.M. Landing, K.W. Bruland, Geochim Cosmochim Ac, 51 (1987) 29. 526
[16] J.W. Mclaren, A.P. Mykytiuk, S.N. Willie, S.S. Berman, Anal Chem, 57 (1985) 527
2907. 528
[17] H. Obata, H. Karatani, E. Nakayama, Anal Chem, 65 (1993) 1524. 529
[18] K.W. Bruland, K.H. Coale, L. Mart, Mar Chem, 17 (1985) 285. 530
[19] K.W. Bruland, Limnol Oceanogr, 37 (1992) 1008. 531
[20] J.F. Wu, E.A. Boyle, Anal Chem, 69 (1997) 2464. 532
[21] M.A. Saito, D.L. Schneider, Anal Chim Acta, 565 (2006) 222. 533
[22] J.F. Wu, Mar Chem, 103 (2007) 370. 534
[23] M.C. Lohan, A.M. Aguilar-Islas, R.P. Franks, K.W. Bruland, Anal Chim Acta, 535
530 (2005) 121. 536
[24] Y. Sohrin, S. Urushihara, S. Nakatsuka, T. Kono, E. Higo, T. Minami, K. 537
Norisuye, S. Umetani, Anal Chem, 80 (2008) 6267. 538
[25] M.C. Lohan, A.M. Aguilar-Islas, K.W. Bruland, Limnol Oceanogr-Meth, 4 539
(2006) 164. 540
[26] A. Milne, W. Landing, M. Bizimis, P. Morton, Anal Chim Acta, 665 (2010) 200. 541
[27] K.Y. Patterson, C. Veillon, T.C. Ohaver, Anal Chem, 66 (1994) 2829. 542
[28] A.G. Adriaens, W.R. Kelly, F.C. Adams, Anal Chem, 65 (1993) 660. 543
[29] K.S. Johnson, E.A. Boyle, K.W. Bruland, K.H. Coale, C. Measures, J.W. Moffett, 544
A.M. Aguilar-Islas, K. Barbeau, B. Bergquist, A.R. Bowie, K. Buck, Y. Cai, Z. Chase, 545
J.T. Cullen, T. Doi, V.A. Elrod, S.E. Fitzwater, M. Gordon, A. King, P. Laan, L. Laglera-546
Baquer, W.M. Landing, M.C. Lohan, J. Mendez, A. Milne, H. Obata, L. Ossiander, J. 547
Plant, G. Serthou, P.N. Sedwick, G.J. Smith, B. Sohst, S. Tanner, C.M.G. van den Berg, J. 548
Wu, EOS, 88 (2007) 131. 549
[30] E.A. Boyle, B.A. Bergquist, R.A. Kayser, N. Mahowald, Geochim Cosmochim 550
Ac, 69 (2005) 5165. 551
[31] J. Bell, J. Betts, E.A. Boyle, Deep-Sea Research I, 49 (2002) 2103. 552
[32] R.J. Motekaitis, A.E. Martell, Mar Chem, 21 (1987) 101. 553
[33] S.G. John, J.F. Adkins, Mar Chem, 119 (2010) 65. 554
[34] A.K. Hanson, C.M. Sakamotoarnold, D.L. Huizenga, D.R. Kester, Mar Chem, 23 555
(1988) 181. 556
[35] K.W. Bruland, R.P. Franks, in: C.S. Wang, E.A. Boyle, K.W. Bruland, J.D. 557
Burton, E.D. Goldberg (Eds.), Trace Metals in Seawater, Plenum Press, New York, 1983, 558
p. 394. 559
[36] P.A. Yeats, S. Westerlund, A.R. Flegal, Mar Chem, 49 (1995) 283. 560
[37] R.M. Moore, Earth Planet Sc Lett, 41 (1978) 461. 561
[38] J.-M. Lee, E.A. Boyle, R. Kayser, Ocean Sciences Meeting, Eos Trans. AGU, 562
2010, p. CO25B. 563
[39] C.M. Sakamoto-Arnold, A.K. Hanson, D.L. Huizenga, D.R. Kester, J Mar Res, 45 564
(1987) 201. 565
[40] B.K. Schaule, C.C. Patterson, in: C.S. Wong (Ed.), Trace Metals in Sea Water, 566
Plenum, New York, 1983, p. 487. 567
[41] J.F. Wu, E. Boyle, W. Sunda, L.S. Wen, Science, 293 (2001) 847. 568
569 570
Table 1. Fe released from various vials with different positions. The Fe concentrations were
measured in 0.5M HNO3 after 150µl of the 0.5M HNO3 was stored in empty vials for five
days, which corresponds to the Fe procedural blank coming from the vials. Eppendorf A and B are from different lots.
Vials Position Fe (nM)
Eppendorf A Right-side up 0.004 Upside-down 0.021 Eppendorf B Right-side up 0.005 Upside-down 0.043 Molecular BioProduct Right-side up 0.041 Upside-down 0.030
Table 2a. Typical PQ2+ operating conditions for Cu, Cd, and Pb analysis. Instrumental Parameter Set point
Forward power 1450 W
Reflected power <3 W Plasma Ar gas flow 15.1 l min-1 Carrier Ar gas flow 1.18 l min-1
Auxiliary Ar gas flow 1.14 l min-1 Acquisition method Peak jump mode Channels per mass 3
Channel spacing 0.02
Number of sweeps 200
Dwell time 10 ms/peak
Data acquisition time 73 sec
Table 2b. Typical Isoprobe operating conditions for Fe analysis. Instrumental Parameter Set point
Forward power 1350 W
Reflected power <1 W Hexapole Ar gas flow 1.8 ml min-1 Hexapole H2 gas flow 2.5 ml min-1
Expansion pressure 3x10⁻¹ mbar Hexapole pressure 4x10⁻⁴ mbar Analyzer pressure 2x10⁻⁷ mbar Nebulizer gas flow 0.8 l min-1 Cool gas flow 14 l min-1 Aux. gas flow 1.0 l min-1 Data acquisition time 24 sec
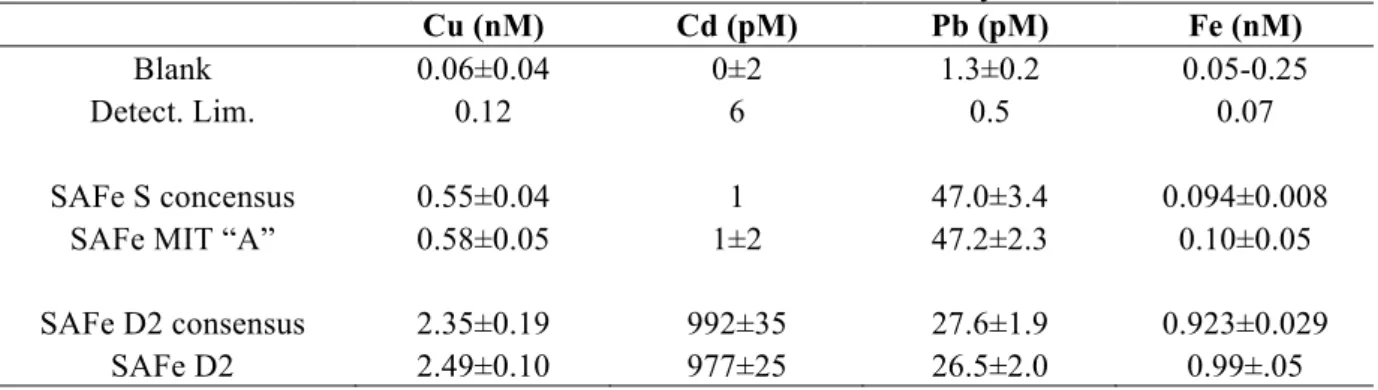
Table 3. Procedural blank and detection limit of this method (± 1σ) and comparison of the
SAFe consensus Cu, Cd, Pb, and Fe values with those determined by this method.
Cu (nM) Cd (pM) Pb (pM) Fe (nM)
Blank 0.06±0.04 0±2 1.3±0.2 0.05-0.25
Detect. Lim. 0.12 6 0.5 0.07
SAFe S concensus 0.55±0.04 1 47.0±3.4 0.094±0.008 SAFe MIT “A” 0.58±0.05 1±2 47.2±2.3 0.10±0.05 SAFe D2 consensus 2.35±0.19 992±35 27.6±1.9 0.923±0.029
Table 4. Concentrations of Cu, Cd, and Pb in 65Cu, 110Cd, and 204Pb enriched isotope spikes. When 25µl of each isotope spike is added to 1.3ml sample, it increases the procedural blank of the other elements as much as the numbers in parenthesis.
Cu (nM) Cd (nM) Pb (nM)
65Cu spike 0.031 (<0.001) 47.15 (0.28)
110Cd spike 0.306 (0.002) 8.07 (0.05)
Figure captions
Figure 1. Relationships between the percent recovery of Cd and Pb and the sample pH when
~200 resin beads were added to 1.3ml of sample. Notice the difference in scales on the vertical axes. Various seawater samples were used for Pb experiments; Pb recovery efficiencies also varied with the nature of the samples.
Figure 2. Relationships between percent recovery of Cu, Cd, and Pb and the number of days
allowed for sample-resin binding. Samples were prepared at pH 6.5 for Cu and Cd and at pH 5.3 for Pb, and ~200 beads were added to the samples (■). The percent recoveries shown as white squares (□) are when ~400 resin beads were added to the samples.
Figure 3. Relationships between percent recovery of Pb and the number of NTA resin beads
added to the sample. The samples were prepared in pH 5.0-5.3 and three days were allowed for sample-resin binding. Pb was released from the resin for 2-3 days. In another study using different seawater, Pb recovery up to 80-90% could be achieved by adding 2400 beads to the samples.
Figure 4. Profiles of Cu, Cd, Pb, and Fe at BATS analyzed by the ID-NTA bead-ICPMS method
and comparison with the data from nearby stations in Sargasso Sea. The Cu and Cd profiles are from Bruland and Franks, 1987 (34o06’N, 66o07’W), Hanson et al., 1988 and Sakamoto-Arnold
et al., 1987(35o40’N, 71o53’W). The Pb profiles are from Schaule and Patterson, 1983 (sampled in 1979), Boyle et al., 1986 (sampled in 1984), Wu and Boyle, 1997 (sampled in 1993), and others are unpublished data. The Fe profiles are from Wu et al., 2001 (34.8oN, 57.8oW) and Milne et al., 2010 (same cruise, different cast with different sampling device).
Figure 5. Cd-P relationship in the GEOTRACES-BATS station (this study) compared with that
from nearby stations. The phosphate data were generated using an Astoria-Pacific rapid flow analyzer and standard chemistry based on molybdenum blue method.