HAL Id: hal-02798073
https://hal.inrae.fr/hal-02798073
Submitted on 5 Jun 2020
HAL is a multi-disciplinary open access
archive for the deposit and dissemination of
sci-entific research documents, whether they are
pub-lished or not. The documents may come from
teaching and research institutions in France or
abroad, or from public or private research centers.
L’archive ouverte pluridisciplinaire HAL, est
destinée au dépôt et à la diffusion de documents
scientifiques de niveau recherche, publiés ou non,
émanant des établissements d’enseignement et de
recherche français ou étrangers, des laboratoires
publics ou privés.
Case study: multidimensional comparison of a local and
global wine supply chain in France (task 3.5)
Jean-Marc Touzard, Camille Maffezzoli
To cite this version:
Jean-Marc Touzard, Camille Maffezzoli. Case study: multidimensional comparison of a local and
global wine supply chain in France (task 3.5). [Technical Report] 2015. �hal-02798073�
Case Study XY (Task 3.5)
Authors – Partner
The research leading to these results has received funding from the European Union’s
Seventh Framework Programme for research, technological development and
demonstration under grant agreement n° 311778
Touzard J-M., Maffezzoli C.
INRA, National Institute of Agricultural Research, UMR Innovation, Montpellier
Case Study : multidimensional comparison of
a local and global wine supply chain (France)
To be quoted as:
Touzard J-M., Maffezzoli C. (2015) Glamur project multidimensional comparison of a local
and global wine supply chain. INRA
DRAFT Case Study: multidimensional comparison of a local and global wine supply chain (France)
(Task 3.5)
CONTENTS
1.
Introduction
7
2.
Background: case studies
11
2.1.1.
Physical, geographical distance between producers and consumers ... 12
2.1.2.
Governance of the supply chain ... 13
2.1.3.
Category of wine quality ... 14
2.1.4.
Mode of handling: Packaging ... 15
2.3.1.
Global wine chain: Wine from Languedoc-Roussillon to Switzerland ... 16
2.3.2.
French local wine chain ... 19
3.
Research Design: research questions and indicators
22
3.3.1.
Performance evaluation approach ... 26
3.3.2.
Expert Workshop : Methodology feedback ... 27
3.3.3.
Final methodological matrix ... 27
4.
Methods of data collection and analysis
28
4.1.1.
Primary data collection: Interviews and survey ... 28
4.1.2.
Secondary data collection ... 28
5.
Results
31
1.1.
Presentation and structure of the report
7
1.2.
Introduction to the French wine sector
8
1.3.
The great transformation of the Languedoc-Roussillon vineyard
10
2.1.
Distinction of a “local” and “global” wine chain
11
2.2.
Scope of the value chains under study
16
2.3.
Presentation of the case study
16
2.3. Main critical issues of the local and global chains
22
3.1.
Research Questions, Specific objectives
22
3.2.
Attributes and Indicators selection and contextualizing
22
3.3.
Contextualizing and benchmarking of the indicators
26
4.1.
Plan for data collection
28
4.2.
Data analysis and ranking
30
Conclusion
49
References
51
ANNEXES
54
LIST OF FIGURE AND TABLE
Figure 1 : Evolution of the total area in the Languedoc-Roussillon vineyard ... 10
Figure 2 : Evolution of average yield in Hérault department ... 11
Figure 3 : Map of the Languedoc PDO and PGI vineyard ... 15
Figure 4 : Scope of the Global Bulk Wine Chain ... 17
Figure 5 : Geographic scope of the global bulk wine chain ... 18
Figure 6 : Scope of the Global Bottled Wine Chain ... 18
Figure 7 : Geographic scope of the global bottled wine chain ... 19
Figure 8 : Summary of the chains performances assessment ... 32
Figure 9 : Chains Performances according to the attribute creation and distribution of added value
... 35
Figure 10 : Performances of the chains for Governance attribute ... 38
Figure 11 : Key information given to consumers ... 39
Figure 12 : Distribution of environmental practices within the chains ... 41
Figure 13 : Performances of the chains for attribute Pollution ... 43
Figure 14 : Food safety standards and controls practices within the chains ... 46
Figure 15 : Chain performances for the attribute “Territoriality” ... 48
5.1.
Attribute Creation and Distribution of Added Value (Economic Dimension)
33
5.2.
Attribute Governance (Social and Economic Dimensions)
35
5.3.
Attribute Information and Communication (Social and Economic Dimensions)
38
5.4.
Attribute Biodiversity (Environmental Dimension)
39
5.5.
Attribute Pollution (Environmental Dimension)
42
5.6.
Attribute Resource Use (Environmental Dimension)
44
5.7.
Attribute Food Safety (Health, Economic and Social Dimensions)
45
Table 1: Table of key dimensions for the distinction "local" and "global"
12
Table 2 : Detail of the selected global chains X
17
Table 3 : Description of the two selected local chains
20
Table 4 : Description of new indicators specifically created for the case study
23
Table 5 : Final grid of indicators
24
Table 7: List of expert for the benchmarks of indicators and critical review of preliminary results27
1. Introduction
1.1. Presentation and structure of the report
This case study report presents the results on the performance of local and global wine chains. The case study is carried out by INRA but proceeds from a collective work with the FIBL team. Two local and two global chains are analysed in France. The two local chains (LC) consider wines produced, bottled and sold in the surroundings of Montpellier, Languedoc-Roussillon region. In the first case of LC wine is sold on farm, directly to consumers, who can be local inhabitants or tourists. In the second LC case, bottles of wine are sold to an intermediary (restaurant, wine shops), whose commercial activity is located in Montpellier. For the global chains (GC), the first case corresponds to basic wine without PDO (protected designation of origin) label, sold in bulk from a wine cooperative to a wholesaler, bottled far from the production area, branded as “J.P Chenet” trade mark, and distributed in Switzerland through supermarkets. The second GC case is a “specific «wine, guaranteed by PDO and/or organic label, bottled on farm and exported through many intermediaries to Switzerland. For our analysis we consider all stages from the grape grower to the consumers.
The report is organised according to the GLAMUR research questions (i.e. the five dimensions of performance) applied to both French and Swiss wine chains. We specify these questions for the wine sector by using literature review, interviews of experts and primary data already collected by the team. We took into account the national (French and Swiss) challenges on food chain performances, as they have been reported in WP2, specifically territoriality and global competition. Discourse on food in Switzerland is more oriented to biodiversity, land use planning, landscape protection and traditional ways to manage land (Comparative report, 2014). France mostly faces the challenge of maintaining its leading position in the global wine market by increasing productivity and quality and adapting the wines to the evolution of consumer’s preferences.... without losing the reference to patrimonial style of food, local know-how and local resources, embodied in the notion of “terroir” 1(Comparative Report, 2014).
Research objectives and relevant attributes have been defined with FIBL team, taking into account similarities and differences of our two countries. Following the GLAMUR systemic and analytic perspective, indicators have then been selected and adapted from reference grids (f.i. SAFA) or from works on the wine sector, in order to respond to the research questions and to assess and compare wine chains performances regarding specific attributes.
In the first section, we briefly present the French wine sector embedded in both national and international markets ; in the second section we describe the background of our case studies focusing on the distinction between “local” and “global” wine chains, the scope of the value chains and general characteristics of the case studies. In the third section, we present the research framework with specific questions and objectives, the selection of attributes from the GLAMUR list, and the definition and contextualization of the selected indicators. In the fourth section we develop our method of data selection and analysis. In the last section we present the results of our work, reviewing and discussing the selected attributes. This report reflects the work in progress.
1 The terroir is a delimited geographical area in which a human community, built in the course of its history collective knowledge production, based on a system of interactions between physical and biological environment, and a set of human factors. The socio-technical paths and brought into play, reveal an originality, confer typicity and lead to a reputation for a good native of this geographical area. (National Institute of Appellations of Origin, INAO)
1.2. Introduction to the French wine sector
Wine is a strategic and emblematic product for France, combining in different ways the local and global dimensions of markets. Indeed the segmentation of the French wine market is based on specific links to local areas, and France still plays a leading role in the global wine market.
Since 2005, French wine production has varied between 50 and 40 million hectolitres per year, from which between 15 and 12 million hectolitres have been exported. As far as the volume is concerned France shares with Spain and Italy the first ranking position worldwide for both wine production and wine export. However, France remains the leading country in terms of value for both production and export (17% of the world production, 15% of exports), benefiting from higher prices for its wine (OIV, 2013). France is also the first wine consumption market (purchases of 30 million hectolitres in 2012), mainly supplied by national production, and only by 5 million hectolitres of imported wines. French average consumption per inhabitant reaches 50 litres per year in 2012, one of the highest levels in the world (behind Vatican), but resulting from an important decrease since 1970, when French people used to drink around 120 litres per year. French wine consumption dramatically changed during last 40 years, shifting from daily cheap red table wine, to less frequent drink of quality (and more expensive) wines.
Graph 1 : Volumes of wine production, import and export, France, since 2002
Source: own elaboration on data provided by FranceAgriMer, 2013
The strategic role played by wine in the French society reflects many aspects: 10,000 20,000 30,000 40,000 50,000 60,000 10 00 h ec to lit res importations françaises exportations françaises production de vin
- In 2012, wine and spirits provided 9.5 billion euros of surplus for the French trade balance, becoming the second best item after aeronautics. Wine is thus a basic sector for the French economy, injecting value from outside. This role is strengthened by externalities on other economic activities linked to tourism, gastronomy and culture. Wine is one of the main attributes cited by foreigners to qualify the French attractiveness (Bastian, 2008);
- Vine plays a specific role in land and landscape management. Vine covers 788 700 ha, among which 771 500 ha are dedicated to wines (Agricultural Census 2010). This area covers 2.6 % of the French Agricultural land and contributes to 15% of the agricultural production in value. Wine is thus an intensive production that maintains economic activity in rural areas, sometimes very far from cities and economic centres. Vineyards also have positive impacts on landscape and on reduction of fire risks in south of France;
- Wine provides jobs through 87 400 farms cultivating vine (Agricultural Census 2010). The number of grape growers is declining, but wine production keeps on generating 250 000 direct employments, i.e. 23 % of agricultural labour (AWU). Different studies also suggest that more than 500 000 jobs are linked to the whole wine industry in France (FranceAgriMer 2012). The wine sector is thus work intensive and gives opportunity to maintain employment;
- Wine is also linked to local and regional identities. Vineyards are located in specific areas where producers have defined “specific wine quality” linked to “specific local conditions”, both natural (soil, climate) and human (local knowledge…). Wine is thus considered as part of local cultures, leading to develop the French notion of “terroir”, recognized by PDO labels. Patrimonial and symbolic dimensions of wine have strong impacts on its value (price). The quantitative decline of the wine national consumption, a strong competition in the global wine market with "New World" countries (Australia, USA, Chile, South Africa…) and specific CAP policy (f.i. subsidies for uprooting) led to the decrease of vine area and wine production in volume (but less than in Italy and Spain). Nevertheless the French wine industry remains competitive and creates value through quality strategies. These strategies rely on different production systems and quality signs recognized by consumers:
- French wines are mainly differentiated by Geographical Indications, involving 90% of the vine growers and covering around 80% of the national wine purchases. PDO labels (AOP/AOC) are predominant (50% of purchase), strictly referring to “terroirs”, when PGIs reach 28 % of the market, mainly referring to varieties and regions. The production of wines without GI has decreased since 1970 but these wines are finding new markets by taking advantages from their new right to sale variety wine;
- The market segmentation is also based on complementary signs, such as producer’s names and trademarks. References to environmentally friendly practices are also promoted. Different grape production systems are coexisting in each region: conventional (high use of pesticide), reasoned or integrated (reduction of pesticide use according to “observations and needs”), organic (label AB) and biodynamic. Organic viticulture has a growing influence, but remains limited (6% of the area in 2012), when “reasoned viticulture” has extended to a large part of the French Vineyard, but has shown limited impact in terms of pesticide use reduction (Touzard, Pull, 2013).
Wine technical and marketing chains are organized into different steps: i) production of grapes; ii) wine making process which can be developed on farms (“domains”, estates), in cooperative cellars (around 50% of the processed grapes in France) or by wineries (buying grapes, mainly in Champagne); iii) storage (on farm, in cooperative cellar or in traders cellars; iv) filling (bulk, bottle or Bag In Box); v) marketing through different ways and retailers; vi) place of purchase and/or consumption (on farms, restaurant, stores, Super Markets…). 1/3 of the French wines are bottled on the property and about 2/3 are commercialized through retailers. A wide diversity of chains are thus co-existing, from direct sales (including wine tourism) and local supply chains of restaurants, to global chains exporting both basic wine in bulk to super markets and bottles of “icon” wine sale in specialized stores.
1.3.
The great transformation of the Languedoc-Roussillon vineyard
The French local and global wine chains will be assessed by starting from grape-growers located in the Languedoc-Roussillon vineyard, in the South of France. Until the late 1980s, Languedoc-Languedoc-Roussillon was the first vineyard in Europe, where grape was collected from about 100,000 farms, and processed into basic wine by a large number of local co-operative cellars. 80% of the Languedoc wine production was sold in bulk as “table wine”. During the last 30 years, this region has been converting to the production of higher quality wines with two different strategies: French ‘Appelation d’Origine Contrôlée’ (AOC/PDO) certified wines coming from the upland vineyards, and varietal wines (mainly certified as IGP/PGI) from the flatlands. This radical transition from table wines to quality wines production has been pulled by the decrease of the table wine demand and price, but it has also been accompanied by two EU structural measures, in order to better adapt supply to demand: "up-rooting premium" (PAD) matching the highest yield vines, and “vineyard restructuring premium supporting the plantation of new aromatic varieties. As consequence of this great transformation the Languedoc-Roussillon vineyard reduced by almost 45%from 400 000 ha to about 230,000 ha currently (FranceAgriMer, 2012).
Figure 1: Evolution of the vine area in Languedoc Roussillon : 1800 - 2010
Figure 1 : Evolution of the total area in the Languedoc-Roussillon vineyard
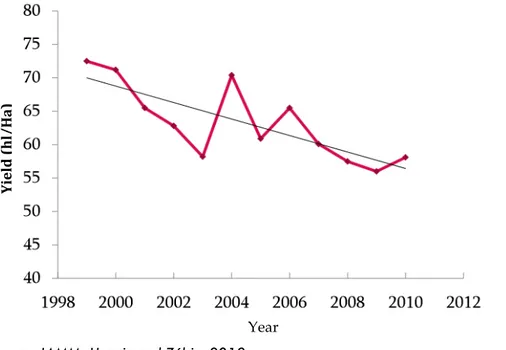
The volume of production also dramatically decreased from 30 million hectolitres to about 12 million in 2013. The reduction of the vine area mainly explains this production fall, but the average yield also declined, as it can be shown for the Hérault department (one of the four wine departments of the administrative Languedoc-Roussillon region) where 10 hl / ha have been lost in 10 years (Hannin and Zébic, 2012). This yield decrease resulted from both the plantation of less productive new varieties and the impacts of climate change (accentuation of dryness during summer).
Figure 2 : Evolution of average yield in Hérault department
Source: IAMM; Hannin and Zébic, 2012
Nevertheless, the structure of both the Languedoc vineyard and the Languedoc wine production has radically changed. In 2014, low quality varieties have become marginal and table wine covers less than 20% of the value of Languedoc wine production. Many wine farms and wine cooperatives disappeared, but the incomes of the grape growers and wine producers are increasing again. Both cooperative cellars and private cellars have been involved in this transition, adopting a wide range of technical and marketing innovations.
2. Background: case studies
This section presents the four key criteria selected according to their capacity to differentiate local and global chains. We first explain each criterion in the context of Languedoc wine sector, and then identify specific characteristics of each criterion that could differentiate local and global chains.
2.1. Distinction of a “local” and “global” wine chain
In summary, our criteria that distinguish local from global are mentioned in the table below: 1. Physical / geographical distance between producers and consumers
2. Governance of the supply chain 3. Category of wine quality
4. Mode of handling and packaging
Year Yi el d ( hl /Ha )
The local chain is characterized by a limited number of intermediary stakeholders while the final product presents a defined and recognizable bottle which is sold in cellar or specific wine shops or restaurants. The global chain is characterized by a more intricate and long supply chain where wine is exported in bulk and bottled. The final product can be found principally at retailers’ stores.
Table 1: Table of key dimensions for the distinction "local" and "global"
KEY-DIMENSION LOCAL GLOBAL
PHYSICAL, GEOGRAPHICAL DISTANCE BETWEEN
PRODUCERS AND CONSUMERS
Production, process bottling and distribution in Languedoc, Montpellier area. Production, process in L-R, bottling in Bordeaux and distribution in bottle in Switzerland Production, process, bottling in Languedoc-Roussillon and distribution in Switzerland ORGANIZATIONAL MODEL AND MANAGEMENT OF THE SUPPLY CHAIN
Production model: Family and large scale domains making wine on farm
Production model: Grape-growers, cooperatives, federated marketing coop Switzerland supermarkets Production model: Large scale domains with employees making
wine on farm Specialized stores, restaurants Direct sell at the cellar 1 local intermediary between producer and consumer (not supermarkets) PRODUCT QUALITY LINK WITH
TERRITORY hillside and PDO Languedoc
plain ; PGI Pays d’Oc
Hillside; PDO/AOC Languedoc (& organic
wine) MODE OF
PACKAGING Bottle Bulk Bottle
2.1.1. Physical, geographical distance between producers and consumers
Distance between wine producers and wine consumers are key criteria for GLAMUR. Two objective dimensions of this distance have been chosen: the number of intermediaries and the geographical distance between production and consumption. A wide range of situations can be noted as presented below:
The general structure of the Languedoc wine supply chain has been described by Domergue and Couderc in 2009. Various categories of actors and transactions have been pointed out in the marketing chains. They noted that the frontiers between production and marketing are often confused because of the development of both "downstream" activities by cooperatives (f.i. investing in selling points) and “upstream” activities by traders (f.i. buying vineyards). Nevertheless the mass-market remains the major distribution chain for Languedoc wine at national level (around 40% are sold in French supermarkets) and international level (20% exported through long chains). About 20% of the turnover is made through regional sales and around 20% are supplying quality specialized long chains, at national and international scales.
Source :INRA
2.1.2. Governance of the supply chain
1. Organizational model of wine production
Languedoc wines proceed from two main organisational models, divided in two sub-models: a) Private domains: the same economic unit is cultivating grape, making wine and selling wine
•
Large scale domains with employees; more than 40 hectares, manager and permanent employees, strategy of asset valorisation, production of quality wines through labels and own trade mark….•
Family domains; mainly between 10 and 40 hectares, strategy of income increasing, innovations carried out by the farmers, helped by professional adviser (chamber of agriculture), production of personified quality wines….b) Cooperative system: There are different types of cooperatives, according to their size, specialization, quality orientation, business model, management... Cooperatives can also join “federated cooperatives” mainly for marketing issues. Two kinds of cooperative members (grape growers) are noted:
•
Full-time grape growers (from 8 to 25 hectares), often directly involved in the cooperative board, aiming at increasing family income, helped by cooperative technicians and professional advisers.•
Small grape growers (less than 8 hectares, generally less than 4 hectares) that are part-timers or retired people, combining social and economic goals, often representing the majority of the cooperative members2. Marketing Chain management
Different governance models and flow managements are coexisting in the wine supply chains. We can identify the main actors or structures that control flows of information and value, and capture added-value. The study conducted in 2003 by Jerome Chandes and Dominique Estampe suggests several models of wine marketing chains. Four models can be found in Languedoc:
1. Supply chains driven by the producer who mastered most of the operations, from the grape production to the wine final marketing. This is the case of many reputed wine estates (Domaines or Chateaux) but also of some wine cooperatives managing their own network of sellers in different niche markets.
2. Supply chain driven by supermarkets, final wholesalers or network of wine shops (i.e. Nicolas), through their own brands. This downstream governance is limited to specific market segments or supermarket companies (i.e. Intermarché, Auchan) but has relevant impact on Languedoc vineyard (vertical integration to many cooperatives). 3. Supply chains driven by wholesalers or traders who purchase wine in bulk and develop their own trademark in the international markets, distributing bottled wine in different final chains (supermarkets, wine shops, collective restaurant, hotel chains…)“Grand Chais de France” illustrates this case, in particular by selling variety wine through “JP Chenet” trade mark.
4. Supply chains co-driven by producers and traders at regional scale through “marketing boards”. Champagne illustrates this case, which is not really developed in Languedoc (weakness of the “wine interprofessions”)
2.1.3. Category of wine quality
Languedoc vineyard has a specific profile. In contrast to the national level, Languedoc IGP/PGI vines cover a larger area (61%) than PDO/AOC vines (31%). It results a diversified market structure (in volume) offering 56% of IGP/PGI wines (including 45% IGP Pays d'Oc), 21% of PDO / AOC wines, and 23% of wines without GIs (STG).
We consider the three main categories of wines in our study: Pays d'Oc PGI, Languedoc PDO, and wine without GI. Pays d'Oc is the most important category of wine in Languedoc, and the main French PGI label. The label is used in order to guarantee the regional origin of “variety wines” (32 authorized varieties proceeding from different French regions or recently created by research). Pays d'Oc wines are mainly distributed in global chains. About 60% are exported and Switzerland is its 7th importer country (29 113 hl in bottle and 71 386 hl in bulk in 2011). The national PGI market is driven by a few retailers (Grand Chais de France…) and supermarkets. Small stores, cafes and restaurants are supplied by non-specialized retailers (such as distriboisson or C10) or in few cases by direct marketing chains.
PDO wines are produced by about 30% of the Languedoc wine-growers and grape-growers (in many cases in addition to Pays d’Oc). PDO label indicates that the wine comes from traditional varieties and that all stages of process are located in the same delimited area (the “terroir”) giving specific characteristics to the wine (INAO, 2012). About 40% of Languedoc PDO wines are directly exported, 30% are providing French supermarkets and 30% are sold in traditional or short chains (direct sale, restaurants, specialized stores…).
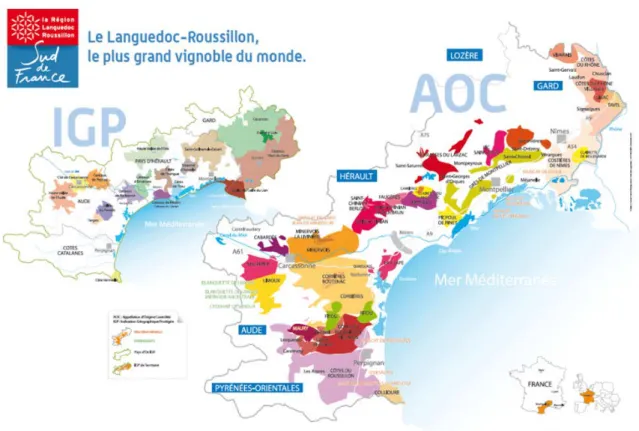
Figure 3 : Map of the Languedoc PDO and PGI vineyard
Source :
http://www.sud-de-france.com
Wines without Geographical Indication or TSG, (VSIG or "Vin Sans IG" in French), historically called "vin de table" (table wine) in France, correspond to basic wines, blended, sold in bulk and paid according to its alcohol degree. The production is decreasing but remains relevant for some cooperatives located in plains (high yields). Small volumes are locally sold to local consumers (members of coop).
2.1.4. Mode of handling: Packaging
As far as the first sale is concerned (from domains or cooperatives), three kinds of packaging may be distinguished: wines sold in bulk, wine sold in bottle, wine sold in Bag in Box (BIB). These types of packaging are coexisting in the global market.
The market in bulk is mainly supplied by cooperatives, collected by traders (French or foreign firms) and bottled near the main consumers centres (north, west or east of France, other countries). There are at least two intermediaries. All labels are sold in bulk, but TSG (99%) and PGI (85%) wines are first concerned (about half part for PDO volume). Direct market in bulk is less developed in Languedoc than in other regions (f.i. in Loire valley) and is limited to a few direct selling from cooperatives.
Wines locally bottled and sold in the global market are supplying "specialized markets", with higher qualities and prices. Bottling “on farm”, “on cooperative cellar” or “in Languedoc” is seem as a complementary guarantee of origin and quality (vintage) and as a potential source of additional benefit. Bottling in the wine production area is imposed by some PDO code of practices. In fact bottles are necessary tools to conserve wines for long period, including at home. They provide local markets for all kinds of labels, especially local restaurant where “opening a bottle of wine” is a strong tradition.
BIB (Bag in Box) is a more recent packaging used for basic and intermediary wines, labelled as TSG, PGI or PDO.
2.2. Scope of the value chains under study
Our preliminary analysis of the wine sector leads to choose a pair of chains in the Languedoc-Roussillon region. This region includes a wide range of wines (according to their quality, packaging, price), distributed through both "local" chains (sales on farm or to local restaurants and stores), and "global" chains (export and national market, supermarkets). Languedoc remains the first French vineyard in terms of volume and surface (236500 ha in 2010) and the third in value (after Champagne and Bordeaux). Languedoc vineyard includes 2700 private domains processing their grape and selling their wine, and 211 wine cooperatives (70% of the regional production of wine) supplied by 18 000 grape growers (Agreste 2013).
As in the GLAMUR DoW it is required that some global case studies are conducted in common, and that the volumes of Swiss wine sold abroad are really low, both countries decided to analyse a common global supply chain of French wine exported to Switzerland. Moreover, specific local supply chains have been identified in both countries and described. Therefore, concerning the definition of both chains it is important to highlight the following characteristics:
2.3. Presentation of the case study
2.3.1. Global wine chain: Wine from Languedoc-Roussillon to Switzerland
For the global chain we will take the case of export market, in bulk and bottle. We focus on export from Languedoc to Switzerland, after having checked that these flows were important. More than 100 000 hectolitres per year have been exported to Switzerland (during the last 5 years) and this country belongs to the top ten importer countries of Languedoc wines. The first quick analysis (expert interview) 2 confirm that many actors are involved in these (long) chains and that two subcategories of global wine chains can be identified:
- Wine sold in bulk by cooperatives and unions of cooperatives and imported by wholesalers and distributors from Switzerland. These wines are produced by grape grower members of the cooperative. The wine is sold in bulks to French and Swiss traders, wholesalers and bottlers (e.g. LGCF group, Schenk, Bataillard, Scherer&Bühler or HaeckyGruppe). These importers provide other wholesalers non-specialized in wine, like retailers and supermarket. The wine is sold under the retailer’s brand combined with a geographical indication (PDO/IGP) or the label “Vin de France” mentioned on the bottle.
2 Refer to the Quick Scan methodology implemented for wine chains : Step 1 : identification of a pair of chains and listing of preliminary sources, Step 2 - Selection of 5-10 key respondents, representative of FSC actors, Step 3 - Interviews. About ten interviews were conducted with experts in the wine sector to define i) the criteria for differentiation of local and global chains and, ii) Key issues related to chain performance.
- The export market specialized in bottled wine mobilizes other operators within the global chain. Bottled wine is thus sold on the global market by wine estates and cooperatives. Production strategy enhances the quality image and the link with the “terroir” is identified by the labels DOP or PGI or suggested by the name of the producer. Swiss operators provide specialized stores and restaurants.
Table 2 : Detail of the selected global chains
selection criteria TWO GLOBAL CHAINS
Representative area Region of production: Hérault department (Languedoc-Roussillon) Type of product Still wine, red wine, various vine varieties
Organization mode for the wine production
Grape-growers, cooperatives,
federated marketing coop Domains making wine on farm Geographic situation /
wine category Plain ; PGI Pays d’Oc
Hillside; PDO/AOC Languedoc (& organic wine)
Packaging bulk bottle
Distribution chain
export to Switzerland by traders, bottled far from production place, sold in supermarket
export to Switzerland by specialized traders
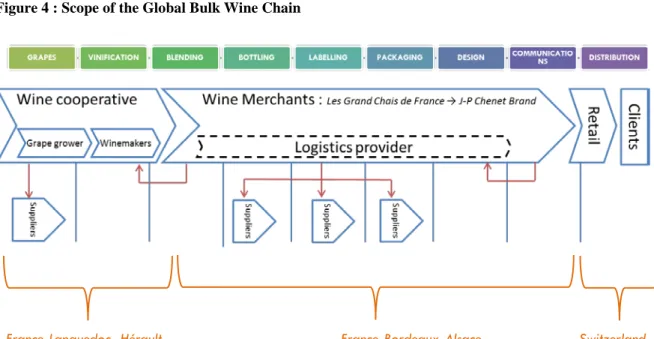
Figure 4 : Scope of the Global Bulk Wine Chain
France-Bordeaux-Alsace
Figure 5 : Geographic scope of the global bulk wine chain
Figure 6 : Scope of the Global Bottled Wine Chain
Figure 7 : Geographic scope of the global bottled wine chain
2.3.2. French local wine chain
In Languedoc, local chains apparently have a weak position in the whole wine market (less than 20% of the volume). However, direct sales at the cellar are traditional practices and are increasing in terms of volume, according to the last agricultural census. Local chains are characterized by i) a limited number of intermediaries, ii) geographical proximity between production and consumption (in the same region), iii) recognition of the local identity/origin of the wine, through relevant label (on the bottle) or reliable information given by the wine growers.
Wine tourism could be considered part of these local chains, even if the bottles of wine are not always drunk in the region. Wine tourism is defined by all the services provided to tourists in the vineyards (winery visits, tastings, accommodations, catering and secondary activities connected to the wine and to regional traditions) (Bussereau, 2007).
In our study, we identify wine "local chains" as chains located in the Hérault department, one of the four wine departments of the administrative Languedoc-Roussillon region. We will focus on the wine produced in "family domain", even if small cooperatives also sell wine to local consumers. We will give priority to PDO wines, proceeding from “local” varieties like Syrah, Carignan, Grenache, and Mourvèdre...but we will also take into account other signs of local identity, including direct acknowledgment of the producer by the consumers. The head city of Herault department is Montpellier agglomeration (400 000 inhabitants). We will focus on two local chains: direct selling on the domain (to local people or tourists); and short chains providing wine to stores and restaurants in Montpellier. Quality guarantees implied in the PDO and PGI labels are substituted with interpersonal relations between consumers and producers, allowing them to judge and know the quality of the wine sold. Vine growers are interested in value the link to the place, "territory" and "terroir", local resources and know-how (traditional grape varieties, landscapes, networks, customers). 1. Languedoc- wine production and bottling 2 Switzerland-Distribution 700km
Direct sale at the cellar (private cellar) to local consumers and tourists,
Sell to one local intermediary, (restaurants, territory specialized stores, specialized events) commercializing the products in Hérault.
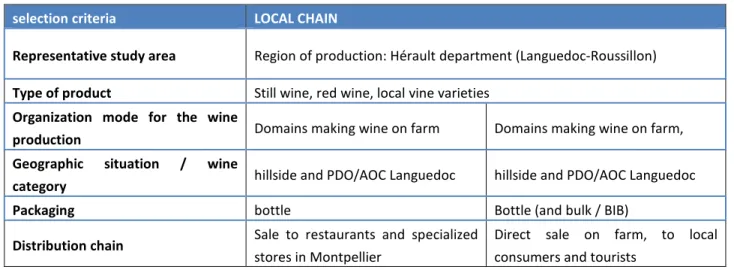
Table 3 : Description of the two selected local chains
selection criteria LOCAL CHAIN
Representative study area Region of production: Hérault department (Languedoc-Roussillon) Type of product Still wine, red wine, local vine varieties
Organization mode for the wine
production Domains making wine on farm Domains making wine on farm, Geographic situation / wine
category hillside and PDO/AOC Languedoc hillside and PDO/AOC Languedoc
Packaging bottle Bottle (and bulk / BIB)
Distribution chain Sale to restaurants and specialized stores in Montpellier
Direct sale on farm, to local consumers and tourists
1. Languedoc-Production-bottling
and distribution of wine
100 km Figure 6: Scope of the Local Wine Chain
2.3. Main critical issues of the local and global chains
The main issues3 related to the wine supply chains reflect for both countries the current situation of the sector as well as the future challenges to overcome. These issues are listed below and they were used to select the indicators listed in the next section.
• Pesticides and fertilizers used to obtain high yields • Impact on human health from pesticides and fertilizers • Soil quality and preservation
• Management of water resources
• Biodiversity of grapes and surrounding plants
• Climate change impact, which makes the preservation of ancient varieties difficult • Energy footprint and fuel consumption
• Fraudulent activities (mix of different type of wines not announced in the packaging to increase benefits) that affect traceability of the final product
• The role of State government as well as GI bodies in leading multiple and strict controls • Food quality link with nutritional values (contents of polyphenols) and alcohol consumption • Working condition and producers’ livelihoods
3. Research Design: research questions and indicators
3.1. Research Questions, Specific objectives
Due to the high number of research questions listed by each country, we transformed them into research objectives which will be easier to analyse for our case study. These are listed below:
1. To analyse the main structures, interrelationships and complementarities between the global and local supply chains for both countries taking into account nature of upstream and downstream relations.
2. To examine along the whole supply chain the main performance issues related to diversified attributes and topics such as : Creation and distribution of added value, Governance, Information and communication, Biodiversity, Pollution, Resource use, Food safety, Territoriality
3.2. Attributes and Indicators selection and contextualizing
Attributes and indicators are considered as the most relevant and available to be declined into indicators. These attributes have been defined by first using the common GRID of indicators of GLAMUR and the guidelines of SAFA. After a first comprehensive analysis we completed them through a literature review and some inputs from others
3 An analysis of the issues is presented in the Research Plan drafted with the Swiss team (Fibl). A review of scientific literature and interviews with expert allowed us to highlight eleven research themes. Source: "WP3 case study: Global and local wine supply chain in Switzerland and France, Research Plan, FIBL and INRA, May 2014".
references4 to bring all consistent and significant regarding the GLAMUR objectives and our specific research questions.
The exchanges between the French team and the Swiss team allowed achieving a final list of 8 attributes and 20 indicators. Different sources have been used to define the indicators and develop a measurement strategy adapted to available data and to the specificities of wine chains actors.
Three indicators were created specifically for the case study. Table 4 describe sources and gives a definition of these indicators
Table 4 : Description of new indicators specifically created for the case study
Indicator
Source
Definition
Market management
Global value chain analysis (Gereffi et al.,
2005)
Assessed through the level of difficulty to enter the chain, according to actors and formally (guidelines...). Proxy to assess the exclusion/inclusion capacity of the chain.
Social cohesion and Conviviality
Rural sociology World Food programme (Fonte,
1991)
Socio-cultural relations and externalities linked with food chains, contributing to create social cohesion Assessed through the number and type of socio-cultural events
favoured by the chain
Association of product with territory (Degenne, Forsé, 1999) And FAO (Vandecandelaere et al., 2009)
It refers to the capability of a supply chain to strengthen links between product, local actors and the territory. Two aspects of this indicator: (i) Measures the ability of the chain to connect producers, consumers and local actors and, (ii) identify specific characteristics of the product which make it linked to the territory (natural resources, tradition, competencies and know-how).
Table 5 presents indicators selected to assess the performance of local and global wine chains in Languedoc-Roussillon.
4 El-Hage Scialabba, N. 2013. SAFA indicators. Food and Agriculture Organization of the United Nations, Rome 2013, 281 p. Gabrielsen, P. and Bosch, P. 2003. Environmental indicators: Typology and Use in Reporting. EEA internal working paper, European Environment Agency, Copenhagen, 2003, 20 p. Vilain, L., et al. 2008. La méthode IDEA, Indicateurs de durabilité des exploitations agricoles, Guide d’utilisation. Educadri éditions, Dijon, 2008. 184 p. Hohnen, P. et Blackburn, W. GRI et ISO 26000 : Pour une utilisation conjointe des lignes directrices du GRI et de l’ISO 26000, entre dans la catégorie « Outils ». Global Reporting Initiative, 2010, 20p.
Table 5 : Final grid of indicators
Dominant
dimension
Attribute
Indicator
Explanation
Data source
Time period of
data set
Stage relevance
Ec ono mi c C R EAT IO N AND D IS TR IB U TI O N O F A D DE D V A LUE
Gross Income Total revenue earned by the farmers
Farmers semi-structured interview and secondary
data 2013-2014
producers Reduction of
direct subsidies
Amount of direct subsidies collected for production( including equipment) along the chain
on the turnover producers and cooperative
Distribution of added value along the chain
Share of commercial margin obtained by the
actors at each stage of the food chain. Producers and consumers
Contribution to
employment Number of jobs in equivalent full time at each production stage. producers
Ec on om ic , Soc ia l GO V ER NAN C E Decision making mechanisms
Mechanism of decision within the supply chain: (1) price decision making, (2) contract
negotiation
Farmers semi-structured interview and expert
interviews Last 5 years
Producers , cooperatives, traders (global chain) or consumers (for local chain) Fraud
management
within the chain Level of control in the whole chain
Farmers semi-structured interview, expert interview and secondary
data
Last 2 years Producers and third party actors
Market management
The level of difficulty to enter the chain, according to actors. Commercial management:
How the market is managed by actors of the
supply chain in order to be resilient Farmers semi-structured interview and expert interviews
Last 3 years Producers and cooperatives
Farmers’
cooperation Measure the level of connection between farmers Last 5 years Producers, cooperative
Soc ia l IN FORM A TI O N AND COM M U N ICA TI
ON Availability of information Presence and availability of information without taking into account the label of the product. Farmers semi-structured interview and direct
observation 2013-2014
Producers, cooperative, retailers and consumers
En vi r onme ntal BIO DIVE RSIT Y Species conservation practices
Participation in a voluntary scheme for protection of specific threatened species
Farmers semi-structured interview and secondary
Cultivars diversity
Diversity of vine varieties and others crops systems in the farm. Identification of "good agricultural practices" for the maintenance and
protection of biodiversity producers En vi ro nme nt al POL LU TI O N GHG emission from transportation
Identification of critical point for GHG emissions
within the chain. Secondary data for chain GHG analysis 2013-2014 Producers to retailers
GHG emissions
from production Presence and efficiency of mitigation practices for GHG reduction in the farm.
Farmers semi-structured interviews and Secondary data for chain
GHG analysis 2013-2014 Inputs, producers Environmental pollution mitigation practices
Sums the practices implemented to reduce pollution on air, water and soil
Farmers semi-structured interview and secondary
data 2013-2014 Inputs, producers
En vi ro nme nt al RE SOU R CE U SE Water Use Practices
Sources of water used for production and transformation of grape. Implementation of
water treatment practices. Farmers semi-structured interview and expert
interviews
Last 3 years producers
Material Use practices
Identify different sources and types of waste along the chain linked with actor’s practices. Checks the presence of each type of waste or
wasting practice.
2013--2014 Producers and cooperative, traders bottlers
He alt h FOOD SAFETY Food safety standards and controls
Type of food safety standards applied to ensure food safety
Farmers semi-structured interview and secondary
data 2013-2014 Producers and cooperative Artificial
additive Quantity of sulphite added to the wine Farmers semi-structured interview 2013-2014 Producers and cooperative
Soc ia l a nd ec on om ic TE RRI TO RI A LI
TY Association of product with territory
Active association linking the product to the territory, such as an appellation of origin. Frequency and type of meeting with local actors
and consumers.
Farmers semi-structured interview, secondary
data and expert interviews
Last 3 years Producers and cooperative
Social cohesion and Conviviality
Socio-cultural relations and externalities linked with food chains, contributing to create social
cohesion
Farmers semi-structured interview and expert
3.3. Contextualizing and benchmarking of the indicators
First, we identified with the Swiss team, a set of indicators to answer the research questions and illustrate the performance levels for each dimensions defined by the GLAMUR framework.
In a second step we searched in the scientific and technical literature, criteria related to performance indicators for our study area. These criteria are either practices or outcomes, or impacts. Indicators provided by FAO in the SAFA guide are difficult to evaluate because non- adapted to the wine sector and the French context. We redefined a way to evaluate indicators using existing references and field observations. The key question for assessing indicators was: What kind of data must we collect to measure each indicator?
In a third step we defined the benchmarks for each indicator. We conducted research on "best practices" and benchmark data to compare results and get a performance score in percentage.
3.3.1. Performance evaluation approach
For understanding the “final performance matrix” (ANNEX 1), we would provide details on the construction of the indicators and the selection of benchmarks.
For qualitative indicators
As we specified previously, qualitative indicators are evaluated according to several criteria. Criteria are mainly practices that impact the performance we are evaluating. Criteria we asses are not actor’s perceptions, they represent how actors manage theirs activities and how practices impact on supply chain performances. The benchmarks’ construction is based on a rating system of the performance criteria. Criteria are selected if they influence directly, positively or negatively indicators trend. Low effect practices and not significant effects not appear in the indicator performance ranking.
For quantitative indicators
The primary data collected is compared to the reference value recognized as relevant to the context and the type of product.
Two different quantitative benchmarks are mobilized in this study:
-an absolute value reference: a fixed value determined by a standard or scientific recommendations (e.g. amount of sulphites in 1 litter of wine)
- A relative value reference: a regional average, a trend
Remarks on benchmarks method: benchmarks construction should avoid certain situations to remain representative of the observed situations: It is important to base the performance evaluation on a representative number of criteria. In this study, we consider between 2 and 10 performance criteria per indicator.
The approach we developed was presented and discussed with a panel of stakeholders/experts involved in local and global wine chains in Languedoc-Roussillon during a workshop session.
3.3.2. Expert Workshop : Methodology feedback
As suggested by the guidelines for the Participatory Checklist Method (PCM), other methodological tools have been used to build a strong methodology of performance assessment:
As far as feedback mechanisms are concerned, both teams suggest organizing a workshop or “focus group” including representative actors from the chain. This workshop was prepared jointly by the two teams. Participants were informed in advance of the objectives and topics to be discussed during the focus group, by sending a working document (focus group guide). The aim was to encourage participants to think about the research questions, the attributes/topics and the related indicators. It is a condition to ensure the quality of the group discussions and the data collection.
We asked them to :
1. Assess the relevance of attributes and indicators selected for wine case study
2. Identify among the final indicator list, those relevant to distinguish local from global chains performances. 3. Assess relevance of benchmark sources we selected and the method to rank performances.
The table below shows the list of experts we consulted in order to validate indicators and benchmarks process.
Table 6: List of expert for the benchmarks of indicators and critical review of preliminary results
NAME OF THE EXPERT ORGANIZATION AREA OF EXPERTISE
Touzard Jean-Marc INRA UMR INNOVATION Director of research in wine economics
Hannin Hervé Institut des hautes études de la vigne et du vin (IHEV)
supply chain management and marketing strategy in wine industry
Boudou François Wine Cooperative of Montpeyroux Director of Institut Coopératif du Vin (ICV)
Ribes Isabelle Coop de France Languedoc-Roussillon
Supply chains and wine Cooperatives in Languedoc-Roussillon
Zébic Olivier Consulting agency, Zebic Expert on innovation in the wine sector
3.3.3. Final methodological matrix
The final performance matrix (Annex 1), shows the indicators and benchmarks construction process. We thus calculate indicators performances, presenting in the part 5. Results.
4. Methods of data collection and analysis
We present in this section 4 the strategy of data collection allowing us to measure and evaluate indicators, by using different methodologies and data sources. The main approaches are in-depth interviews with key informants, focus groups, participatory Checklist and documentation review.
Vine and Wine constitute one of the “model plant and product” for the national agricultural research (INRA): many data have thus been produced and many research projects have been implemented. A difficult and time-consuming job was nevertheless to gather all the available information, to look at the conditions in which data have been produced, and to select the relevant sources. In parallel, technical institutes and professional organisations also provide extensive information on wine exchanges and practices in this industry. The GLAMUR project is thus an opportunity to build a specific data base on wine supply chains: we coded all the available sources according to their relevance and to our list of indicators.
4.1. Plan for data collection
4.1.1. Primary data collection: Interviews and survey
In the case of France, the data collection has been completed through direct semi-structured interviews.
In both countries, some quantitative data have been collected giving key information on environmental indicators of grape and wine production steps, as well as transport stage in the chain (to be completed). The questions relating to these indicators will be formulated using LCA methods (especially input-output), in order to be able to estimate specific environmental impacts.
Table 7: Sources and method for data collection
Chain
Actors
Data collection method
LOCAL Producers / Family domain 8 quick Interviews in wine fair and 3 in-depth interviews (on farm) in Hérault dept.
Cellarman 3 quick Interviews and 1in-depth in Montpellier GLOBAL Cooperative directors 2 in-depth interviews of cooperative presidents in
Hérault
Grape growers 1 in-depth interview
bulkwine trader refused to cooperate, use secondary data and expert analysis
Languedoc Cooperative corporation 2 interviews (president and vice-president) Producers / Large scale domain 2 in-depth interviews
The collection of secondary data was an important iterative process in order to define and describe the wine chains, and to choose benchmarks or references. The benchmarks were selected according to criteria of data quality and correspondence with the indicators we assess. Nevertheless, it remains difficult to mobilize all secondary data due to i)a lack of control and reliability on all sources, and ii) the difficulty to clearly distinguish local aspects from global aspects. In many cases the categorization of information reflects other dimensions than local and global, such as the wine quality model (f.i. PGI vs PDO), crop systems (organic vs conventional), the location or size of firms
List of main documents used to complete data collection
Expert interviews
We supported the collection of primary and secondary material by interviewing experts on Languedoc-Roussillon wine industry. They helped usto specify the factors on which our team had not enough information, and to develop a critical analysis on the factors that can differentiate local and global chains.
Main References for secondary data
Bockstaller C. Guichard L., Makowski D., Aveline A., Girardin P. & Plantureux S., 2008. Agri-environmental indicators to assess cropping and farming systems. Agron. Sustain. Dev. 28, pp 139–149.
Renaud C., Benoit M., Thiollet-Sholtus M., Jourjon F. 2011. Evaluation globale des impacts environnementaux des itinéraires techniques viticoles par l’Analyse du cycle de vie (ACV). Revue suisse Viticulture, Arboriculture, Horticulture, Vol. 43 (3), pp.184–189
Zébic O. 2011. Etude pour l’adaptation du vignoble héraultais à la commercialisation du vin en vrac. Rapport final au Conseil Général de l’Hérault. IHEV, Montpellier SupAgro & O. Zebic, , Octobre 2011.
Bernaleau-Cardinel N., Lamoureux F., Delpech E., Cthelineau S., Laveau E., Michaud M-C., Montagnon R., Samie B. 2012. Référentiel Technico-Economique du Vigneron Bordelais. Edition 2012 . Chambre d'Agriculture de la Girande. 14 p.
organisation Expert names Method of data
collection Chain concerned Indicators concerned
FranceAgriMer Laurent Mayoux semi-structured
Interview Local and Global
Descriptive indicators Rate of Subsidies Coop de France
Languedoc Boris Calmette
semi-structured
Interview Global bulk chain
Global Food Chain approach, economic
expertise Coop de France
Languedoc
Bernard Augé semi-structured
Interview Global bulk chain
Global Food Chain approach, economic
4.2. Data analysis and ranking
Based on the final matrix (ANNEX 1), the scores are calculated for each indicator, and converted into a performance percentage between 0% and 100%. Performances highly dependent on selected benchmarks.
Example 1 : Qualitative indicator
Attribute: Biodiversity
Indicator: “Species Conservation Practices”
Unit: Qualitative, Ordinal
Evaluation method: We use sources and references proposed by FAO, French Ministry of Agriculture, research centres (INRA, CIRAD). We conducted an inventory of practices which impact on biodiversity at the level of the vineyard. It appeared that the relevant scale of observation was the farm. Including cropping systems of vines and other plant and animal species. Among all the possible criteria, we selected those for which data was available. For the indicator "Species conservation practices", 10 "good practices" were selected result of the construction process.
Benchmarks method: Each criterion is associated with a value, a score. We applied different scoring depending on the criteria describing the indicator: 1) Boolean notation (0 or 1 point) for presence of absence of the practice or other criteria. 2) Rating on a scale ranging from 0 to n, n is the degree of impact on the indicator.
Example 2 : Quantitative indicator
Attribute: Creation and distribution of Added Value Indicator "Reduction of direct subsidies"
Unit: Qualitative, Ordinal
Indicator measure: Regarding which data was available for each type of chain, we decide to measure the annual amount of direct subsidies for wine production actors (producers and cooperatives) divide by the turnover. This indicator show the subsidies’ contribution to the economic result.
Benchmark: We use the Average subsidy in Languedoc wine sector in 2013 to compare with values of local
and global chains. The regional rate of direct subsidies is about 20% of the farms turnover (FranceAgrimer, 2013).
Performance ranking : For this indicator, the target performance is a compromise between reduction of direct subsidies and ability to finance investments. 100% of performance is considering when actors not require subsidies. For performance calculation, we compare the average value of direct subsidies for actors of the chain to the regional average (20%). The Chain performance Rate correspond to : 100% - (Rate of subsidies / benchmarks). 100% of performance = 0% of direct subsidies
We followed the SAFA approach and translated all quantitative and qualitative scores in percentage scores of performance.
Source : WP3 Case study Guideline-GLAMUR project, 2014
4.3. Data quality check for primary and secondary data
The criteria for data quality control are representativeness, reliability and pertinence. In order to check the quality of data stability, equivalence and homogeneity, we use the pedigree matrix approach (Ciroth, 2012; Lewandowska, 2004).The data quality score (DQD) is calculated for each data, allowing to estimate a global data quality. We had also to consider an “adequate period” for the data collection. In order to ensure temporal correlation between our result and the situation observed, we verified and adjusted some of the oldest information, helped by the experts, and a specific workshop we organized with them at INRA Montpellier. The data quality remains heterogeneous according to the sources, but we reached to provide a globally good representation of many indicators of the wine chains. See in Annex 2 the Data Quality check matrix.
5. Results
Figure 8 present in a graph the rate of performance of each chain for all indicators. The performance area covered by the local chain is larger than those associated with the global chains. Strong differentiation is observed between the chains for the following attributes: pollution, information and communication, distribution of value added. Results are organized following the order of the indicators list and regrouped per attribute.
Figure 8 : Summary of the chains performances assessment 0% 20% 40% 60% 80% 100%
Species Conservation practices
Cultivars diversity
Decision making mechanisms
Fraud management within the chain
Market management
Farmers cooperation Food safety standards and
controls Artificial additive Gross Income
Reduction of direct subsidies Distribution of added value across
the chain Contribution to employment
Availability of information GHG emission for transportation GHG emissions for production
Environmental pollution mitigation practices
Water Use Practices Material Use practices
Association of product with territory
Social cohesion and Conviviality
5.1. Attribute Creation and Distribution of Added Value (Economic Dimension)
Indicators and
sub-indicators
Local bottled wine
chain
Global bottled wine
chain
Global bulk wine chain
Net Income
42%
48%
73%
Reduction of direct
subsidies
88%
75%
25%
Distribution of added
value across the chain
67%
48%
16%
Contribution to
employment
73%
51%
24%
Indicators and
sub-indicators
Relevant
indicator to
differentiate
Local from
Global?
Comparison
about
performance of
Local and
Global
Comments
Net Income
Yes chains>Local Global chain• In 2012 Languedoc wine producers income was € 18,000 per year per worker. This is lower than the national average income in the wine industry, about 40 000 €. Current economic context is more favourable to the PGI bulk market. Red wine PGI price reach € 100 / hl and can be produced through a yield, between 80 and 100 hectolitres per hectare that means an income between € 19,000 and € 24,000 per worker.
• The global bottled wine market generates higher variability in farm incomes, than in the case of global bulk chain. Costs are higher and yield lower (up to 50 hectolitres per hectare in the case of PDO wine). Average income can be estimated between € 15,000 and € 22,000 € per year per worker. Nevertheless some successful wine domains exceed 30 000 €.
• Income proceeding from the local chains are close to the preceding case, i.e. between € 15 000 and € 20 000. The cost and time induced by direct marketing is often higher than the gain provided by the better prices, which are proven for on farm selling, but not for purchase to restaurants.
• Incomes are impacted by high indebtedness due to recent investment in equipment for production and marketing.
Sensitivity to
subsidies
No chain>Global Local• Average subsidy in Languedoc wine sector is about 20% of the farms turnover, that is low in the French agriculture context (FranceAgriMer, 2013)
• Different kinds of subsidies are mentioned. Pillar 1 (wine CMO), 2nd pillar and specific national or regional subsidies mainly for export marketing, equipment and recently irrigation. Wine tourism projects or Cooperative cellars benefit from specific aids;
• Some wine growers have chosen not to benefit from subsidies in order to keep autonomy (financial, energy, decision).
Distribution of
added value
across the chain
YesLocal chain>Global
chains
• In both local and global chains the final price includes material and immaterial inputs (costs) and the sum of added values captured by the direct actors of the chain (workers, state and owner of production factors). The distribution of value between costs and added value (at each step), and then between direct actors according to their location is not always easy. We evaluated the main points, following experts and case study references. • In the local chains the added value is captured i) by the
wine producer family (about 40% of final price, low investment in logistics, labour intensive), and ii) by local and national government (22% of final price).
• In the global bulk chain, the strategy "cost / volume" is developed by stakeholders. The added value is mainly captured by actors controlling logistics, marketing and retailing (about 30%) and by taxes (22%). Grape growers (10%) and cooperative (5%) have lowest parts (referring to final wine volume). Operational margins of traders are also low comparing to other companies (5%).
• In the global bottled wine chain, the variability of added value distribution is high, according to price negotiation process. Reputation results from a long process of investment, networking, communication and can provide market opportunities and improve product value.
• The location of bottling has impact on the distribution of added value.
Contribution to
employment
Yes Local>Global• The local chain is labour-intensive, including family labour and permanent or temporary employees. High Indirect impact on employment in service providers (production, winemaking, bottling) and tourism.
• Cooperatives and wine growers mainly work with local traders and mobile bottling chains.
• In the global chain wine in is sale in bulk from cooperatives: Half of the volume of bulk wine production is based on a significant level of mechanization, in production (mechanized harvesting), pruning and irrigation. One man and one tractor, are expected for 25 hectares, leading to increase the labour productivity in volume;
• Indirect jobs (related to mechanization, maintenance, service providers…) have been created, but in a more extensive way of production
Figure 9 : Chains Performances according to the attribute creation and distribution of added value
5.2. Attribute Governance (Social and Economic Dimensions)
Indicators and
sub-indicators
Local bottled wine
chain
Global bottled wine chain
Global bulk wine chain
Decision making
mechanisms
67%
83%
50%
Fraud management
within the chain
100%
100%
100%
Market management
70%
90%
70%
Farmers cooperation
64%
64%
79%
0% 20% 40% 60% 80% 100%Gross IncomeReduction of direct subsidies
Distribution of added value across the chain Contribution to employment