HAL Id: hal-00410666
https://hal.archives-ouvertes.fr/hal-00410666
Submitted on 27 Sep 2015
HAL is a multi-disciplinary open access
archive for the deposit and dissemination of
sci-entific research documents, whether they are
pub-lished or not. The documents may come from
teaching and research institutions in France or
abroad, or from public or private research centers.
L’archive ouverte pluridisciplinaire HAL, est
destinée au dépôt et à la diffusion de documents
scientifiques de niveau recherche, publiés ou non,
émanant des établissements d’enseignement et de
recherche français ou étrangers, des laboratoires
publics ou privés.
thermal infrared IASI/MetOp sounder
Cathy Clerbaux, Anne Boynard, Lieven Clarisse, Maya George, Juliette
Hadji-Lazaro, H. Herbin, Daniel Hurtmans, Matthieu Pommier, Ariane
Razavi, Solène Turquety, et al.
To cite this version:
Cathy Clerbaux, Anne Boynard, Lieven Clarisse, Maya George, Juliette Hadji-Lazaro, et al..
Mon-itoring of atmospheric composition using the thermal infrared IASI/MetOp sounder. Atmospheric
Chemistry and Physics, European Geosciences Union, 2009, 9 (16), pp.6041-6054.
�10.5194/acp-9-6041-2009�. �hal-00410666�
© Author(s) 2009. This work is distributed under the Creative Commons Attribution 3.0 License.
Chemistry
and Physics
Monitoring of atmospheric composition using the thermal infrared
IASI/MetOp sounder
C. Clerbaux1,2, A. Boynard1,3, L. Clarisse2, M. George1, J. Hadji-Lazaro1, H. Herbin2,*, D. Hurtmans2, M. Pommier1, A. Razavi2, S. Turquety1,**, C. Wespes2, and P.-F. Coheur2
1UPMC Univ. Paris 06 ; Universit´e Versailles St.-Quentin ; CNRS/INSU, LATMOS-IPSL, Paris, France 2Spectroscopie de l’Atmosph`ere, Chimie Quantique et Photophysique, Universit´e Libre de Bruxelles (U.L.B.),
Brussels, Belgium
3Universit´e Paris 12 et 7; CNRS/INSU, LISA-IPSL, Cr´eteil, France
*now at: Laboratoire d’Optique Atmosph´erique, Universit´e des Sciences et Technologies de Lille,
Villeneuve d’Ascq cedex, France
**now at: UPMC Univ. Paris 06; CNRS/INSU, LMD-IPSL, Paris, France
Received: 20 February 2009 – Published in Atmos. Chem. Phys. Discuss.: 30 March 2009 Revised: 21 July 2009 – Accepted: 28 July 2009 – Published: 20 August 2009
Abstract. Atmospheric remote sounding from satellites is an essential component of the observational strategy deployed to monitor atmospheric pollution and changing composition. The IASI nadir looking thermal infrared sounder onboard MetOp will provide 15 years of global scale observations for a series of key atmospheric species, with unprecedented spa-tial sampling and coverage. This paper gives an overview of the instrument’s capability for measuring atmospheric com-position in the perspective of chemistry and air quality. The assessment is made in terms of species, accuracy and verti-cal information. Global distributions are presented for CO, CH4, O3(total and tropospheric), HNO3, NH3, and volcanic
SO2. Local distributions of organic species measured during
fire events, such as C2H4, CH3OH, HCOOH, and PAN are
also shown. For each species or process, the link is made to specialized papers in this issue.
1 Introduction
Measurement of atmospheric composition from space is challenging but remote sensing sounders offer a unique per-spective on the state of our environment, from short to long
Correspondence to: C. Clerbaux
(cathy.clerbaux@latmos.ipsl.fr)
term, and on a local to global scale. Several remote sensors that use the Earth’s or the atmosphere’s thermal emission, re-flected solar radiation, or solar radiation itself, have demon-strated their ability to provide relevant information for the study of changing local air quality (e.g. Richter et al., 2005; Martin, 2008), long-range transport of pollutants (e.g. Ed-wards et al., 2006), emission sources (e.g. Frankenberg et al., 2008) and climate change issues (e.g. Worden et al., 2008). The preparation for such satellite missions starts long before the launch, whilst the scientific return and societal benefit can only be evaluated when products delivered by the instru-ments become available. The whole process extends over years and includes a comprehensive preparation phase for de-signing the concept of a mission which addresses specific sci-entific needs, an industrial phase for building the instrument according to observational requirements, and a consolidation phase for accommodating the instrument on a platform.
Among the existing thermal infrared (TIR) spaceborne in-struments devoted to tropospheric remote sensing, the In-frared Atmospheric Sounding Interferometer (IASI) has a special status as it combines the heritage of instruments ded-icated to weather forecasting (e.g. the High-resolution frared Radiation Sounder, HIRS, and the Atmospheric In-fraRed Sounder, AIRS) with that of tropospheric sounders dedicated to atmospheric chemistry and climate (e.g. the In-terferometric Monitor for Greenhouse gases, IMG, the Tro-pospheric Emission Spectrometer, TES, the Atmospheric
Chemistry Experiment, ACE-FTS, and the recently launched GOSAT mission). In the case of IASI, the instrument de-sign resulted from compromises between the meteorology requirements (high spatial coverage) and the atmospheric chemistry needs (accuracy and vertical information for trace gases). This led to the development of an advanced in-strument based on a Fourier Transform Spectrometer (FTS) that was designed by the Centre National d’Etudes Spatiales (CNES) (Cayla, 1993; Blumstein et al., 2004) and combines good horizontal coverage with a moderate spectral resolu-tion. IASI is now operating from the MetOp-A meteorologi-cal payload launched by Eumetsat in October 2006 in a polar orbit. The prime objective of the MetOp mission is to de-liver continuous, long-term data sets to support operational meteorology, environmental forecasting and global climate monitoring.
MetOp is the space segment of the Eumetsat Polar Sys-tem (EPS), which initiates the European contribution to a joint Europe-US suite of satellites. The MetOp payload pro-vide the mid-morning service (at a mean local solar time of 09:30), while the US satellite will provide the afternoon service. The MetOp program consists of a series of three satellites, to be launched sequentially every 5 years in or-der to provide observations for more than 15 years. MetOp-A consists of a set of state-of-the-art sounding and imaging meteorological instruments (Advanced TIROS Operational Vertical Sounder, ATOVS, Advanced SCATterometer, AS-CAT, Advanced Very High Resolution Radiometer, AVHRR, Microwave Humidity Sounder, MHS, Advanced Microwave Sounding Unit-A, AMSU-A) along with two advanced at-mospheric chemistry passive remote sensors: IASI and the Global Ozone Monitoring Experiment-2 (GOME-2) (Callies et al., 2000), that allow atmospheric composition measure-ments in a near-real time operational mode. The MetOp mis-sions can also be considered as a first step for the Earth ob-servation space segment of the Global Monitoring for Envi-ronment and Security (GMES) initiative, a concerted effort from the European Union and the European Space Agency to bring data and information providers together with users, based on satellite observations and ground based measure-ments.
Early evaluation of the IASI products is necessary as the post-EPS program (polar orbiting satellites to be launched as follow-up of the MetOp program after 2019) is already in an advanced phase. In particular, the added value of near real time and global coverage products relevant for atmospheric chemistry need to be evaluated, as the instrumental specifi-cations of the sensors onboard post-EPS are currently being decided. This paper reviews the capability of IASI to mea-sure atmospheric composition, relying on research activities from different groups undertaken since the launch. It is orga-nized as follows: we first describe the IASI mission, and then we report on the retrieval of global scale total columns and profiles for a series of infrared absorbing species, along with their characterization in terms of vertical information and
ac-curacy. The focus here is on species that are relevant to the chemistry, leaving aside the ones of significance for climate studies. In conclusion we highlight the advantages of the IASI mission in the European GMES initiative framework.
2 The IASI/MetOp mission
The main characteristics of the IASI instrument and of the MetOp platform are summarized in Table 1.
2.1 Instrumental design and orbit
IASI consists of an FTS associated with an imaging in-strument. It is designed to measure the spectrum emitted by the Earth-atmosphere system in the TIR spectral range, using nadir geometry. Measurements are performed from the MetOp polar orbit, at an altitude of around 817 km. The satellite is sun-synchronous with a 98.7◦ inclination to the equator, and the satellite’s ground track is at about 09:30 local time in the morning (and 21:30 in the evening). The time to complete an orbit is about 101 min, which im-plies that MetOp makes a little more than 14 orbits a day. 2.2 Horizontal coverage
To achieve global coverage, the IASI instrument observes the Earth up to an angle of 48.3◦ on both sides of the satel-lite track. This corresponds to 2x15 mirror positions and a swath of about 2×1100 km. Each instantaneous field-of-view (3.3◦×3.3◦or 50 km×50 km at nadir) is composed of 2×2 circular pixels, each corresponding to a 12 km diameter footprint on the ground at nadir (see Fig. 1).
2.3 Spectral range
The instrument uses several detectors to fully cover the spec-tral range that extends from 645 to 2760 cm−1 (15.5 to 3.62 µm). The spectral range was chosen to include the strong absorption features from the CO2 absorption band
around 15 µm (used for temperature profile retrievals), the ozone 9.6 µm band, the strong water vapour ν2 absorption
band, and up to the edge of TIR in the CH4ν3absorption
band. It is worth noting that the signal recorded by the in-strument contains a contribution from solar backscatter for wavenumbers >2000 cm−1. Many other molecular absorp-tions occur within the IASI spectral range, from which the concentration of trace gases are retrieved (see Sect. 3.1). In addition, surface and cloud properties are derived from trans-parent windows.
2.4 Radiometric noise and spectral resolution
The IASI Level 1 processing generates calibrated and apodized atmospheric spectra (Level 1C data) from raw in-terferograms. The raw spectra are of high radiometric qual-ity, with a noise equivalent temperature difference lower than
Table 1. Characteristics of the MetOp satellite and of the IASI
in-strument.
Metop A Launched on October 19, 2006 Altitude ∼817 km
Orbit Polar sun-synchronous Inclination 98.7◦to the equator Local time ∼09:30, descending orbit Time for one orbit 101 min
Repeat cycle 29 days (412 orbits)
IASI Fourier transform spectrometer Size and weight 1.7 m3, 236 kg
Spectral range 645 to 2760 cm−1
Spectral resolution 0.3–0.5 cm−1(0.5 cm−1apodized) Radiometric noise <0.1–0.2 K (650–1750 cm−1)
(Ne1T at 280 K) 0.2–0.4 K (1750–2500 cm−1)
Scan type Step and dwell Field of view 50 km (3.33◦) at nadir,
with 4 simultaneous pixels of 12 km Full swath width ∼2200 km (±48.3◦), 120 pixels Global Earth coverage 2 times per day
Data rate 1.5 Mbps (after onboard processing), 120 radiance spectra every 8 s
∼1 300 000 observations per day Lifetime 5 years
0.2 K for wavenumbers lower than 2200 cm−1, except for the narrow portion between 1800 and 2000 cm−1 where it ap-proaches 0.3 K (see Fig. 2). As a guideline to these high per-formances, the noise is well below 0.1 K between 1150 and 1500 cm−1. It starts to increase above 2500 cm−1, where the TIR emission drops. The current radiometric performances are better by a factor of about 2 compared to the pre-flight specifications in several spectral ranges.
The spectral resolution is driven by the FTS optical path difference, which is 2 cm. This leads to a spectral resolu-tion (full width at half maximum) varying between 0.35 and 0.5 cm−1 depending on the wavelength. For convenience, the standard radiance (Level 1C) products are apodized by a Gaussian function of 0.5 cm−1full width at half maximum, which can be considered as the apodized spectral resolution. Each spectrum is sampled every 0.25 cm−1, providing a total of 8461 radiance channels.
2.5 Data distribution
The IASI mission delivers about 1 300 000 spectra per day. The acquisition of one complete across track scan of IASI, including onboard calibration, takes 8 s. This corresponds to 120 (30×4) interferograms. On-board processing allows the reduction of the data rate from 45 Megabits per second (interferograms) to 1.5 Megabits per second (spectra). These spectra are down-linked from the satellite to the ground in near real time (about 3 h after acquisition). The IASI
prod-Fig. 1. IASI observing mode: the instrument measures the
spec-trum of infrared radiation emitted by the Earth and the atmosphere, from a low altitude sun-synchronous orbit, over a swath width of
∼2200 km, every 50 km at nadir (with 4 footprints of 12 km in di-ameter).
Fig. 2. IASI radiometric noise as established from a set of
repre-sentative spectra, spanning a range of latitude. Values are provided in radiance units (W/(m2sr m−1), black line, left scale), and were converted to noise equivalent temperature difference (Ne1T , blue line, right scale) for a given reference temperature of 280 K.
ucts are operationally distributed via Eumetsat’s Data Dis-tribution System (EumetCast). EumetCast uses the services of a satellite operator and a telecommunication provider to distribute the data files to a wide audience located within a geographical coverage zone which includes most of Europe and certain locations in Africa. EumetCast has distributed Level 1C radiance data since June 2007, geophysical Level 2 products such as temperature, water vapour profiles, surface and cloud properties since September 2007 (Schl¨ussel et al., 2005), as well as total and partial columns for trace gases since March 2008 (August et al., 2009).
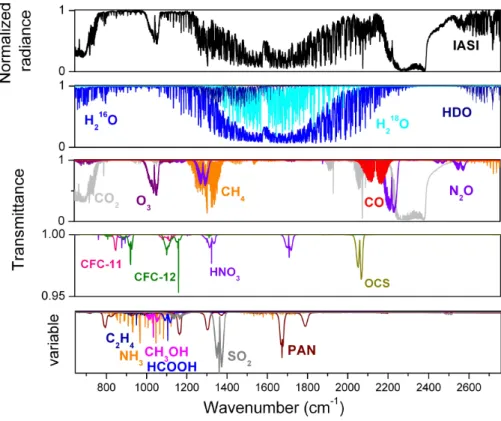
Fig. 3. Top panel: radiance atmospheric spectrum (in normalized units) recorded by IASI/MetOp, over West of Australia, on 20 December,
2006. Middle panels: radiative transfer transmittance simulations to identify the main absorbing gases (middle panels) and the weaker absorbers (lower panel, with a variable scale). All the species indicated on the plot have been detected by IASI, although not all in this particular observation, as some are only detectable when special events occur, such as fires or volcanic eruptions.
3 Trace gas measurements
3.1 Atmospheric spectra and geophysical products Atmospheric sounding using the TIR spectral range relies on the analysis of atmospheric radiance spectra. The radiance signal recorded by the instrument in orbit is a composite of the initial longwave infrared emission (the Earth black body emission at the location of the measurement), modified for cloud free scenes by gaseous absorption and emission pro-cesses along the path. Each molecule has a specific signature resulting from rotation-vibration transitions. Concentrations can be retrieved for each molecule absorbing in the atmo-spheric path using iterative inversion methods. Figure 3 pro-vides an example of a IASI spectrum in normalized radiance (radiance divided by the local Earth’s blackbody function), along with the individual molecular absorption contributions that have been identified up to now. A complete list of these geophysical Level 2 products, which have been analyzed by several groups, is provided in Table 2, with adequate refer-encing to published papers. From these absorbing species four classes of compounds can be distinguished:
1. Absorbers with long lifetimes (>50 years) and sta-ble atmospheric concentrations, which require accu-rate retrievals in order to provide useful information on their global or temporal variability (accuracy lower than a few percents is required). These are princi-pally the strongly absorbing climate gases, namely, car-bon dioxide (CO2) and nitrous oxide (N2O). The
re-trieval of their concentration from IASI observations requires very specific methods, which are not reported in this paper. Additional information can be found in Crevoisier et al. (2009a) and Ricaud et al. (2009) for CO2and N2O, respectively. A similar situation is
ob-served for the weakly absorbing chlorofluorocarbons CFC-11 and CFC-12, which still exhibit significant ab-sorption signatures in IASI spectra despite being reg-ulated by the Montreal protocol. HCFC-22, the most abundant substitute of chlorofluorocarbons, is also de-tectable. Additionally the long-lived carbonyl sulphide molecule (OCS) is identified in the spectra (Shephard et al., 2009).
2. Strong to medium absorbers which exhibit a significant atmospheric variability (>5%) because of their reactiv-ity (lifetimes from a few weeks to a few years), which can be observed in each individual IASI observation.
Table 2. List of products available from the IASI mission. For each molecule, when available, the estimated vertical resolution (DOFS,
independent information on the vertical), and accuracy are provided. Long and medium lived species are observed in each spectrum, while the short lived species are only detected over specific events or close to emission sources.
Species Vertical Res. (DOFS) Error (%) Comment References Long-lived species (lifetime >10 years)
CO2 <1 NA Strong absorber Crevoisier et al., 2009a
N2O <1 NA Strong absorber Ricaud et al., 2009
CFC-11 <1 NA Weak absorber
CFC-12 <1 NA Weak absorber
HCFC-22 NA NA Weak absorber
OCS <1 NA Weak absorber Shephard et al., 2009
Medium-lived species (lifetime a few weeks to a few years)
H2O 5–6 15% (0–20 km) Dominant absorber Herbin et al., 2009
HDO 3–4 30% (0–20 km) Strong absorber+absorption Herbin et al., 2009 in the backscattered
solar radiation
H182 O 3–4 NA Strong absorber Herbin et al., 2009
CH4 ∼1 <2% Strong absorber+absorption Razavi et al., 2009
Tot. col. in the backscattered Crevoisier et al., 2009b solar radiation
O3 3–4 30% (0–6 km) Strong absorber with large Eremenko et al., 2008 3% Tot. col. stratospheric contribution Boynard et al., 2009
Keim et al., 2009 Massart et al., 2009 Amato et al., 2009
CO 1–2 10% George et al., 2009
Turquety et al., 2009 HNO3 ∼1 15% Weak absorber with large Wespes et al., 2009
Tot. col. stratospheric contribution Short-lived species (lifetime a few hours to a few days)
NH3 NA Detected in fires and Coheur et al., 2009
over agricultural regions Clarisse et al., 2009
CH3OH NA Detected in fires Coheur et al., 2009
HCOOH NA Detected in fires Coheur et al., 2009
C2H4 NA Detected in fires Coheur et al.,2009
SO2-volcans NA Detected in volcanic Clarisse et al., 2008
plumes for concentrations above 2 DU
Aerosols
Dust (sand), volcanic ∼1 NA L. Clarisse et al., personal
ash, ice clouds communication, 2009
These species, which contribute to tropospheric and/or stratospheric chemistry, are water vapour (H2O and
iso-topologues HDO and H182 O), methane (CH4), ozone
(O3), carbon monoxide (CO), and nitric acid (HNO3).
More details on their measurements and on the geophys-ical analyses of the retrieved concentration fields are provided in the next section, and in several specialized
papers of this issue (Herbin et al., 2009; Razavi et al., 2009; Boynard et al., 2009; Keim et al., 2009; George et al., 2009; Fortems-Cheiney et al., 2009; Turquety et al., 2009; Wespes et al., 2009).
3. Weak absorbers that can only be detected above emis-sion sources or in concentrated plumes owing to the good radiometric performance of IASI. These in-clude sulphur dioxide (SO2)from volcanoes (Clarisse
et al., 2008), ammonia (NH3) from biomass
burn-ing and intensive land use (Clarisse et al., 2009) and volatile organic compounds such as formic acid (HCOOH), methanol (CH3OH), ethene (C2H4)and
per-oxyacetyl nitrate (CH3COONO2, abbreviated as PAN)
from biomass burning (Coheur et al., 2009). Note that all these compounds are in the 800–1200 cm−1 at-mospheric window, where contamination from water vapour is reduced.
4. Higher altitude aerosols, such as those resulting from sandstorms, volcanic eruptions or cirrus forma-tion. They mainly manifest themselves in the 700– 1300 cm−1window as broad absorption features.
3.2 IASI processing of trace species at LATMOS and ULB
In this section we limit the description to work that was per-formed at LATMOS and ULB for the analysis of IASI spectra in order to derive atmospheric concentrations of trace gases. 3.2.1 Cloud filtering
For cloud free situations, nadir looking TIR instruments can measure the atmospheric radiation down to the ground and, for some species, vertical information can be derived, provided ground emissivity, surface temperature and atmo-spheric temperature are known at the location of the mea-surement. For species that are optically thin total columns are retrieved, and for species like water vapour or ozone, for which at least some lines are optically thick, profiles can be retrieved.
When a cloud is present in the optical path, the radiance signal recorded by the instrument can be significantly af-fected, depending on the type (water or ice cloud) and the optical thickness of the cloud. Only the data that are not or weakly contaminated by clouds in the field of view (FOV) were selected for further processing (about 700 000 data per day, on average).
Before the availability of Level 2 Eumetsat data, at the end of September 2007, we relied on a basic cloud filtering sys-tem (Hadji-Lazaro et al., 2001) based on the European Cen-tre for Medium-Range Weather Forecasts (ECMWF) analy-sis (interpolated in time and space to match the observation) for the surface skin temperature (Ts). The filter uses the
com-parison between the brightness temperatures at 11 and 12 µm (BT11 and BT12) with Ts. We consider spectra as “clear”
when differences between Ts, BT11 and BT12 are lower than
15 K in absolute value.
When the Level 2 temperature and cloud information be-came available, the data treatment was adapted to make full
use of these products. These include cloud fraction in the IASI pixel, cloud top temperature, cloud pressure, and cloud phase (IASI Level 2 Product Guide, 2008). These parame-ters are determined either from IASI in a stand-alone mode or in combination with the ATOVS and AVHRR instruments (Schl¨ussel et al., 2005). The cloud detection is based on the combined information of the IASI Level 1C spectra and the AMSU-A data. If clouds are detected in the IASI FOV, the CO2-slicing method is used to estimate the fractional cloud
cover and the cloud top pressure. If the FOV has been de-clared cloudy by the AVHRR-derived fractional cloud cover, the average cloud top height and cloud top temperatures are calculated for the number of identified cloud formations. The discrimination between ice clouds, mixed phases, and liquid-water clouds is made using the emission spectrum of the at-mosphere between 11 and 12 µm that shows a steeper slope for liquid water than for ice clouds. The summary cloud fraction flag (FLG CLDSUM), which combines information from the different cloud parameters, was used for the anal-ysis of trace gases reported here. All data corresponding to the cloud flag between 0 and 25% are further analyzed. 3.2.2 Concentration retrievals
Inverse methods are used to retrieve the desired concentra-tions (total column or profile product) from the spectroscopic signatures of atmospheric constituents in the radiance spec-trum. The state of the atmosphere is the unknown quantity to be determined, and is a function of local conditions such as pressure and temperature profiles, and surface emissivity. The inverse step method allows the retrieval of concentra-tions for one or several trace gases simultaneously, provided that there is some prior knowledge of the atmospheric state. The problem remains, however, mostly under-determined and the quantities can only be retrieved using both observa-tions and prior assumpobserva-tions (that determine the linearization point about which a retrieval is constrained), also taking into account the instrument radiometric noise. The priori assump-tion in the retrieval process consists ideally of a statistical mean and covariance of the measured atmospheric quantity.
The posterior products include the retrieved quantity (total column or vertical profile for a given species), its associated error covariance and averaging kernel functions that charac-terize the vertical information content. The peak of each av-eraging kernel gives the altitude of maximum sensitivity at each retrieved level, whereas its full width at half maximum can be interpreted as the vertical resolution of the retrieval. The trace of the averaging kernel matrix is called the Degree of Freedom of the Signal (DOFS), a convenient quantity to establish the number of independent pieces of information available on the vertical (Rodgers, 2000).
The ULB and LATMOS teams have been working for sev-eral years to develop processing tools to retrieve trace gas abundances from TIR sounders, in preparation for IASI. The algorithms were used for the exploitation of data obtained by
other remote sounders such as the solar occultation Atmo-spheric Chemistry Experiment (ACE-FTS) instrument (e.g. Coheur et al., 2007; Clerbaux et al., 2008a; Herbin et al., 2009), the nadir looking IMG/ADEOS sounder (e.g. Cler-baux et al., 2003; Coheur et al., 2005; Barret et al., 2005; Herbin et al., 2007), and the TES/AURA FTS (Clerbaux et al., 2008b).
Systematic retrievals of trace gas species started as soon as the IASI Level 1C data became available. Datasets of more than 18 months duration are available, from which global and local distributions of trace gases have been routinely derived using several sophisticated programs depending on the ap-plication (global maps, local profiles, or detection of special events). A short description of the processing tools is pro-vided hereafter:
1. Near real time global scale distribution maps are derived for ozone using a neural network (NN) based algorithm (see Turquety et al., 2004, for a full description). This NN also provides total columns of CO and CH4, which
have not yet been considered for further geophysical analyses. It is worth noting that the core of the NN al-gorithm was implemented at the Eumetsat ground seg-ment to generate operational Level 2 trace gases data for ozone (0–6 km; 0–12 km; 0–16 km and total col-umn content), CO and CH4total columns, but the
train-ing dataset differs from ours, and the current products distributed by EumetCast are different from those de-scribed here. In parallel, a fast retrieval approach based on the optimal estimation theory has been developed (FORLI: Fast Operational/Optimal Retrieval on Layers for IASI) to provide in near real time global distribu-tions of CO vertical profiles (George et al., 2009; Tur-quety et al., 2009) and of HNO3total columns (Wespes
et al., 2009).
2. Local profile retrievals are performed using the
Atmo-sphit software (Coheur et al., 2005), which contains a
full line-by-line radiative transfer model and which re-lies on the optimal estimation to derive profiles and as-sociated averaging kernels.
3. Detection of weak absorbers is performed routinely by using the difference in brightness temperature (BTD) between selected and reference window chan-nels (Clarisse et al., 2009). This provides a simple and robust means to probe the presence of absorption and/or emission features in the spectra and is a useful tool for the identification and tracking of sudden events such as fires and volcanic plumes (Clarisse et al., 2008; Coheur et al., 2009).
3.2.3 Examples of trace gas distributions
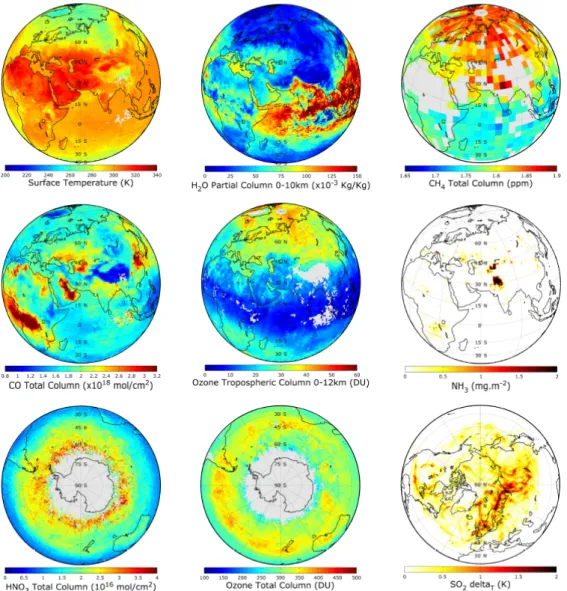
Figure 4 illustrates the results from the routinely retrieved global concentrations for some key atmospheric products of
the IASI mission. The figure is a composite of measure-ments of different species, obtained during a ten day observa-tion period extending from August 18 to August 28 (2008). The concentration maps were generated using the different ULB-LATMOS retrieval algorithms described above, along with EumetCast distributed products for temperature and wa-ter vapour content. The methane retrieval is obtained using
Atmosphit, and a description of the product may be found
in Razavi et al. (2009). CO total columns are operationally derived using FORLI-CO, and a comparison of this product with similar products obtained by other TIR remote sensors is provided in George et al. (2009). In depth analysis of CO emitted by fire events is reported in Turquety et al. (2009) and an estimation of global emission sources is provided in Fortems-Cheinet et al. (2009). Ozone total and tropospheric columns were generated from the NN algorithm, and valida-tion of these products with GOME-2 data and assimilavalida-tion of other satellite data are discussed in Boynard et al. (2009) and Massart et al. (2009), respectively. The HNO3 distribution
fields are described in Wespes et al. (2009). The ammonia distribution was obtained by mapping BTDs to total column abundances, as described elsewhere (Clarisse et al., 2009). A similar procedure was used to derive the SO2distribution
(see Clarisse et al., 2008), which corresponds to the plume of the Kasatochi eruption in early August averaged over the ten days analysis period. Volcanic eruptions are indeed iden-tified and tracked using the SO2spectral signatures. Based
on this, ULB is also running a near-real time SO2alert
sys-tem since November 2008. The alerts are sent out by email and complemented by images directly available on the web (http://cpm-ws4.ulb.ac.be/Alerts/). This website can also be consulted to retrieve information on older events.
From the IASI measurements, daily, monthly and seasonal global scale maps can be derived. As an example, the sea-sonal variation of CO is shown in Fig. 5. It provides a representation of the CO total column product as observed for different months of the year. It corresponds to daytime total column observations, averaged over a month (for fur-ther description, see George et al., 2009). In the Norfur-thern hemisphere, most of the pollution is associated with urban activity, with persistent high values above China and ele-vated levels over USA, Europe and Asia in spring. In the tropics and Southern Hemisphere, most of the CO is emitted where biomass burning occurs, such as in Africa, and Central and South America (following the seasonal shift in the Inter-Tropical Convergence Zone). Owing to the excellent global coverage of the instrument, when averaging over several days the gaps due to cloud contaminated pixels that were excluded from the processing disappear. From these plots it can be seen that the CO pollution plumes emitted locally spread from regional to global scales, depending on meteorological conditions and photochemistry. CO quick-look distributions daily maps with different projections can be viewed from the LATMOS website at http://iasi-chem.aero.jussieu.fr. This CO product is now operationally assimilated in the GEMS
Fig. 4. Distributions as retrieved from IASI, averaging over ten days of observations in August 2008 (18–28). The orientation of the globe
was chosen in order to highlight the most relevant atmospheric processes. From left to right and from top to bottom, these are in a projection highlighting Europe-Africa-Asia surface temperature and H2O partial columns (0–10 km, in kg/kg units) from the Eumetsat Level 2 products,
CH4normalized mixing ratio from Atmosphit (total methane content divided by the N2O total column), CO total columns from FORLI-CO,
O3tropospheric columns from NN and NH3from Atmosphit. The last row shows in a polar projection over the Antarctic O3and HNO3total
columns from NN and FORLI respectively, at a time when the depletion of stratospheric ozone starts. The SO2distribution on the bottom
right is shown with an Arctic projection, highlighting the plume from the major Kasatochi eruption that occurred a few days before. Data are binned on a 1◦×1◦grid, except CH4which is binned on a 5◦×5◦grid (pure nadir observations only). The units are provided on the scales
for each product.
ECMWF project (Hollingsworth et al., 2008), to produce a chemical forecast of CO fields.
Figure 6 illustrates the detection of short-lived species (C2H4, CH3OH, HCOOH and NH3)for one IASI morning
orbit on the 17 May 2008 during large-scale fires in Eastern Mongolia (Warneke et al., 2009). Concentrations were ob-tained here using the Atmosphit software. Other fire events, in particular the Greek fires that occurred in August 2007, are presented and analyzed in Turquety et al. (2009) and in Coheur et al. (2009).
3.3 Vertical information and accuracy 3.3.1 Thermal contrast
The sensitivity of TIR sounders to probe the troposphere varies widely according to the temperature of the surface and the atmosphere. Particularly important for studying local emission sources is the difference between the surface perature and the temperature of the boundary layer. This tem-perature difference (1T ) is often referred to as the thermal
Fig. 5. IASI CO total column measurements. Each map is an average over one month (April, July, October and January, daytime observations
only), chosen to highlight the seasonal patterns. It is worth noting that some issues remain in the IASI data treatment for measurements over desert (e.g. Sahara in spring and summer).
Fig. 6. Fire plume from the Eastern Siberia fires, measured in May 2007, at about 11:00 local time, shown separately from the upper left to
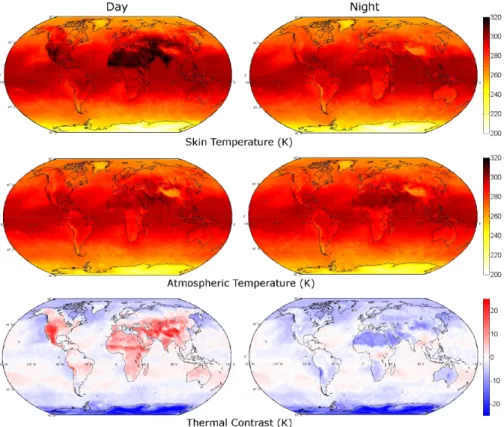
Fig. 7. Upper and middle panels represent skin temperatures and the first level of retrieved temperatures available from Eumetsat Level 2
products, for daytime (left) and nighttime (right) observations, averaged over May 2008. The bottom plots are the difference between these temperatures (thermal contrast).
contrast, a critical parameter for analyzing retrieved products from infrared missions as it determines the shape of the av-eraging kernel function and if the measurement contains in-formation from the boundary layer or not (e.g. Deeter et al., 2007).
Figure 7 shows the 1T distribution derived from IASI ob-servations in May 2007, where skin temperature is the bright-ness temperature of the surface derived from IASI surface sensitive radiance channels, and T is the temperature of the first level in the temperature profile (where the latter is de-rived from the analysis of CO2 bands). It is worth noting
that these two parameters are retrieved independently. As expected (Prigent et al., 2003; Deeter et al., 2007; Clerbaux et al., 2008c), the thermal contrast exhibits significant geo-graphical, seasonal, and diurnal variability. It is higher dur-ing the day than durdur-ing the night over land, and is usually higher over land than over sea. This day/night difference is a direct consequence of the surface heating associated with the absorption of solar radiation: in the morning at sunrise the Earth starts absorbing ultraviolet-visible radiation, for which the atmosphere is roughly transparent. The Earth then trans-mits this energy into the atmosphere via infrared radiation, which heats up later, resulting in a positive thermal contrast. When the sun sets the Earth cools itself by releasing radiation into the atmosphere. This in turn continues to heat the
atmo-sphere for some time, thus lessening the thermal contrast. These processes are amplified above land by the fact that the surface of the Earth has a limited heat capacity and thus heats up/cools down faster than the atmosphere, causing high ther-mal contrast variations above the continents. Locally, surface skin temperatures are also modulated by both vegetation and soil moisture, through processes of evapotranspiration and evaporation. Therefore dry, sparsely vegetated regions typi-cally offer stronger daytime thermal contrast conditions than heavily vegetated regions. Over sea the diurnal variations of surface temperature is limited because of the much larger heat capacity of sea water.
3.3.2 Vertical information and accuracy
The direct consequence of thermal contrast variations is that the IASI instrument provides more surface sensitive mea-surements and to some extent better vertical resolution for the morning overpass and over land. It also explains why one often observes a marked transition in the concentration distribution in the measurements at the edge of a continent (e.g. see Fig. 5). The influence of thermal contrast condi-tions appears in the averaging kernels associated with con-centration retrievals, and allows the analysis of the repre-sentativeness of the observation at different altitudes. Over
oceans and during the night, retrieved concentration prod-ucts for species that are emitted at the surface level are gen-erally dominated by concentrations in the mid-troposphere because of low thermal contrast. This is not the case for O3and HNO3total columns, as for these two the dominant
contribution comes from the stratosphere. Over land and for the morning overpass, if vegetation is sparse at this location, IASI has the capability to sound deeper up into the boundary layer (also see Turquety et al., 2009, for further discussion). Its ability to probe the planetary boundary layer, where lo-cal pollution occurs, therefore strongly depends on location, temperature, type of surface and time of the day. The ther-mal contrast between the surface and the planetary boundary layer determines to what extent the surface sources, in par-ticular of short lived species, can be detected.
Table 2 provides a summary of our current assessment for vertical information content and accuracy, for the range of molecules that are measured from the IASI spectra. Details on the reported values can be found in the references men-tioned in the Table. It is worth noting that accuracy values are indicative values, as they strongly depend on the geo-graphical location of the observation. Some of the species reported in the Table are detectable only for some specific conditions, combining high emissions and favourable ther-modynamic conditions.
4 Conclusions and discussion
Satellites can sample the whole planet and complement the in-situ ground stations network in order to provide global scale monitoring of atmospheric composition and to provide the observations that feed atmospheric chemistry models for air quality forecasts. In the framework of the European GMES initiative, new space-borne instruments are currently being designed to be part of the Earth observation space seg-ment that will deliver air quality measureseg-ments in support of policy decisions after 2018. As near real time and frequent observations are required, current plans are to combine me-teorological payloads with atmospheric chemistry sounders that use both the UV-visible and the TIR spectral range, from both polar and geostationary orbits (e.g. Stuhlmann et al., 2005).
The MetOp satellite launched in 2006 is a pioneering plat-form, which delivers near real time (∼3 h after observation) operational products both for weather forecasting and atmo-spheric chemistry monitoring (with IASI and GOME-2 on-board), and will provide measurements for 15 years (2006– 2020). IASI delivers about 1 300 000 atmospheric spectra per day from which the concentration of a series of trace gases spanning a range of lifetimes can be retrieved. In this paper we have reviewed the latest developments that have been per-formed at ULB and LATMOS in order to generate systematic global scale distributions for CO, CH4, O3(total and
tropo-spheric), HNO3, and NH3. We have also shown that due
to the excellent radiometric performance of the instrument, local distributions of organic species measured during fire events, such as C2H4, CH3OH, HCOOH, and PAN are
possi-ble. Not all these products are available in near real time yet, but extended data sets for further scientific analysis are avail-able upon request (cathy.clerbaux@latmos.ipsl.fr). All prod-ucts are currently being validated, but we lack rapid delivery of ground-based data for example. Retrieval algorithms will be continuously improved, by comparing our observations with other similar datasets when available.
IASI provides limited information on the vertical and in particular of the boundary layer, the extent of which depends upon local surface properties and thermodynamic conditions. We have discussed how thermal contrast conditions impact on the observation and determines the sensitivity of the mea-surement at different altitudes, including near the surface.
The availability of data in near real time makes them valu-able input to help in the detection and prediction of pollution episodes. The CO total column product is currently assimi-lated at ECMWF in the framework of the GEMS project to provide the CO global forecast. Work is in progress to as-similate the O3 [0–12 km] column product in the Chimere
(Rouil et al., 2009) French air quality forecast model, and to improve global emission inventories using IASI’s ammonia observations (Clarisse et al., 2009). Finally, the synergetic use of GOME-2 and IASI ozone products in order to obtain improved tropospheric ozone distribution is underway in the framework of the Eumetsat’s Satellite Application Facility on Ozone and Atmospheric Chemistry Monotoring (O3
M-SAF).
Acknowledgements. The IASI mission is a joint mission of
Eumetsat and the Centre National d’Etudes Spatiales (CNES, France). The IASI L1 data are distributed in near real time by Eumetsat through the Eumetcast system distribution. The authors acknowledge the Ether French atmospheric database (http://ether.ipsl.jussieu.fr) for providing the IASI L1C data. The French scientists are grateful to CNES for scientific collaboration and financial support. L. Clarisse and P. F. Coheur are respectively Scientific Research Worker (Collaborateur Scientifique) and Research Associate (Chercheur Qualifi´e) with F.R.S.-FNRS. The research in Belgium was funded by the F.R.S.-FNRS (M.I.S. F.4511.08), the Belgian State Federal Office for Scientific, Technical and Cultural Affairs and the European Space Agency (ESA-Prodex arrangements C90-327). Financial support by the “Actions de Recherche Concert´ees” (Communaut´e Franc¸aise de Belgique) is also acknowledged. The authors would like to thank A. Depauw and C. Scannell for their assistance. We are grateful to INSU for publication support.
The publication of this article is financed by CNRS-INSU.
References
Amato, U., Antoniadis, A., De Feis, I., Masiello, G., Matricardi, M., and Serio, C.: Technical Note: Functional sliced inverse re-gression to infer temperature, water vapour and ozone from IASI data, Atmos. Chem. Phys., 9, 5321–5330, 2009,
http://www.atmos-chem-phys.net/9/5321/2009/.
August, T., Schl¨ussel, P., Munro, R., Calbet, X., Oduleye, O., Ar-riaga, A., Hultberg1, T., Hadji-Lazaro, J., Turquety, S., and Cler-baux, C.: ANN ozone retrieval within the operational level 2 processor, Proceedings of the Eumetsat Conference, Darmstadt, 2009.
Barret, B., Turquety, S., Hurtmans, D., Clerbaux, C., Hadji-Lazaro, J., Bey, I., Auvray, M., and Coheur, P.-F.: Global carbon monox-ide vertical distributions from spaceborne high-resolution FTIR nadir measurements, Atmos. Chem. Phys., 5, 2901–2914, 2005, http://www.atmos-chem-phys.net/5/2901/2005/.
Blumstein, D., Chalon, G., Carlier, T., Buil, C., H´ebert, P., Ma-ciaszek, T., Ponce, G., Phulpin, T., Tournier, B., and Sim´eoni, D.: IASI instrument: Technical Overview and measured perfor-mances, SPIE Denver, 5543-22, 2004.
Boynard, A., Clerbaux, C., Coheur, P.-F., Hurtmans, D., Turquety, S., George, M., Hadji-Lazaro, J., Keim, C., and Meyer-Arnek, J.: Measurements of total and tropospheric ozone from IASI: com-parison with correlative satellite and ozonesonde observations, Atmos. Chem. Phys. Discuss., 9, 10513–10548, 2009,
http://www.atmos-chem-phys-discuss.net/9/10513/2009/. Callies, J., Corpaccioli, E., Eisinger, M., Hahne, A., and Lefebvre,
A.: GOME-2 – Metop’s Second Generation sensor for Opera-tional Ozone Monitoring, ESA Bulletin, 102, 2000.
Cayla, F. R: IASI infrared interferometer for operations and re-search, in: High Spectral Resolution Infrared Remote Sensing for Earth’s Weather and Climate Studies, edited by: Chedin, A., Chahine, M. T., and Scott, N. A., NATO ASI Series, vol. I, 9, Springer Verlag, Berlin, 1993.
Clarisse, L., Coheur, P. F., Prata, A. J., Hurtmans, D., Razavi, A., Phulpin, T., Hadji-Lazaro, J., and Clerbaux, C.: Tracking and quantifying volcanic SO2with IASI, the September 2007
erup-tion at Jebel at Tair, Atmos. Chem. Phys., 8, 7723–7734, 2008, http://www.atmos-chem-phys.net/8/7723/2008/.
Clarisse, L., Clerbaux, C., Dentener, F., Hurtmans, D., and Coheur, P. F.: Global ammonia distribution derived from infrared satellite observations, Nature Geosci., 2, 479–483, doi:10.1038/ngeo551, 2009.
Clerbaux, C., Hadji-Lazaro, J., Turquety, S., M´egie, G., and Coheur, P.-F.: Trace gas measurements from infrared satellite for chem-istry and climate applications, Atmos. Chem. Phys., 3, 1495– 1508, 2003,
http://www.atmos-chem-phys.net/3/1495/2003/.
Clerbaux, C., George, M., Turquety, S., Walker, K. A., Barret, B., Bernath, P., Boone, C., Borsdorff, T., Cammas, J. P., Catoire, V., Coffey, M., Coheur, P.-F., Deeter, M., De Mazire, M., Drum-mond, J., Duchatelet, P., Dupuy, E., de Zafra, R., Eddounia, F., Edwards, D. P., Emmons, L., Funke, B., Gille, J., Griffith, D. W. T., Hannigan, J., Hase, F., H¨opfner, M., Jones, N., Kagawa, A., Kasai, Y., Kramer, I., Le Flochmo¨en, E., Livesey, N. J., L´opez-Puertas, M., Luo, M., Mahieu, E., Murtagh, D., N´ed´elec, P., Pazmino, A., Pumphrey, H., Ricaud, P., Rinsland, C. P., Robert, C., Schneider, M., Senten, C., Stiller, G., Strandberg, A., Strong, K., Sussmann, R., Thouret, V., Urban, J., and Wiacek, A.: CO measurements from the ACE-FTS satellite instrument: data anal-ysis and validation using ground-based, airborne and spaceborne observations, Atmos. Chem. Phys., 8, 2569–2594, 2008a, http://www.atmos-chem-phys.net/8/2569/2008/.
Clerbaux, C., Coheur, P.-F., Clarisse, L., Hadji-Lazaro, J., Hurt-mans, D., Turquety, S., Bowman, K., Worden, H., and Carn, S. A.: Measurements of SO2profiles in volcanic plumes from the
NASA Tropospheric Emission Spectrometer (TES), Geophys. Res. Lett., 35, L22807, doi:10.1029/2008GL035566, 2008b. Clerbaux, C., Edwards, D. P., Deeter, M., Emmons, L.,
Lamar-que, J.-F., Tie, X. X., Massie, S. T., and Gille, J.: Carbon monoxide pollution from cities and urban areas observed by the Terra/MOPITT mission, Geophys. Res. Lett, 35, L03817, doi:10.1029/2007GL032300, 2008c.
Coheur, P.-F., Barret, B., Turquety, S., Hurtmans, D., Hadji-Lazaro, J., and Clerbaux, C.: Retrieval and characterization of ozone ver-tical profiles from a thermal infrared nadir sounder, J. Geophys. Res., 110, D24303, doi:10.1029/2005JD005845, 2005.
Coheur, P.-F., Herbin, H., Clerbaux, C., Hurtmans, D., Wespes, C., Carleer, M., Turquety, S., Rinsland, C. P., Remedios, J., Hauglus-taine, D., Boone, C. D., and Bernath, P. F.: ACE-FTS observation of a young biomass burning plume: first reported measurements of C2H4, C3H6O, H2CO and PAN by infrared occultation from
space, Atmos. Chem. Phys., 7, 5437–5446, 2007, http://www.atmos-chem-phys.net/7/5437/2007/.
Coheur, P.-F., Clarisse, L., Turquety, S., Hurtmans, D., and Cler-baux, C.: IASI measurements of reactive trace species in biomass burning plumes, Atmos. Chem. Phys., 9, 5655–5667, 2009, http://www.atmos-chem-phys.net/9/5655/2009/.
Crevoisier, C., Ch´edin, A., Matsueda, H., Machida, T., Armante, R., and Scott, N. A.: First year of upper tropospheric integrated content of CO2from IASI hyperspectral infrared observations,
Atmos. Chem. Phys., 9, 4797–4810, 2009a, http://www.atmos-chem-phys.net/9/4797/2009/.
Crevoisier, C., Nobileau, D., Fiore, A. M., Armante, R., Ch´edin, A., and Scott, N. A.: A new insight on tropospheric methane in the Tropics first year from IASI hyperspectral infrared observations, Atmos. Chem. Phys. Discuss., 9, 6855–6887, 2009b,
http://www.atmos-chem-phys-discuss.net/9/6855/2009/. Deeter, M. N., Edwards, D. P., Gille, J. C., and Drummond,
J. R.: Sensitivity of MOPITT observations to carbon monox-ide in the lower troposphere, J. Geophys. Res., 112, D24306, doi:10.1029/2007JD008929, 2007.
Edwards, D. P., Emmons, L. K., Gille, J. C., Chu, A., Attie, J.-L., Giglio, L., Wood, S. W., Haywood, J., Deeter, M. N., Massie, S. T., Ziskin, D. C., and Drummond, J. R.: Satellite-observed pol-lution from Southern Hemisphere biomass burning, J. Geophys. Res., 111, D14312, doi:10.1029/2005JD006655, 2006.
Eremenko, M., Dufour, G., Foret, G., Keim, C., Orphal, J., Beek-mann, M., Bergametti, G., and Flaud, J.-M.: Tropospheric ozone distributions over Europe during the heat wave in July 2007 ob-served from infrared nadir spectra recorded by IASI, Geophys. Res. Lett., 35, L18805, doi:10.1029/2008GL034803, 2008. Fortems-Cheiney, A., Chevallier, F., Pison, I., Bousquet, P.,
Carouge, C., Clerbaux, C., Coheur, P.-F., George, M., Hurtmans, D., and Szopa, S.: On the capability of IASI measurements to in-form about CO surface emissions, Atmos. Chem. Phys. Discuss., 9, 7505–7529, 2009,
http://www.atmos-chem-phys-discuss.net/9/7505/2009/. Frankenberg, C., Bergamaschi, P., Butz, A., Houweling, S.,
Meirink, J. F., Notholt, J., Petersen, A., Schrijver, H., Warneke, T., and Aben, I.: Tropical methane emissions: A revised view from SCIAMACHY onboard ENVISAT, Geophys. Res. Lett., 35, L15811, doi:10.1029/2008GL034300, 2008.
George, M., Clerbaux, C., Hurtmans, D., Turquety, S., Coheur, P.-F., Pommier, M., Hadji-Lazaro, J., Edwards, D. P., Worden, H., Luo, M., Rinsland, C., and McMillan, W.: Carbon monoxide dis-tributions from the IASI/METOP mission: evaluation with other space-borne remote sensors, Atmos. Chem. Phys. Discuss., 9, 9793–9822, 2009,
http://www.atmos-chem-phys-discuss.net/9/9793/2009/. Hadji-Lazaro, J., Clerbaux, C., Couvert, P., Chazette, P., and
Boonne, C.: Cloud filter for CO retrieval from IMG infrared spectra using ECMWF temperatures and POLDER cloud data, Geophys. Res. Lett., 28(12), 2397–2400, 2001.
Herbin, H., Hurtmans, D., Turquety, S., Wespes, C., Barret, B., Hadji-Lazaro, J., Clerbaux, C., and Coheur, P.-F.: Global distributions of water vapour isotopologues retrieved from IMG/ADEOS data, Atmos. Chem. Phys., 7, 3957–3968, 2007, http://www.atmos-chem-phys.net/7/3957/2007/.
Herbin, H., Hurtmans D., Clarisse L., Turquety S., Clerbaux C., Rinsland C. P., Boone C., Bernath P. F., and Coheur P.-F.: Distributions and seasonal variations of tropospheric ethene (C2H4)from Atmospheric Chemistry Experiment (ACE-FTS)
solar occultation spectra, Geophys. Res. Lett., 36, L04801, doi:10.1029/2008GL036338, 2009.
Herbin, H., Hurtmans, D., Clerbaux, C., Clarisse, L., and Coheur, P.-F.: H162 O and HDO measurements with IASI/MetOp, Atmos. Chem. Phys. Discuss., 9, 9267–9290, 2009,
http://www.atmos-chem-phys-discuss.net/9/9267/2009/. IASI Level 2 Product Guide, EUM/OPS-EPS/MAN/04/0033, v2A,
Eumetsat, 12 November 2008.
Hollingsworth, A., Engelen, R. J., Textor, C., Benedetti, A., Boucher, O., Chevallier, F., Dethof, A., Elbern, H., Eskes, H., Flemming, J., Granier, C., Kaiser, J. W., Morcrette, J. J., Rayner, P., Peuch, V. H., Rouil, L., Schultz, M. G., Simmons, A. J., and the GEMS Consortium: Toward a Monitoring and Forecasting System For Atmospheric Composition: The GEMS Project, B. Amer. Meteor. Soc., 89, 1147–1164, 2008.
Keim, C., Eremenko, M., Orphal, J., Dufour, G., Flaud, J.-M., H¨opfner, M., Boynard, A., Clerbaux, C., Payan, S., Coheur, P.-F., Hurtmans, D., Claude, H., Dier, H., Johnson, B., Kelder, H., Kivi, R., Koide, T., L´opez Bartolom´e, M., Lambkin, K., Moore, D., Schmidlin, F. J., and St¨ubi, R.: Tropospheric ozone from IASI: comparison of different inversion algorithms and valida-tion with ozone sondes in the northern middle latitudes, Atmos. Chem. Phys. Discuss., 9, 11441–11479, 2009,
http://www.atmos-chem-phys-discuss.net/9/11441/2009/. Martin, R. V.: Satellite remote sensing of surface air quality, Atmos.
Environ., 42(34), 7823–7843, 2008.
Massart, S., Clerbaux, C., Cariolle, D., Piacentini, A., Turquety, S., and Hadji-Lazaro, J.: First steps towards the assimilation of IASI ozone data into the MOCAGE-PALM system, Atmos. Chem. Phys., 9, 5073–5091, 2009,
http://www.atmos-chem-phys.net/9/5073/2009/.
Prigent, C., Aires, F., and Rossow, W. B.: Land surface skin temper-atures from a combined analysis of microwave and infrared satel-lite observations for an all-weather evaluation of the differences between air and skin temperatures, J. Geophys. Res., 108(D10), 4310, doi:10.1029/2002JD002301, 2003.
Razavi, A., Clerbaux, C., Wespes, C., Clarisse, L., Hurtmans, D., Payan, S., Camy-Peyret, C., and Coheur, P. F.: Characterization of methane retrievals from the IASI space-borne sounder, Atmos. Chem. Phys. Discuss., 9, 7615–7643, 2009,
http://www.atmos-chem-phys-discuss.net/9/7615/2009/. Ricaud, P., Atti´e, J.-L., Teyss´edre, H., El Amraoui, L., Peuch,
V.-H., Matricardi, M., and Schluessel, P.: Equatorial total column of nitrous oxide as measured by IASI on MetOp-A: implications for transport processes, Atmos. Chem. Phys., 9, 3947–3956, 2009, http://www.atmos-chem-phys.net/9/3947/2009/.
Richter, A., Burrows, J. P., N¨u, H., Granier, C., and Niemeier, U.: Increase in tropospheric nitrogen dioxide over China observed from space, Nature, 437, 129–132 doi:10.1038/nature04092, 2005.
Rodgers, C. D.: Inverse methods for atmospheric sounding: theory and practice, Ser. Atmos. Oceanic Planet. Phys., 2, World Sci., Hackensack, NJ, 2000.
Rouil, L., Honore, C. , Vautard, R., Beekmann, M., Bessagnet, B., Malherbe, L., Meleux, F., Dufour, A., Elichegaray, C., Flaud, J.-M., Menut, L., Martin, D., Peuch, A., Peuch, V.-H., and Poisson, N.: PREV’AIR: an operational forecasting and mapping system for air quality in Europe, B. Am. Meteor. Soc., 90(1), 73–83, doi:10.1175/2008BAMS2390.1, 2009.
Schl¨ussel, P., Hultberg, T. H., Phillips, P. L. T., August, T., and Calbet, X.: The operational IASI Level 2 processor, Adv. Space Res., 36, 982, doi:10.1016/j.asr.2005.03.008, 2005.
Shephard, M. W., Clough, S. A., Payne, V. H., Smith, W. L., Kireev, S., and Cady-Pereira, K. E.: Performance of the line-by-line ra-diative transfer model (LBLRTM) for temperature and species retrievals: IASI case studies from JAIVEx, Atmos. Chem. Phys. Discuss., 9, 9313–9366, 2009,
http://www.atmos-chem-phys-discuss.net/9/9313/2009/. Stuhlmann, R., Rodriguez, A., Tjemkes, S., Grandell, S., Arriaga,
A., B´ezy, J.-L., Aminou, D., and Bensi, P.: Plans for EUMET-SAT’s Third Generation Meteosat geostationary satellite pro-gramme, Adv. Space Res., 36, 975–981, 2005.
Turquety, S., Hadji-Lazaro, J., Clerbaux, C., Hauglustaine, D. A., Clough, S. A., Cass´e, V., Schl¨ussel, P., and M´egie, G.: Op-erational trace gas retrieval algorithm for the Infrared Atmo-spheric Sounding Interferometer, J. Geophys. Res., 109, D21301, doi:10.1029/2004JD004821, 2004.
Turquety, S., Hurtmans, D., Hadji-Lazaro, J., Coheur, P.-F., Cler-baux, C., Josset, D., and Tsamalis, C.: Tracking the emission and transport of pollution from wildfires using the IASI CO re-trievals: analysis of the summer 2007 Greek fires, Atmos. Chem. Phys., 9, 4897–4913, 2009,
http://www.atmos-chem-phys.net/9/4897/2009/.
Warneke, C., Bahreini, R., Brioude, J., Brock, C. A., de Gouw, J. A., Fahey, D. W., Froyd, K. D., Holloway, J. S., Middlebrook, A., Miller, L., Montzka, S., Murphy, D. M., Peischl, J., Ryerson, T. B., Schwarz, J. P., Spackman, J. R., and Veres, P.: Biomass burning in Siberia and Kazakhstan as an important source for haze over the Alaskan Arctic in April 2008, Geophys. Res. Lett., 36, L02813, doi:10.1029/2008GL036194, 2009.
Wespes, C., Hurtmans, D., Clerbaux, C., Santee, M. L., Martin, R. V., and Coheur, P. F.: Global distributions of nitric acid from IASI/MetOP measurements, Atmos. Chem. Phys. Discuss., 9, 8035–8069, 2009,
http://www.atmos-chem-phys-discuss.net/9/8035/2009/. Worden, H. M., Bowman, K. W., Worden, J. R., Eldering, A.,
and Beer, R.: Satellite measurements of the clear-sky green-house effect from tropospheric ozone, Nature Geosci., 1, 305– 308, doi:10.1038/ngeo182, 2008.