HAL Id: hal-03205257
https://hal.sorbonne-universite.fr/hal-03205257
Submitted on 22 Apr 2021
HAL is a multi-disciplinary open access
archive for the deposit and dissemination of
sci-entific research documents, whether they are
pub-lished or not. The documents may come from
teaching and research institutions in France or
abroad, or from public or private research centers.
L’archive ouverte pluridisciplinaire HAL, est
destinée au dépôt et à la diffusion de documents
scientifiques de niveau recherche, publiés ou non,
émanant des établissements d’enseignement et de
recherche français ou étrangers, des laboratoires
publics ou privés.
USING THE SURFACE-FEATURES CREATED BY
BIOTURBATING ORGANISMS AS SURROGATES
FOR MACROFAUNAL DIVERSITY AND
COMMUNITY STRUCTURE
S Widdicombe, M Kendall, D Parry
To cite this version:
S Widdicombe, M Kendall, D Parry. USING THE SURFACE-FEATURES CREATED BY
BIOTUR-BATING ORGANISMS AS SURROGATES FOR MACROFAUNAL DIVERSITY AND
COMMU-NITY STRUCTURE. Vie et Milieu / Life & Environment, Observatoire Océanologique - Laboratoire
Arago, 2003, pp.179-186. �hal-03205257�
USING THE SURFACE-FEATURES CREATED BY BIOTURBATING
ORGANISMS AS SURROGATES FOR MACROFAUNAL DIVERSITY
AND COMMUNITY STRUCTURE
S. WIDDICOMBE*
1, M. A. KENDALL
1, D. M. PARRY
21Plymouth Marine Laboratory, Prospect Place, West Hoe, Plymouth, PL1 3DH,UK 2Institute of Marine Studies, University of Plymouth, Drakes Circus, Plymouth, PL4 8AA,UK * Corresponding author Email: [email protected]
SURFACE FEATURES BENTHIC DIVERSITY BIOTURBATION NON-DESTRUCTIVE MONITORING MEGAFAUNA MACROFAUNA
ABSTRACT. – Relationships between the surface features created by infaunal bio-turbators and the diversity and structure of a macrobenthic community were identi-fied at spatial scales of 30 to 100 cm for an area of shallow (10 m) subtidal sediment at Jennycliff Bay (Plymouth, UK) in May 2000. At spatial scales≥80 cm, macrofaunal heterogeneity, and diversity, was greater in areas that contained many different surface features compared with areas containing few features. This obser-vation is field evidence to substantiate suggestions that the non-destructive quanti-fication of conspicuous surface features is a useful surrogate of macrobenthic diversity. This surrogate may be most useful in assessing large scale impacts on se-diment habitats such as faunistic changes over long distances, long-term temporal changes in a particular place or assessing differences between habitats or geogra-phical locations.
STRUCTURES DE SURFACE DIVERSITÉ BENTHIQUE BIOTURBATION SURVEILLANCE NON DESTRUCTIVE MÉGAFAUNE MACROFAUNE
RÉSUMÉ. – Des rapports entre les dispositifs de surface créés par des organismes fouisseurs et la diversité et la structure d’une communauté macrobenthique ont été identifiés aux échelles spatiales de 30 à 100 cm pour un secteur (10 m) de sédiment subtidal peu profond dans la baie de Jennycliff (Plymouth, R-U) en mai 2000. Aux échelles spatiales≥ 80 cm, l’hétérogénéité de la macrofaune, et la diversité, sont plus élevées dans les secteurs qui contiennent de nombreuses structures extérieures différentes en comparaison avec les secteurs contenant peu de ces dispositifs. Cette observation est une démonstration in situ pour justifier des suggestions selon les-quelles la quantification non destructive des structures de surface remarquables est un substitut utile de la diversité macrobenthique. Ce substitut peut être particulière-ment utile lors de l’évaluation des impacts à grande échelle sur les habitats des sé-diments, tels que les changements faunistiques sur de longues distances, les changements temporels à long terme d’un site particulier ou lors de l’évaluation des différences entre habitats ou localisations géographiques.
INTRODUCTION
Bioturbation has a substantial influence on the physical and chemical properties of the sediments; burrowing and/or feeding activities can have a strong influence on sediment granulometry, the penetration of oxygen, nutrient flux and the fre-quency of sediment disturbance (e.g. Widdicombe & Austen 1988, Rowden & Jones 1993, Nedwell & Walker 1995). As the properties of the sediment change so too does its suitability for colonisation and exploitation by secondary species. Bioturbating organisms have been shown to impact on macrobenthic communities both directly through physical interactions (e.g. predation) and indirectly through changes in the sediment environment. However, the scale of bioturbation impact is not
solely a result of differences in the intensity and frequency of disturbance (Widdicombe et al. 2000). Mesocosm studies have shown that the intensity of bioturbation and the identity (or functional type) of the bioturbator responsible, act simultaneously on different elements of macrobenthic communities (Widdicombe & Austen 1999, Widdicombe et al. 2000). Further evidence for the importance of sediment complexity in the maintenance of high diversity macro-infaunal com-munities was provided by Thrush et al. (2001). These authors suggested that between 74 and 86% of the variance in macrobenthic diversity was ex-plained by habitat structure. Clearly bioturbation is an important process in producing heterogeneity or complexity within the sediment habitat thus main-taining levels of diversity.
In the face of growing environmental pressures on coastal marine ecosystems the need to assess and monitor changes in marine communities is greater than ever. In particular, legislation de-signed to protect marine habitats and biodiversity (e.g. EC Habitats Directive 1992) has placed great demands on those responsible for the management of coastal resources. However, traditional methods of biodiversity assessment that involve the quanti-fication of entire communities are highly labour in-tensive and therefore expensive (McIntyre 1983, Warwick 1993). If efficient monitoring and man-agement is to be achieved over large areas of coastal waters, techniques need to be developed that allow rapid, cost effective assessment of com-munity structure and diversity. Such methods do not need to deliver outputs with high levels of pre-cision, it is sufficient that they produce information that is “fit for purpose”. A number of authors (e.g. James et al. 1995, Kendall & Widdicombe 1999) have shown that when assessing the pattern of dis-tribution of benthic assemblages, coarser sieve meshes or identification to higher taxa produce re-sults that differ little from those produced using a complete survey design. Others have suggested the use of surrogates, elements of the biota whose pres-ence predicts biological properties of the whole as-semblage. For example, Oslgard & Somerfield (2000) suggested that analysis of a small subset of the polychaete fauna might be sufficient to predict the diversity of the whole assemblage. Similarly, Warwick & Light (2002) have investigated the use of molluscan death assemblages on seashores to predict the biodiversity of the adjacent offshore fauna. Other studies have shown that it is not al-ways necessary to identify organisms to species level as the same patterns of community change may be observed for data at the family or genus level (Warwick 1988, Olsgard et al. 1997).
Even with a reduced sample processing effort, classical analysis of benthic samples remains both costly and time consuming. As remote collection of benthic sediment is destructive it must be used with great discretion in environmentally sensitive areas. If the extent of bioturbation and the identity of the bioturbators combine to influence local sediment diversity, the acquisition of information on bioturbators and their distribution might be used to predict patterns of infaunal benthic biodiversity. Although the majority of benthic organisms have some bioturbational impact, it seems intuitive that larger bodied, highly active species will have the greatest impact on sediment structure and associ-ated communities. These larger animals often cre-ate characteristic surface features (Nash et al. 1984, Atkinson & Nash 1990, Atkinson et al. 1998, Parry 2002) from which their identity can be de-duced.
To facilitate the identification and mapping of bioturbators and surface features, data may be
col-lected from quantitative remotely operated vehicle (ROV) observations. Such data have been validated previously against those derived from direct diver observation (Parry et al. 2002) and have proved to be an accurate and effective representation of the biogenic landscape. Furthermore, spatial referenc-ing of ROV images allows mappreferenc-ing of megafaunal assemblages within benthic landscapes (Parry et al. 2003).
Through the intensive study of a relatively small area of bioturbated seabed, the current study aims to establish whether a relationship exists between the identity and abundance of biologically pro-duced surface features and the structure and diver-sity of infaunal macrobenthic communities. The potential of surface features as an accurate surro-gate of macrobenthic community structure and di-versity is discussed.
METHODS
Sample area: The field sampling was conducted between 30th-31st May 2000 at Jennycliff Bay (50º21.0’N 04º07.8’W), a sheltered bay within Plymouth Sound. This area is an extensive stretch of sandy mud (Marine Biological Association 1957) with a water depth of ap-proximately 10 m and generally low current speeds. Jen-nycliff Bay supports high megafaunal densities, characterised by thalassinidean shrimp (Upogebia del-taura and Callianassa subterranea), Goneplax rhomboi-des and several large bivalve species (Parry 2002). Patterns in macrobenthic community structure have been well studied at this site (Kendall & Widdicombe 1999). Characterisation of biogenic landscape: Megafaunal as-semblage data extracted from remote observations of the seabed may be considered descriptors of the biological-ly-mediated landscape rather than an absolute estimate of megafaunal species abundance because different bur-rows have a variable number of surface openings. Never-theless, the morphology of surface features may be used to infer the identity of species responsible for burrow construction (e.g. Nickell & Atkinson 1995). The defini-tion of megafaunal assemblage used in the present study encompassed surface dwelling megafauna and biogenic sediment features, such as burrow openings and mounds, because many soft-sediment megafaunal species bury deep in the sediment. To describe the biologically-me-diated landscape, the abundance of both megafaunal in-dividuals and surface features was used to construct matrices of Bray–Curtis similarity.
To quantify the abundance and diversity of both me-gabenthic and macrobenthic infauna a 3 × 3 m steel frame was deployed. This frame was subdivided into a grid of 50 × 50 cm and was fixed to the sea floor by em-bedding the steel legs at each corner of the frame firmly into the sediment. The area within each of the 50 × 50 cm cells was filmed using a Remotely Operated Vehicle (ROV) and the images recorded on video tape. The ROV camera was fitted with the Automated Benthic Image Scaling System (ABISS), a structured lighting array that
was used for image scaling (Pilgrim et al. 2000). Benthic Imager software (University of Plymouth, UK) (Pilgrim et al. 2000) was used to analyse the laser spot pattern and calculate camera orientation allowing accurate mea-surements (±5%) of features to be taken from each still image. Still images were selected and captured from the videotape such that the entire survey plot was represen-ted to allow measurement of all biogenic surface-featu-res observed. Featusurface-featu-res counted included burrows, tubes and all surface dwelling megafauna. The identity of spe-cies responsible for burrow construction was determined where possible using the morphological characteristics described by Marrs et al. (1996) and by direct sampling of observed features (Parry 2002)
Sampling macro-infauna: After the grid had been map-ped by the ROV, 61 macrofauna samples were taken, one sample at the centre of each cell and a sample at each intersection (Fig. 1). Macrofaunal samples were ta-ken by divers using 10 cm diameter plastic cores (0.008 m2 surface area) pushed into the sediment to a depth of 30 cm. These were carefully excavated and sea-led inside plastic bags. On the surface, the sample bags were opened and the water inside decanted over a 0.5 mm mesh. Each bag was filled with 10% buffered formalin and resealed. After 4 days, the samples were washed over a 0.5 mm mesh before all animals were ex-tracted. Animals were identified under a binocular mi-croscope to the lowest practical taxonomic level. In the case of the cirratulid polychaetes, the separation of indi-viduals of the genera Monticellina / Tharyx, Caulerialla and Chaetozone was normally possible; however when damaged the individual species of Monticellina / Tharyx could not be reliably separated and hence have been combined in all data analyses. Wherever possible, spe-cies nomenclature followed Howson & Picton (1997). Relating surface features to macrobenthic community structure: Megafauna have been defined operationally as those organisms large enough to be observed by a came-ra (Gcame-rassle et al. 1975), yet the absolute dimensions of an organism in an image depend upon image resolution. In the present study, all epibenthic megafaunal indivi-duals and biotic sediment structures associated with
bur-rowing megafauna detected in underwater images were measured using Benthic Imager (Pilgrim et al. 2000), but were only included in analyses if the diameter excee-ded 10 mm.
The euclidean distance between each macrofaunal core and each megafaunal surface-feature was calculated using MATLAB software (version 5.03, The MathWorks Inc.). Around each macrofauna core biogenic features were quantified with progressively larger circles of 30, 40, 50, 60, 70, 80, 90 and 100 cm diameter. These circles are subsequently referred to as virtual quadrats. Within each of the virtual quadrats data on the identity and abundance of surface features were obtained from analy-sis of the video images.
Multivariate data analyses followed the methods des-cribed by Clarke (1993) using the PRIMER version 5.0 software package (Clarke & Warwick 1994). Analysis was carried out on both untransformed and √√ transfor-med macrofauna data, using the Bray-Curtis similarity measure, to examine different components of the com-munity. Analysis of untransformed data is sensitive to changes in the abundance of the dominant species whilst analysis of√√transformed data detects effects on commu-nity structure generally including changes in the abun-dance of the rarer species, without being unduly influenced by dominant, high abundance species.
Pair-wise Bray-Curtis similarities (untransformed data) between megafaunal surface-feature samples of the same size were calculated and similarity matrices for each of the eight sample sizes created. RELATE was used to compare each of these matrices with the equiva-lent matrix calculated from the infaunal abundance data. For the smallest virtual quadrat size (30 cm diameter) all macrofauna samples were used in the analysis. However, for larger quadrats an area of overlap existed when the quadrat was overlain neighbouring macrofauna samples. Consequently, for comparisons involving quadrats grea-ter than 30 cm in diamegrea-ter smaller subsets of macrofau-nal samples were used to ensure sample independence. For quadrats of 40 cm and 50 cm diameter 2 separate subsets of macrofauna cores were used (Fig. 2a), whilst for quadrats with a diameter greater than 50 cm a subset of 9 macrofauna samples (B2, B6, B10, F2, F6, F10, J2, J6 and J10) was used (Fig. 2b).
For each of the nine, non-overlapping, 1 m diameter surface-feature samples, a mean Bray-Curtis similarity value (√√transformed data) was calculated from pair-wise analyses using all of the 5 macrofauna cores contai-ned within the area of the surface-feature sample. To es-tablish the extent to which the number of different types of surface-features in any given area predicted macro-faunal heterogeneity, mean Bray-Curtis similarity was plotted against surface feature diversity (number of dif-ferent types of surface feature within a given area). Relating surface feature diversity to macobenthic diver-sity: Univariate measures of diversity [number of spe-cies, number of individuals, Margalef species richness (d), Shannon-Wiener diversity (H’) and Pielou’s eveness (J’)] were calculated, using PRIMER, for each macro-fauna sample and plotted against the diversity of the sur-rounding surface features. This was done for all sizes of virtual quadrat. In addition, for quadrats with a diameter of 1 m, the 5 macrobenthic samples contained within each one were pooled and the diversity of these pooled samples was compared with the diversity of the surroun-Fig 1. – Positions and labelling scheme for
ding surface features. In all cases surface feature diversi-ty was the number of different diversi-types of surface feature within a given area.
RESULTS
Surface features observed
A total of eleven different megafaunal biotic feature types were identified from the images (Table I). Biogenic sediment features included thalassinidean mud shrimp burrow openings (Upogebia deltaura and Callianassa subterranea) and mounds (Callianassa subterranea), angular crab burrows (Goneplax rhomboides), bivalve si-phons and a variety of unknown surface openings and feeding pits. Megafaunal species included the infaunal bivalves Lutraria lutraria, Acanthocardia sp. and Unknown Bivalve 1, plus ophiuroids. Macrofauna community of study area
A total of 124 taxa were identified during this study with the community being numerically
domi-nated by polychaetes (73), molluscs (19) and crus-taceans (19). The species rich community at Jennycliff Bay was typical for sandy-mud sedi-ments of unpolluted boreal regions of the northeast Atlantic.
Relating surface features to macrobenthic community structure
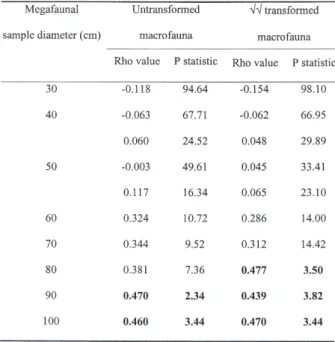
For small virtual quadrat sizes (less than 80 cm diameter), patterns of similarity generated by sur-face feature abundance data were different from patterns generated using the macrofauna abun-dance data (Table II). Significant correlations were observed when the larger virtual quadrat sizes were used. Changes in the relative abundance of the nu-merically dominant macrofauna (untransformed data) correlated to changes in the surface features for virtual quadrat sizes of 90 cm and 1 m, whilst macrobenthic community changes due to the rarer species (√√transformed data) were correlated to changes in the surface features for virtual quadrat sizes of 80 cm, 90 cm and 1 m (Table II). This would suggest that changes in the identity and den-sity of surface features over these larger, spatial
182 S. WIDDICOMBE, M. A. KENDALL, D.M. PARRY
Fig 2. – Macrofauna cores used (filled circles) for comparisons with a, virtual quadrats of 40 and 50 cm diameter (virtual quadrats of 50 cm diameter shown) and b, virtual quadrats of 60, 70, 80, 90 and 100 cm diameter (virtual quadrats of 100 cm diameter shown).
scales mimic those changes observed in both the numerically dominant and the rarer macrofaunal species.
In areas with a large number of different surface features, the macrobenthic community exhibited more small scale (< 1 m) heterogeneity than in ar-eas with a low diversity of surface features (Fig. 3). This response was only observed in√√transformed data and would suggest that this increased patchi-ness is due to changes in the identity and abun-dance of the rarer species.
Relating surface feature diversity to macrobenthic diversity
No relationship was observed between the sity of individual macrofauna cores and the
diver-sity of the surrounding megabenthic surface fea-tures. However, if 5 macrofauna cores, taken within each of the nine 1 m diameter surface fea-ture quadrats, are pooled then a relationship be-tween macrobenthic diversity and that of surface features emerges. At this scale as the diversity of surface features increases so does that of macrobenthos (Fig. 3). During sampling it was ob-served that one quadrat contained a very extensive Goneplax burrow. It was considered that the large amount of disturbance associated with this feature would have masked the effects of the other features and caused lower than expected macrobenthic di-versity. This sample was therefore omitted from the analysis. The relationship between surface fea-ture diversity and macrobenthic diversity gradually broke down as the different diversity indices used became increasingly more reliant on eveness in preference to species richness.
DISCUSSION
This study has shown that for the particular macrobenthic community observed, faunal hetero-geneity, and diversity, was greater in areas that contained many different surface features com-pared with areas containing few features. This ob-servation is field evidence to substantiate previous work that suggested macrofaunal diversity would be highest in areas populated by a high diversity of bioturbating species (Widdicombe et al. 2000, Widdicombe & Austen 1999). This assumption had previously been based on experimental evidence that showed different species of bioturbators, or types of bioturbation, generated characteristic as-sociated communities of macrofauna. If such a mechanism was responsible for the relationships seen in the current study it would be expected that the strongest patterns should be visible in the iden-tity and abundance of the rare species, as was the case. Only when macrofauna community data was analysed using moderately heavy transformation, thus reducing the impact of numerically dominant species and enhancing that of rare species, were any relationships observed.
By using a particularly fine scale of spatial reso-lution it could be seen that, only when analysing areas of 80 cm in diameter and larger was the di-versity and community structure of surface features related to that of the infauna. The reason the rela-tionship is only seen for the largest size of surface feature quadrats is most probably related to the scale at which the surface features occur. A single feature may be in excess of 30 cm across and con-sequently the smaller virtual samples contained only a few surface features. This low number of surface features per quadrat would make macrobenthic – surface feature comparisons unre-alistic. It is clear that the processes involved in the creation of sediment surface features, particularly bioturbation, might be considered to set infaunal diversity at the scale of habitats rather than that of samples. This suggests the greatest value of using surface features as a surrogate for diversity would come when assessing large scale impacts on sedi-ment habitats; faunistic changes over long dis-tances, long-term temporal changes in a particular place or assessing differences between habitats or geographical locations.
Whilst visual mapping of the sediment surface provides an enormous amount of information on the identity and distribution of many key bioturbating species there are some species (e.g. polychaetes such as Nephtys sp., burrowing echinoids and nuculacid bivalves) which do not create conspicuous surface features. These “invisi-ble” species have been shown to have a significant impact on the diversity and structure of macrobenthic communities (Widdicombe et al.
184 S. WIDDICOMBE, M. A. KENDALL, D.M. PARRY
Table II. – Comparisons of surface feature community structure (untransformed data) with macrobenthic com-munity structure (untransformed and transformed data) at a range of spatial scales using RELATE (bold values indicate significant correlations).
Fig 3. – Top, the relationship between megabenthic sur-face feature diversity and infaunal homogeneity [as mea-sured by mean Bray-Curtis similarity] (± 95% confidence intervals). Bottom, relationship between sur-face feature diversity and the total number of macrofau-nal species from 5 pooled samples (R=0.6697).
2000) and their inclusion in any measure of bioturbator diversity may well provide a more ro-bust surrogate for diversity than surface features alone. In the past it has been impossible to map these species non-destructively at broad spatial scales. However, many of these animals have a di-rect impact on aspects of sediment structure e.g. al-tering the depth of oxygen penetration, consolidat-ing / destabilisconsolidat-ing the sediment fabric. A number of techniques are now available that allow such changes in sediment quality to be observed. Firstly, acoustic imaging techniques (e.g. RoxAnnTM and
QTC ViewTM) can provide data on the “hardness”
or “softness” of sediments by measuring the extent to which sound waves penetrate below the sedi-ment surface. Secondly, vertical cross sections of the sediment, down to a depth of 20 cm, can now be made using Sediment Profile Imagery (Rhoads & Germano 1982, Smith et al. 2003) providing in-formation on the depth of the oxic layer and reveal-ing sub-surface bioturbatory structures. It may therefore be possible to develop an efficient, non-destructive method of monitoring biodiversity by using an integrated approach of visual observations of the sediment surface and vertical profiles through the sediment in addition to fine scale acoustic assessment of sediment parameters.
Whilst the results from the current study are clearly encouraging for the use of conspicuous sur-face features as surrogates for macrobenthic diver-sity, a number of issues should be addressed. Due to the enormous amount of effort required to sam-ple even a small area with the degree of spatial res-olution achieved here, the current study was con-ducted over a very small spatial scale. Consequently, the findings in this paper can not necessarily be extrapolated to all soft-sediment communities at all places or times. It is also true that the ability to discriminate between the similar surface features generated by functionally different organisms must be improved. For example, the cur-rent study identified two features described as thalassinidean openings and thalassinidean mounds, both of these features were generated by two different species of thalassinidean shrimp; Callianassa subterranea and Upogebia deltura. Whilst both these species are burrow-forming decapods the nature of their burrows, their feeding mode and consequently their impact on the associ-ated macrofauna are different. Consequently, the inability to differentiate between the features gen-erated by these two species will have had an impact on the findings presented in this paper. The poten-tial use of non-destructive video surveys of con-spicuous surface features as a tool for monitoring the diversity of macro-infaunal communities high-lighted here must therefore be tested more widely before being realised. In particular, other areas with differing assemblages of megafaunal
bioturbators should be examined and the differen-tial effects of such species on the macrofauna need to be considered when interpreting the data. Addi-tionally, to be a truly valuable assessment tool, the relationship must be shown to exist in other geo-graphic locations and in different soft-sediment habitats.
ACKNOWLEDGEMENTS. – The work contained in this paper was funded by a grant from UK DEFRA (project no AE1137) and by the UK Natural Environment Re-search Council through the Plymouth Marine Laboratory research program (Aim 3). We would like to thank Dr M Austen, Dr M Burrows, Dr L Nickell, Dr P Somerfield, Dr D Pilgrim’ Rob Wood, and the Crew aboard RV Squilla and RV Sepia, all of whom provided valuable contributions to aspects of this study.
REFERENCES
Atkinson RJA, Nash RDM 1990. Some preliminary ob-servations on the burrows of Callianassa subterranea from the West Coast of Scotland. J Nat Hist 24: 403-413.
Atkinson RJA, Froglia C, Arneri E, Antolini B 1998. Observations on the burrows and burrowing beha-viour of Brachynotus gemmellari and the burrows of several other species occurring on the Squilla grounds off Ancona, central Adriatic. Sci Mar 62: 91-100. Clarke KR 1993. Non-parametric multivariate analyses
of changes in community structure. Aust J Ecol 18: 117-143.
Clarke KR, Warwick RM 1994. Changes in marine com-munities: an approach to statistical analysis and inter-pretation. Natural Environment Research Council, Swindon.
EC Habitats Directive 1992. The Council Directive on the conservation of the natural habitats and of wild fauna and flora (92/43/EEC of 21 May 1992) Grassle JF, Sanders HL, Hessler RR, Rowe GT,
McLel-lan T 1975. Pattern and zonation: a study of the ba-thyal megafauna using the research submersible Alvin. Deep Sea Res 22: 457-481.
James RJ, Lincon Smith MP, Fairweather PG 1995. Sieve mesh size and taxonomic resolution needed to describe natural variation of marine macrofauna. Mar Ecol Prog Ser 118: 187-198.
Howson CM, Picton B 1997. The species directory of the marine fauna and flora of the British Isles and sur-rounding seas. Ulster Museum and the Maine Conser-vation Society, Belfast and Ross on Wye.
Kendall MA,Widdicombe S 1999. Small scale patterns in the structure of macrofaunal assemblages of shal-low soft sediment. J Exp Mar Biol Ecol 237: 127-140. Marine Biological Society 1957. Plymouth Marine
Fau-na.
Marrs SJ, Atkinson RJA, Smith CJ, Hills JM 1996. Cali-bration of the towed underwater TV technique for use in stock assessment of Nephrops norvegicus. Final Report to the European Commission 94/069: 155. McIntyre AD 1983. What happened to biological effects
Nash RDM, Chapman CJ, Atkinson RJA, Morgan PJ 1984. Observations on the burrows and burrowing be-haviour of Calocaris macandreae (Crustacea: Deca-poda: Thalassinoidea). J Zool Soc Lond 202: 425-439.
Nedwell DB, Walker TR 1995. Sediment – water fluxes of nutrients in an Antarctic coastal environment: Influences of bioturbation. Polar Biol 15: 57-64. Nickell LA, Atkinson RJA 1995. Functional morphology
and trophic modes of three thalassinidean shrimp spe-cies, and a new approach to the classification of tha-lassinidean burrow morphology. Mar Ecol Prog Ser 128: 181-197.
Olsgard F, Somerfield PJ, Carr MR 1997. Relationships between taxonomic resolution and data transforma-tions in analyses of a macrobenthic community along an established pollution gradient. Mar Ecol Prog Ser 149: 173-181.
Olsgard F, Somerfield PJ 2000. Surrogates in marine benthic investigations – which taxonomic unit to tar-get ? J Aqua Stress Rec 7: 25-42.
Parry DM 2002. Quantification of marine megafaunal distribution patterns using a remotely operated ve-hicle. PhD Thesis, Univ Plymouth, 233p.
Parry DM, Kendall MA, Pilgrim DA, Jones MB 2003. Identification of patch structure within marine ben-thic landscapes using a Remotely Operated Vehicle. J Exp Mar Biol Ecol 285-286: 497-511.
Parry DM, Nickell LA, Kendall MA, Burrows MT, Pil-grim DA, Jones MB 2002. Comparison of abundance and spatial distribution of burrowing megafauna from diver and Remotely Operated Vehicle observations. Mar Eco Prog Ser 244: 89-93.
Pilgrim DA, Parry DM, Jones MB, Kendall MA 2000. ROV image scaling with laser spot patterns. Under-water Technology 24: 93-103.
Rhoads DC, Germano JD 1982. Characterisation of or-ganism–sediment relations on the muddy sea floor using sediment profile imaging: an efficient method of Remote Ecological Monitoring of the Seafloor (REMOTS System). Mar Ecol Prog Ser 8: 115-128.
Rowden AA, Jones MB1993. Critical evaluation of sedi-ment turnover estimates for Callianassidae (Decapo-da: Thalassinidea). J Exp Mar Biol Ecol 173: 265-272.
Smith CJ, Rumohr H, Karakassis I, Papadopoulou KN 2003. Analysing the impact of bottom trawls on sedi-mentary seabed with sediment profile imagery. J Exp Mar Biol Ecol 285-286: 479-496.
Thrush SF, Hewitt JE, Funnell GA, Cummings VJ, Ellis J, Schultz D, Talley D, Norkko A 2001. Fishing dis-turbance and marine biodiversity: the role of habitat structure in simple soft-sediment systems. Mar Ecol Prog Ser 223: 277-286.
Warwick RM 1988. The level of taxonomic discrimina-tion required to detect polludiscrimina-tion effects on marine benthic communities. Mar Pollut Bull 19: 259-268. Warwick RM 1993. Environmental impact studies on
marine communities: pragmatical considerations. Aust J Ecol 18: 63-80.
Warwick RM, Light J 2002. Death assemblages of mol-luscs on St Martin’s Flats, Isles of Scilly: a surrogate for regional biodiversity ? Biodiv Conserv 11: 99-112.
Widdicombe S, Austen MC 1998. Experimental evi-dence for the role of Brissopsis lyrifera (Forbes, 1841) as a critical species in the maintenance of ben-thic diversity and the modification of sediment che-mistry. J Exp Mar Biol Ecol 228(2): 241-255. Widdicombe S, Austen MC 1999. Mesocosm
investiga-tion into the effects of bioturbainvestiga-tion on the diversity and structure of a subtidal macrobenthic community. Mar Ecol Prog Ser 189: 181-193.
Widdicombe S, Austen MC, Kendall MA, Warwick RM, Jones MB 2000. Bioturbation as a mechanism for set-ting and maintaining levels of diversity in subtidal macrobenthic communities. Hydrobiologia 440: 369-377.
Reçu le 18 août 2003; received August 18, 2003 Accepté le 23 octobre 2003; accepted October 23, 2003