HAL Id: insu-01354129
https://hal-insu.archives-ouvertes.fr/insu-01354129
Submitted on 17 Aug 2016
HAL is a multi-disciplinary open access
archive for the deposit and dissemination of
sci-entific research documents, whether they are
pub-lished or not. The documents may come from
teaching and research institutions in France or
abroad, or from public or private research centers.
L’archive ouverte pluridisciplinaire HAL, est
destinée au dépôt et à la diffusion de documents
scientifiques de niveau recherche, publiés ou non,
émanant des établissements d’enseignement et de
recherche français ou étrangers, des laboratoires
publics ou privés.
The effective elastic thickness (Te) of continental
lithosphere: What does it really mean?
E.B. Burov, Michel Diament
To cite this version:
E.B. Burov, Michel Diament. The effective elastic thickness (Te) of continental lithosphere: What
does it really mean?. Journal of Geophysical Research : Solid Earth, American Geophysical Union,
1994, 100 (B3), pp.3905-3927. �10.1029/94JB02770�. �insu-01354129�
JOURNAL OF GEOPHYSICAL RESEARCH, VOL. 100, NO. B3, PAGES 3905-3927, MARCH 10, 1995
The effective elastic thickness
(Te) of continental lithosphere:
What does it really mean?
Evgene
B. Burov
• and Michel Diament
Laboratoire de Gravim6trie et G6odynamique J.E. 335, Institut de Physique du Globe de Paris, France
Abstract. It is well accepted that the lithosphere may exhibit nonzero mechanical strength over geological time and space scales, associated with the existence of non-lithostatic (deviatoric) stress. The parameter that characterizes the apparent strength of the lithosphere is the flexural rigidity D, which is commonly expressed through the effective elastic thickness (Te) of the litho- sphere. Estimates of Te for oceanic lithosphere approximately follow the depth to a specific iso- therm (--600øC), which marks the base of the mechanical lithosphere. The physical meaning and significance of the effective elastic thickness for continents are still enigmatic, because for conti- nental lithosphere estimates of Te bear little relation to specific geological or physical boundaries.
Although
high observed
values
of T• (70-90 km for cratons)
can be partly explained
by the pre-
sent-day temperature gradients, the low values (10-20 km), in general, cannot. In addition, the elastic plate models are self-inconsistent in that they mostly predict intraplate stresses high enough to lead to inelastic (brittle or ductile) deformation, according to data of rock mechanics. To provide a basis for a physically consistent unified interpretation of the observed variations of T• for continental and oceanic lithosphere, we developed an analytical and numerical approach that allows direct treatment of T• in terms of the lithospheric rheology, thermal structure, and strain/stress distribution. Our technique is based on finding true inelastic and equivalent
(effective) elastic solutions for the problem of deformation of the lithosphere with realistic brittle- elasto-ductile rheology. We show that the thermal state (thermotectonic age) of the lithosphere is only one of at least three equally important properties that determine apparent values of Te. These other properties are the state of the crust-mantle interface (decoupling of crust and mantle), the thickness and proportions of the mechanically competent crust and mantle, and the local curva- ture of the plate, which is directly related to the bending stresses. The thickness of the mechani- cally competent crust and the degree of coupling or decoupling is generally controlled by compo- sition of the upper and lower crust, total thickness of the crust, and by the crustal geotherm. If
decoupling
takes
place, it permits
as much as 50% decrease
of Te, compared
with Te implied from
conventional thermal profiles. Comparison of the theoretically predicted T• with inferred values for different regions suggests that the lower crust of most continental plates has a low-tempera- ture activation rheology (such as quartz) which permits crust and mantle decoupling. The curva-
ture of the plate depends
on the theological
structure
and on the distribution
of external
loads
ap-
plied to the plate (e.g., surface
topography,
sediment
fill, and plate-boundary
forces).
Bending
stresses created by major mountain belts are large enough to cause inelastic deformation (brittle failure and a ductile flow) in the underlying plate, which, in turn, leads to a 30 to 80% decrease
of Te beneath
such
belts and less
beneath
the adjacent
regions.
The boundary
forces
and moments
(e.g., due to the slab pull, etc.) lead to more localized but even stronger reductions in Te (e.g., plate necking in subduction zones). Our approach provides a feedback between the "observed" T• and rheology, allowing to constrain the lithospheric structure from estimates of Te.
Introduction
The significance and utility of the flexural rigidity or the ef- fective elastic thickness (Te) of the lithosphere are based on the concept that the gravitational equilibrium of the lithosphere can be maintained over geological time and space scales and that the resulting static deformation is explicable as flexure of a thin competent (elastic, plastic) plate overlying an inviscid fluid
classical Airy model (local compensation) corresponds to a flexural model where the plate has no strength (zero rigidity, zero viscosity, etc.). Analytical and numerical models of the me- chanical behavior of the lithosphere generally consider it as a closed system with "black box" response to external parameters: the input variables include surface and subsurface loads, density
variations
(i.e., motretain
belts,
magmatic
underplating),
forces
(asthenosphere).
The
deflection
of the
plate
depends
on
the
in- (due
to horizontal
far-field
stresses),
and
bending
moments
ferred
properties
of
the
plate
(elastic,
plastic,
etc.).
For
example,
(related
to plate
curvature),
whereas
output
variables
consist
of
the geometry of the substratum (crystalline basement), deflec- tions of the Moho, and gravity anomalies [e.g., Watts and
•On
leave
from
Institute
of
Physics
of
the
Earth,
Moscow.
Talwani,
1974;
Dubois
et al., 1974;
McKenzie
and
Bowin,
1976;
Forsyth, 1980; McNutt, 1980; Lyon-Caen and Molnar, 1983; De Rito et al., 1986; Sheffels and McNutt, 1986; Watts and Tome, 1992]. Irrespective of the real strain and stress distribution oc- curting within the deformed lithosphere, one can always estimate
Copyright 1995 by the American Geophysical Union. Paper number 94JB02770
0148-0227/95/94 JB-02770505.00
3906 BUROV AND DIAMENT: ELASTIC THICKNESS OF THE CO•NTAL LITHOSPHERE
an "equivalent," or "effective," elastic (plastic, or visco-elastic) plate thickness that will relate the output to the input by match- ing observed deflection of the plate to the calculated deflection. However, the estimates of Te have little correlation with any geological or physical boundary within the continental litho- sphere, although they provide a convenient basis for comparison between continental regions [e.g., McNutt et el., 1988; Ebinger et el., 1989; Bechtel et el., 1990]. This is partly because no in- formation on the internal structure of the lithosphere is used, and the assumed mechanical properties of the plate parameterize only the "response function" of the lithosphere and therefore cannot provide any insights into the actual "black box" (continental lithosphere). We refer an estimate of Te, obtained by the tradi- tional methods, as the "observed" or "inferred" Te. Such an esti- mate can be treated as a fixed parameter of the response function that roughly relates two general groups of observations: external loads (e.g., topography) and the plate deflections, caused by these loads (estimated from Moho or substratum geometry, grav- ity anomalies, bathymetry). Even if the physical meaning of the observed Te is not evident, it is clear that the deflection of a li- thospheric plate, or gravity anomalies measured over it, yield an estimate of an average value of Te.
In the past 10-15 years it became widely accepted [Caldwell
and Turcotte, 1979; Watts et el., 1980; McNutt and Menard,
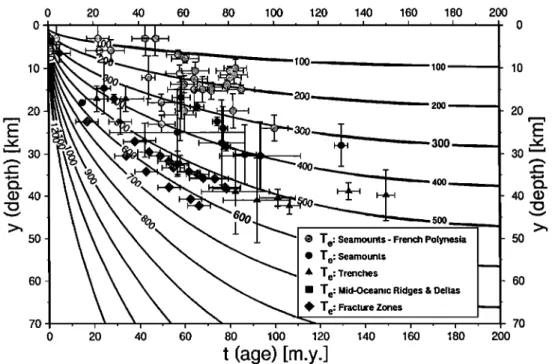
1982] that the major factor, responsible for variation of Te of oceanic plates, is the thermal structure of the oceanic lithosphere, which depends on its thermal age. The thermal age is usually defined as a period of time required for the lithosphere to reach its present-day thermal state, assuming that the lithosphere was initially melted. The thermal age of the oceanic lithosphere mostly coincides with the real (geological) age, except in zones of remarkable thermal anomalies. The lithosphere cools with time, becomes stronger, and T e increases. It was shown [Watts, 1978, Figure 1] that the value of Te approximately equals the
depth to a specific geotherm of 450øC-600øC used to determine the base of the mechanical portion of the oceanic lithosphere. In spite of deviations from this relationship in the vicinity of some seamcunts and oceanic islands [e.g., Calmant and Cazenave, 1986], or at the deep-sea trenches and large-offset fracture zones [McNutt and Menard, 1982; Weseel and Haxby, 1990], it gener- ally works well in the oceans (Figure 1). Any significant devia- tions of the observed Te from that predicted from the conven- tional thermal model are usually treated as indicators of thermal anomalies (though McAdoo et el. [1985] have shown that intense bending, for example, at trenches, may result in decrease of the strength of the lithosphere).
Some of the scatter in values of Te obtained by different authors can result from use of different material parameters for
its estimation
[Deplus,
1987]. Te is equal to (12D(1-v2)/E)
-3
where D is the flexural rigidity. Typical variations in assumed values of E and v (Young's modulus and Poiseone's ratio, respec- tively) may lead to -10-20% scatter in estimates of Te (Thus the flexural rigidity D is less uncertain than Te, and for comparison between different regions or data sources it is important to know both parameters, D and Te.) The quality of the bathymetry and other data, as well as the different techniques used for estimation of Te (admittance, coherence, forward modeling), also cause dis- crepancies between the theoretical predictions and estimates of Te inferred from observations of lithospheric flexure [e.g., Weseel, 1993; Filmer et el., 1993]. Another possible source of uncertainty is the usual neglect by possible horizontal stresses in computing the flexure. Indeed, the horizontal stresses can be neg- lected within the assumption that the lithosphere is perfectly elastic and flexes in a stable regime [Turcotte and Schubert, 1982]. However, in the case of inelastic lithosphere the effect of horizontal stresses is much more important due to possible strain softening and development of instabilities [Cloetingh et el., 1982; Cloetingh, S., and E.B. Burov, Thermomechanical stmc-
0 20 40 60 80 1 O0 120 140 160 180 200 0 , I • I , I , I , I , I , I • I , I •oo----__.._._.____•
• 20
:::•-•
200
..• -- 300 -=--_._30
(D 40 • -50• • ••'•
•
•
• •1 '0 Te:Seamounts-FrenchPolynesia
I
[
• • • •
•
•
l" Te
:seamøants
!
• X • •
•
•l ' me:Trenches
1
I
X X
I I me:
Mid-Oceanic
Ridges
&
Deltas
l
1
• • •
•
•
me:
Fracture
zones
70 . , . , . , . , . , . , . , . , . , . 0 20 40 60 80 100 120 140 160 180 200
t (age)[m.y.]
lO 2o 40 (D 50 60 7OFigure 1. Compilation of observed elastic thickness (Te) against age of the oceanic lithosphere at the time of loading. The isotherms are calculated from a plate cooling model with an equilibrium thermal thickness of 125 km (appendix) [Parsons and Sclater, 1977]. Data sources: as given by Deplus [1987], Smith et el. [1989], and Watts, [1992]. Additional points are taken from Calmant and Cazenave [1986], Weseel and Haxby [1990], Judge and McNutt [1991], Weseel [1993], and Filmer at el. [1993].
BUROV AND DIAMENT: ELASTIC THICKNESS OF THE CONTINENTAL LITHOSPHE• 3907
ture of the European continental lithosphere: Constraints from rheological profiles and EET estimates, submitted to: Geophys. J. Int., 1994]. Finally, the notion of Te is linked to the assumptions of small plate deflections, thin plate approximation, and cylindri- cal bending [Turcotte and Schubert, 1982]. These assumptions are not always completely satisfied in studies on modeling of the lithospheric flexure, which may result in inaccurate solutions for the plate deflection and, consequently, in overestimates or under- estimates of Te. To summarize, we would assume that 25% un- certainty is a quite realistic estimate for the accuracy of most data
on T e.
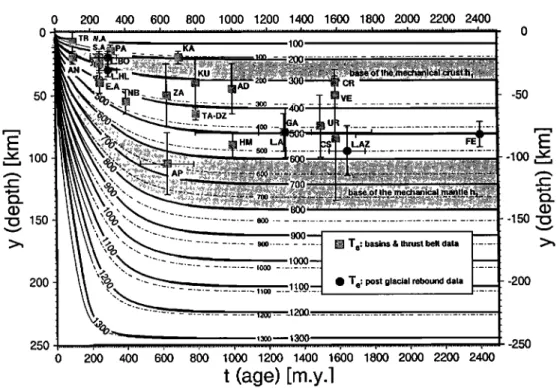
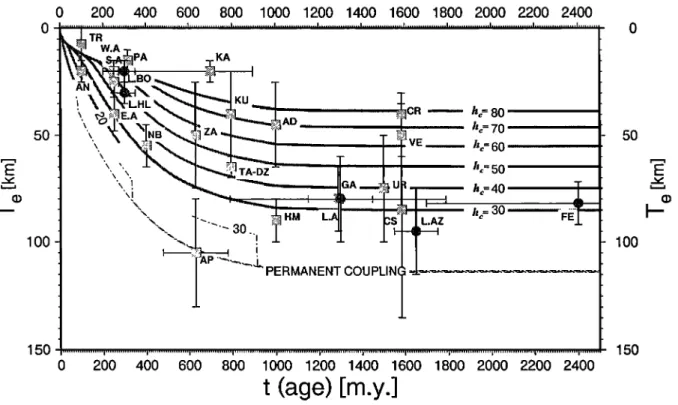
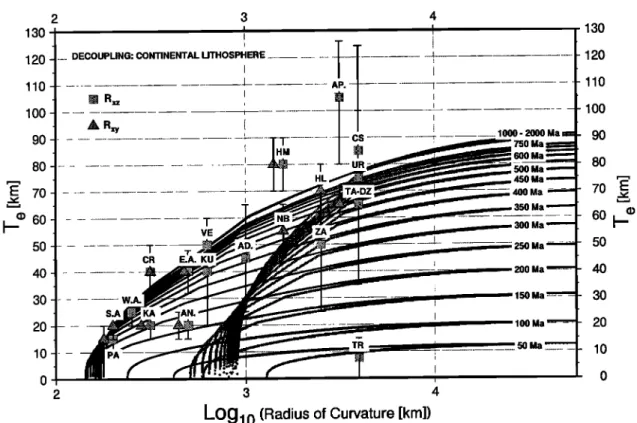
In contrast to oceanic regions, the concept of age/temperature dependence of Te is only crudely applicable to continental litho- sphere (Figure 2) [e.g., Karner et al., 1983]. Although it is clear that the strength of the continental lithosphere is somehow cont- rolled by its thermal state [e.g., Sahagian and Holland, 1993], many authors have shown that Te in the continents cannot be de- scribed by a relationship with a single parameter like age/temperature [e.g., Cochran, 1980; McNutt et al., 1988;
McNutt, 1990; Banda and Cloetingh, 1992; Watts, 1992; Kruse and Royden, 1994]. It appears that Te also depends on distribu- tion of loads, dip angle, and curvature of the plate. Te in the con- tinents has a wide range of values (5-110 km, Figure 2) having a "bimodal" distribution with a primary peak at 10-30 km and a secondary one at 70-90 km [Watts, 1992]. In addition, the values of Te may exhibit large spatial variations within the same plate [Lyon-Caen et al., 1985; Watts, 1988; Ebinger et al., 1989; Bechtel et al., 1990; Y.H. Poudjom-Djomani, J.M. Nnange, M. Diament, C.J. Ebinger and J.D. Fairhead, Effective elastic thick-
ness and crustal thickness variations in the West-Central Africa
inferred from gravity data, submitted to Journal Geophysical Re- search, 1994]. All this naturally has led to doubts about the sig- nificance of continental Te estimates, regardless of the specifical technique used for its determination: spectral methods (admittance, coherence) or more reliable forward modeling.
The notion of effective elastic thickness also meets problems in comparisons with the data from rock mechanical observations which indicate that on geological time and deformation scales the
0 200 400 600 800 1000 1200 1400 1600 1800 2000 2200 2400 ß •"•:::::'"'1'• S.A..•pA _KA '
t[[XXXk
...
... ...
t li•X•kX
'• •
:•.•--T-._
•:•:•:
:-•
.•.. • •
s':•
• •.
•z
'*'•:•:•::.:::.: :::::::::::::::::::::::::::::::::::::::::::::::::::::::: ... ' ... :• .... 5•-- -•, ...oo/t[XX55x-
...
...
-oo
• •lX•Wfo'-.x ... ' ... :::::::::::::::::::::::::::::::::::::::2oo
4 X[ '% '""--•
,,oo2 • T,:
•o,,
•,•,•,,,•oun•
•,• •
-200
250 -250
0 200 400 600 800 1000 1200 1400 1600 1800 2000 2200 2400
t (age)[m.y.]
Figure 2. Compilation of observed elastic thickness (Te) against age of the continental lithosphere at the time of loading and the therural model of the continental lithosphere (equilibrium thermal thickness of 250 km (appendix). The dashed lines are isothenns for a pure cooling model; the solid lines are those for additional ra- diogenic heat generation in the crust. Solid squares are estimates of Te in collision zones (foreland basins, thrust belts); solid circles correspond to postglacial rebound data. Isotherms 250øC-300øC mark the base of the mechani- cally strong upper crust (quartz). The isotherms 700øC -750øC mark the base of the competent mantle (olivine). Note that there is no significant changes in the thermal structure of the lithosphere after-750 Ma, though there are significant reductions in Te even for these ages. The notations for foreland basins/mountain thrust belts data are E.A, Eastern Alps; W.A., Western Alps; AD, Andes (Sub Andean); AN, Aperefines; AP, Appalachians; CR, Carpathians; CS, Caucuses; DZ, Dzungarian Basin; HM, Himalaya; GA, Ganges; KA, Kazakh shield (North Tien Shan); KU, Kunlun (South Tarim); NB, North Baikal (the North Baikal is believed to represent a "broken" rift currently dominated by flexural defom•ations [Burov et al., 1994]); TA, Central and North Tarim; PA, Pamir; TR, Transverse Ranges; UR, Urals; VE, Verkhoyansk; ZA, Zagros. Abbrevitions for postglacial rebound data are L.A., Lake Algonquin; FE, Fennoscandia; L.AZ, Lake Agassiz; L.BO, Lake Bonneville; L.HL, Lake Hamilton. Data sources are CS, UR (from the side of the Russian plate), Stald•ovskaya and Kogan [ 1993]; S.A., AN., CR., HM., Royden [1993] and Kruse and Royden [1994]; NB, Burov et al. [1994]; KA, TA, PA, Burov et al. [1990] and Burov and Diament [ 1992]; KU, GA, AD, TA, Lyon-Caen and Mob•ar [ 1983], Lyon-Caen and Mob•ar [ 1984], and Lyon-Caen et al. [1985]; W.A, E.A., AP, GA, Karner and Watts, [1983]; TR, Sheffels and McNutt, [1986]; VE, McNutt et al. [1988]. DZ, Benedetti [1993]; FE, ^10rner [1990]. Other data sources (ZA, L.A., L.AZ, L.BO, L.HL) are as given by Watts [1992].
3908 BUROV AND DIAMENT: ELASTIC THICKNESS OF THE CONTINENTAL Lrl'HOSPHERE
lithospheric rocks cannot behave completely elastically. Goetze and Evans [1979] have shown that one needs to consider empiri- cal rock mechanics data describing the temperature, pressure, and deviatoric stress-strain rate relations of lithospheric rocks (brittle and ductile failure) to explain observed deviatoric stress
distributions. The data on stresses and strains in collisional belts
require that the modeling approach takes into account ex- perimental studies on brittle and ductile behavior of lithospheric rocks, because the elastic plate models predict stresses suffi- ciently high to lead to inelastic behavior, and provide poor repre- sentations of the distribution of the seismicity with depth [Goetze and Evans, 1979; Lyon-Caen and Molnar, 1983; Burov and Diament, 1992]. It is evident that there is a dependence between
Te and at least (1) composition and geometry of the plate, (2) external forces, and (3) thermal structure [e.g., McNutt and Menard, 1982]. McAdoo et al. [1985] considered these ideas and developed a three-layer (brittle-elastic-ductile) numerical model for the flexure of the oceanic lithosphere and examined the rela- tionship between plate strength, age, and bending moments. Ranalli [1994] also made analytical estimates for dependence between plate strength and plate curvature for continental litho- sphere with coupled ("oceanic type") work-hardening rheology. The continental lithosphere shows a more complex rheological stratification than the ocean floors, partly because of its thicker crust, its longer history, and its modification by surficial process- es (e.g., erosion, sedimentation and orogenesis). To represent flexure of the continental lithosphere, Burov and Diament [1992] have developed a numerical model of bending of a plate with multilayered nonlinear brittle-elasto-ductile rheology that pre- dicts geometry of areas of ductile and brittle failure and the dis- tribution of extensional and compressional stresses. They also
showed that the dimensions of inelastic zones in the flexed con-
tinental lithosphere may exceed the dimensions of the areas that remain quasi-elastic.
Despite the fact that there are serious problems with the in- terpretation of the effective elastic thickness in continents, T e is a useful easy-to-estimate parameter that provides important infor- mation on the mechanical and thermal state of the lithosphere. However, its understanding requires thorough revision and quantitative interpretation in terms of lithospheric rheology and structure. The general purpose of this paper is an attempt to give such interpretation of behavior and distributions of Te in conti- nents and to provide an easily reproducible numerical approach relating continental and oceanic Te to lithospheric rheology, re- gional tectonic setting, and thermal structure. This provides a feedback between the "observed" Te and rheology, allowing us to put constraints on the lithospheric structure from estimates of Te.
Mechanical Properties of the Lithosphere and
Major Deviations From Elasticity
The major contradiction between the assumption of a linear elastic rheology and what we know about properties of the rocks is that the elasticity assumes no dependence between strain rates, stresses, and time. This assumption implies that rock properties are independent of stress and strain (that is linear increase of stress with increase of strain, which results in large or overesti- mated tectonic stresses typically predicted by elastic models [e.g., Goetze and Evans, 1979; Lyon-Caen and Molnar, 1983]).
Mechanical Properties of the Rocks' Experimental Data
The finite strain properties of the lithosphere and underlying asthenosphere can be described by empirical constitutive rela- tions that express the yield stress limits of the dominant litholo- gies within the continental and oceanic lithosphere, as functions
of strain rate, temperature, pressure, and activation energy [Goetze, 1978; Brace and Kohlstedt, 1980; Kirby, 1983; Kirby and Kronenberg, 1987; Ranalli and Murphy, 1987]. The domi- nant lithologies for the continental lithosphere are basically quartz (upper crust), diabase, quartz-diorite, plagioclase (lower crust), and olivine (mantle). Although most of experimental constitutive relations are established for minerals (like quartz and olivine), it is believed that the behaviour of rocks is con- trolled by the properties of the weakest among the dominant minerals [e.g., Brace and Kohlstedt, 1980]. Combining rheologi- cal layers (yield-stress envelope, YSE), one can examine the competence of depth horizons within the lithosphere for a given deviatoric stress. The rocks may deform quasi-elastically if the deviatoric stresses are below the yielding limits, otherwise they fail either by brittle sliding or by ductile creep flow. Thus the upper areas of the crust and mantle are controlled by predomi- nantly brittle (effectively plastic) failure, commonly associated with seismic activity [Mareschal and Gangi, 1977; Mareschal and Kuang, 1986; Talwani and Rajendran, 1991; Long and Zelt, 1991 ]. The deeper, hotter lithosphere is controlled by tempera- ture-activated creep. The intermediate levels, where the yielding limits are not exceeded, can be considered as elastic. The major difference between the crustal and upper mantle rocks is that the ductile flow of the crustal rocks (e.g., quartzites, granites) occurs at much lower temperatures than those of olivine. This suggests that the crust may flow under much lower stresses than the man-
tle.
In a generalized form the relationship between strain rate and stress in a point with Cartesian coordinate x, y, z in time t is given by
g(x,y,z,t) = A(x,y,z,t)o(x,y,z,t) n
or
gij(x,y,z,t)
=A(x,y,z,t)o(x,y,z,t)
n-• (x,y,z,t) (la)
O'ij• ' • •'2 • ' '
where
• =(•ij•ij,,
and
c• = (y•c•jc•ij)•
are
the effective
strain
rate and effective stress (second invariants). The variables n(stress exponent) and A (constitutive parameter) describe properties of a specific material.
The ductile behaviour of most lithospheric minerals can be
described
by (la) with A = A*a-mexp(-H*/RT)
and n=3-5,
where
A* is a material
constant,
a is the
mineral
grain
size,
m is
established
experimentally.
H* is the activation
entalphy,
R=1.986
cal (mol K) -• is the gas
constant,
and T is the tempera-
ture (in Kelvin) [Kirby and Kronenberg, 1987; Ranalli and Murphy, 1987; Mackwell et al., 1990]. For two-dimensional case (e.g., plate approximation), the following Arrhenius relation holds for ductile creep:
• = (A*a-m)exp(_H*/RT)
(•, -•3) n
or
(•-•3) = (i (A*)-•
am)¾nexp(H*/nRT)
(lb)where
(ol -o3)= oa is the deviatoric
yielding
stress,
defined
as
the difference between the maximum and minimum principal stresses ol, •3. Equation (lb) is valid for both major creep mechanisms, diffusion of atoms through the crystal grains, and migration of dislocations of the crystalline structure. The first mechanism depends on the grain size, the second one depends on the crystalline structure of the material. The diffusion creep (rn• 0) is important only for very low stresses, strain rates and small grain sizes, otherwise the dislocation creep (rn=0; a-re=l) domi- nates [Turcotte and Schubert, 1982; Ruttler and Brodie, 1988;
BUROV AND DIAMENT: ELASTIC THICKNESS OF THE CONTINENTAL LrFItOSP•• 3909
Hopper and Buck, 1993]. The estimated lithospheric conditions mostly fall in the dislocation creep field [e.g., Kusznir and Park,
1987; Kusznir, 1991 ], and therefore we do not consider the dif- fusion creep in this study.
The ratio of the stress to strain rate gives a basic effective
non-Newtonian
viscosity:
lie//.
=oa/2g. For rheologically
sig-
nificant strain rates of 10 '17 •-10 '14 s '1 a critical temperature of around 250ø-300øC must be exceeded for ductile flow of quartz,whereas for olivine it should be 600ø-700øC [Brace and
Kohlstedt, 1980; Tsenn and Carter, 1987; Kusznir and Park,
1987]. The strong temperature control on the ductile rheology thus requires a knowledge of the thermal structure of the plate. In the appendix we obtain an estimate of the depth(y)-time(t)- temperature(T) distribution for the half-space cooling model, constrained by heat flow and xenolith data, and accounting for radiogenic heat generation in the crust and viscous frictional heating at the crust-mantle boundary.
In steady state deformation the strain rate should be in balance with the imposed flow stress. If the imposed stress is lower than the steady state ductile strength, almost no ductile deformation will occur and the effective viscosity and the stress relaxation time will be very high. In this case the material can be consider- ed as elastic. Similar conditions apply when the imposed stress does not reach the brittle (plastic) strength.
In this paper we adopt the following material constants for the
creep
law
(dry
_,minerals).
Quartzite: A =5x10'12pa 'n s '1, H'=190 kJ mol '•, n =3 [Brace
and Kohlstedt,
1980]; quartz-diorite:
A'=5.01
x 10
'15 Pa-" s
'l,
H'=212 kJ mol
'1, n =2.4 [Carter and Tsenn,
1987]; diabase:
A'=6.31x10
'2ø Pa
'n s
'1, H'=276 kJ mol
'1, n =3.05 [Carter
and
Tsenn, 1987]; olivine/dunite (dislocation climb, o 1 -03 _<200
MPa ): A'=7x10
'14
Pa'" s'1; H'=520 kJ mol'l; n=3 [e.g.,
Kirby
and Kronenberg, 1987]; olivine (Dorn's dislocation glide, o 1 - 03 > 200 MPa):
• =/;0exp[-H'(1-(%-o3)/o0)
2/RT]
where
•;0=5.7x10•s
-•,
o0=8.5x10³
MPa;
H*=535
kJ mo1-1
[Carter
and
Tsenn,
1987].
For the basic
strain
rate we adopt
the value
of 3x10
-•5 s
-• that
is found to be most representative in the continental areas [e.g., Molnar and Tapponnier, 1981; Molnar and Deng Qidong, 1984]. In the real Earth the stress-strain dependence always has characteristic timescales. Thus both plastic and elastic rheolo- gies are rather physical assumptions, because neither plastic nor elastic rheology assumes time dependence between stress and
strain. Nevertheless, brittle behavior of materials can be modeled
as quasi-plastic by assuming that n --> oo whilst the strain rate g remains finite. To describe transition to the plastic regime of de- formation, one can use, for example, the Von Mises criterion of plastic yielding:
2(2Y•
=((2Y
1 --02)
2 +(01
--03)
2 +(02 --03)
2
(2a)
where ol,o2,o 3 are principal stresses and 00 is yielding stress. Conditions of brittle failure in a 2-D case are similar to (2a) [Byerlee, 1978]:
G3 =(GI-c•3)/3.9 if •3 <120 MPa;
(2b)
c•
3 = (c•
1 -c•3)/2.1-100 if c•
3 > 120 MPa
where
(01 -03)- o b is the differential
yielding
stress.
The brit-
tle strength is to a first approximation insensitive to temperature and is mainly pressure-controlled. Byeflee [1978] also found that initiation of slip on precut rock faces is not sensitive to rock type. The elastic, or quasi-elastic behavior can be modeled by as- suming infinite strain rate at finite value of stress:
elk = E-l(( 1 + v)c•ik
-VC•llbik)
c•ik
= E(1 + v)-l(eik + v(1- 2v)-lgllbik)
(3a) (3b)
Typical values for E (Young's modulus) and v (Poissons's ratio) are 6.5-8x101ø N/m 2 and 0.25 respectively [e.g., Watts, 1978; Turcotte and Schubert, 1982]. In terms of principal stresses Ol, 02, 03, (3b) can be written as:
øj=E(l+v)-løj
+Ev((1
+ vX1-2v))-l(gl
+g2
+•13)
=
2lioj + •,(•1
+•2 +•3),
wherej=l, 2, 3 and •, and li are Lam•'s constants.
The Yield-Stress Envelope (YSE) and Uncertainties on Its Parameters
Combining rheological laws (1), (2b), and (3b) one can form piecewise continuous yield-stress envelope (YSE) [Goetze and Evans, 1979, Figure 3]. The ¾SE can be defined as a contour
o f = of(x,y,t,g) such
that
sign(e)min(l*
I) (4)
where ob(x,y,t,g,sign(e)),
oa(x,y,t,g) are the "brittle" and
"ductile" yielding limits from (1) and (2b), y is downward posi- tive. Due to asymmetry of the Byerlee's law (2b), the absolute value of the yield stress depends on the mode of deformation: for extension sign(e)=l; for compression sign(g)=-l. The differen- tial stress o(•) for the strain • - e(x,y,t,•) can be defined as:
c•
(e): sign(e)min(Ic•
I,l• <•>l>
(5)where oe(a) is the elastic differential stress, defined accordingly to (3b). Equation (5) means that the lithosphere material behaves elastically if the imposed stress does not exceed the yield strength. The elastic "core" of the lithosphere can be interpreted as the depth interval where neither ductile creep nor brittle
failure alter the stress.
The YSE allows one to locate competent zones within the lithosphere and zones of ductile or brittle failure for a given local gradient of deviatoric stresses. It also allows a definition of the
integrated
lithospheric
strength
(B) as simply
the integral
of o f
over depth [e.g., Hopper and Buck, 1993]:
B= Jof (x,y,t,g)dy
(6)
0
For an elastic plate the notion of the integrated strength is quite close to that of the flexural rigidity (D), defined in the next
section.
Naturally, the experimental rheological laws used to define the YSE bear some uncertainties in their parameters. We now
discuss the effect of these uncertainties.
Variations in the mineral composition: Wet/dry theology,
porous fluids. As one can see from Figure 3a, the assumed dif- ference in the mechanical properties of the upper crust, lower crust, and the mantle may lead to an appearance of weak zone(s) in the lower crust that permits mechanical decoupling of the up- per crust from the mantle by ductile flow in the weak zone [e.g., Chen and Molnar, 1983; Zoback et al., 1985; Lobkovsky, 1988; Bird, 1991; Lobkovsky and Kerchman, 1992]. Decoupling can be expected if the ductile strength of the lower crust is controlled by a mineral composition with temperature of creep activation lower than the temperature at the crust-mantle transition (Moho boundary). For most commonly assumed quartz-dominated crust, decoupling should be permanent, except when the crust is very thin (< 20-25 km). For other crustal compositions it probably
3910 BUROV AND DIAMENT: ELASTIC THICKNESS OF THE CONTINENTAL LITHOSPHERE
Ao [MPa]
Ao [MPa]
-2000 -1000 0 1000 2000 -2000 -1000 0 1000 2000
I ... I ... I ... I ... I,, I ... I ... I ... I ... I,,
Oj •
Qu^.•z
|
"
•
Qu^.•z 0
20
DIABASE
L
:
:•:•"""",,',,,'
...
"•?-':?•-:::;i:i.-:i:.;;
"'"'
•:•...•i•.•..•:::•:,•,:•:
"•
,,
.... DIORITE
' 20
....
%..;.,.,
... ...
,.,...::,...:::...
60
...
V,':..,.::.:-
...
"""'
'":'•.,'
-"-'•.
'
'..-:;:J::
"•-':••?
• 100
1
••••
-::m
50
m !-
•ia ',,•i!•t•'•..'*:•
i?'
....
:::•
50
m - 100
•
1
'••.••-.-•
150
aa [
'%-:.
,;•i::i!!•
•
....
.:• 150
aa
120 -1
•-':'}:t
•
.:• 250
aa r-
'""¾;
;?"
:...•
250
aa - 120
1
•
I• 500
aa [
'!•?'
a•! 500
aa '
• 140
1
!
.., 750
Ma
r-
:
• 750
Ma
- 140
•
1
I
.=, lOOO
.a [
I
I
.=, lOOO
.a ß
160-1
!
- 2000Ma
J- -1
J
/ 2000Ma-
160
1 cø""",•ss'ø"
I
,,,,s,o, ,.
•8o 1,,,c,,ø,",,","•s,s.',ø,,",,,J
... ,.,•,.,,slo,..
' ... ,.,r
•8o
o,
...
, ...
7
, ...
i
, o
40:
,.E
40
.,
•-
120 -
-
'•,:•
•r
m 150.,,
:• 250
Ma
m 50.,,
..-.r•
75
Ma - 120
'
•-
• • 500Ma • 100Ma• 140
!
.., 750
Ma
a '•25
",, 140
•
i
! .m
lOOO
Ma
.m
150
Ma
160
!
- 2000
Ma
= 175
Ma
160
oo.,..•ss,o. .,:.,s,o. ,
180 .. ,c,,o,.,,P,R,E.S,S.•,O...,,.
I ... ,T,E.",,
sI,ø'", ,
180
-2000 -1000 0 1000 2000 -2000 -1000 0 1000 2000
bo' [MPa]
bo' [MPa]
Figure 3a
Figure 3. Yield-strength envelopes (YSEs) for different thermal ages, strain rates and crustal compositions.
Crustal
thickness
hc--35
kin. (a) Dependence
of the yield strength
on age.
Numbers
1, 2, and 3 correspond
to
continental lithosphere with different compositions of the lower crust: 1, high-temperature of creep activation (diabase); 2, low temperature of creep activation (quartzites, granites); 3, intermediate temperature of creep acti- vation (quartz-diorite). Number 4 corresponds to the oceanic lithosphere. The upper parts of the YSEs are formed
by the brittle
yielding
limits,
the lower
ones
by the ductile
creep
yielding
limits.
Note that the crust
is practically
always
detached
from
the mantle
for a young
continental
lithosphere
(age
< 250 Ma). For the old lithosphere
(age
> 750 Ma) the crust
may
be coupled
with the mantle.
(b) Stress
distributions
for different
gradients
of bending
stress
and strain
rates
(500 Ma lithosphere).
(Left) Concave
downward
bending
(compression
at the surface);
(Right) concave upward bending (extension at the surface). The light grey area is the deviatoric stress for a mode- rate plate curvature; the darker grey area is that for the high curvature. Note the trend of the position of the neutral
planes
with increase
of the stress
gradient
(light vertical
arrows).
The shape
of the plate
(exaggerated)
is shown
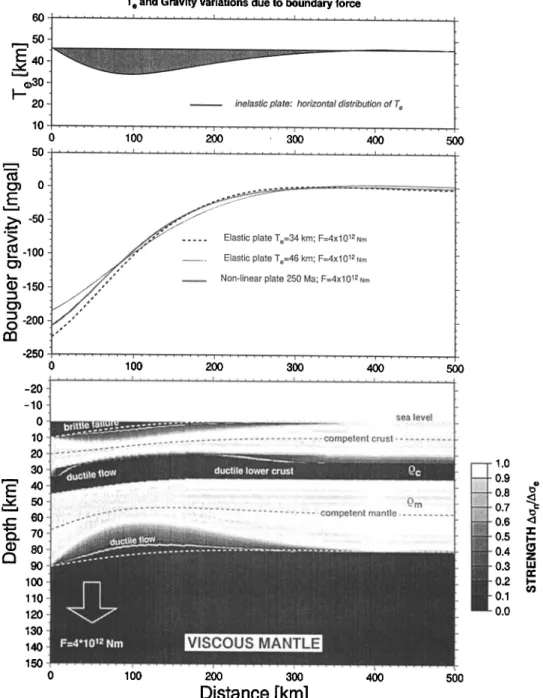
with thick-dashed curves. Thin-dashed curves correspond to strain rates from 10 -13 to 10 -17 s '1. Where the elastic bending stress reaches the yielding limits, the material becomes ductile or brittle. Even low flexural stress is enough to detach the crust from the mantle by creep at the crust-mantle boundary. At a higher flexure large portion of the lithosphere becomes inelastic. For nonzero topography load the surface strength is determined by the over- burden lithostatic pressure. (c) Same as Figure 3b but constant extensional horizontal force (horizontal stress of 200 MPa) is added. Dark grey area is the stress distribution in the plate subjected to the horizontal extensional
force
only.
Light
grey
area
is the stress
after
additional
moderate
bending.
Note
the change
in the geometry
of the
brittle, elastic and ductile areas, and shift of the neutral planes. The compressional force would have a reversed effect, note also that the brittle areas are much stronger for compression than for tension.
BUROV AND DIAMENT: ELASTIC THICKNESS OF THE CONTINENTAL LITHOSPHERE 3911
Ao [MPa]
-2000 -1500 -1000 -500 0 500 1000 1500 2000 20 - 20...
...- "
... 10
100
QUARTZ
. 0
10 . 10 20 .• DIORITE . 20 30 .... :-&':-" 2 . 3040
50,
t
8o
-, ,, •'•, :=•:::, , ß 110 ', ,, ,, :•;•:',' , . 110120 COMPRESSION TEN S•ON 120
130 130 140 .... , ... 140 150 ,,,,, ,, 150 -2000 -1500 -1000 -500 0 500 1000 1500 2000
Ao [MPa]
-2000 -1500 -1000 -500 0 500 1000 1500 2000 ' - OLIVINE ', :, :• ::;•'•, .. -•::•::•: ... . - , , '•. '•....i:-'"'•'"' !" :.' '_;,'t .•',' •',' ,''","-,'
'• ".'"
..
::::.
',,", . ,,,,• . 11oESS
N
i
i '
",
?11!'i•il;:,'?,
-
' TENSION
120 COMPRI
130
l
'" '
140150 ... •
, . . . .
-2000 -1500 -1000 -500 0 20 DIORITE 30 ... ?•i•i•:•:.•:•:.-. ... . .... 40 ::,:•,,.. : (- 60 • 70 CD 80 90 20 10 0 . lO ß 20 ß 30 .40
- 50 - 60 (-- - 70 Q. . 80 (D90 ("h
. lOO . 11o . 120 . 130 . 140 150 500 1000 1500 2000 Figure 3bAo [MPa]
-2000 -1500 -1000 -500 0 500 1000 1500 2000 10 0-10
.... '"'"'•("•:)'
QUARTZ
• -'% ... .•,:L. ~ .•,. ;- .• ..':'... ;.:../:.• :..'"• .. -" -20 ß •;:•:•;•;•.:.•::•<•::•:.•;:`•:•;:•.:•::•:•:•:.:•..•:•::•::•:::;.•;•:•.• . DIORITE •;.Fj:.: .'.----:.... -- ...:.: .--: :.::.•::::•?;i•}•::•}•. •-.-. ... .:: ....-40 • •..•..•
...
.:::
::•
::•::•::
•:•g•{
.:.-...•::.•:..•,•.•:•**...
-50 ,,,,,..•:.?::•.:•...;• .... ..:,..::..::::•. ... :•: .:.:::. % :•:•:. :•.:;½• :•:•:.; ..•--60
,,,,
-70 "'-80
".'
100 ', -120 <- COMPRESSION -130-150.
-2000 -1500 -1000 -500 2O 10 o -10 -20 -30-40 •
-50._•. -60 (-- -70 •.. -80 (D_9o
•
-lOO -11o ß -120 -130 -140 -150 0 500 1000 1500 2000Ao [MPa]
-2000 -1500 -1000 -500 0 500 1000 1500 200020
10....
•
....
' ....
''.i-'j'''•
...
20 ... --'fZ'*';;'•'•.i:•,•}'7'•'•'•'¾•;:"?:
iii
•}•'½
DIORITE
30 ,• '•
40 •,
• •'"':::
... :
•?•
•.•:;•:•:•:•?•?:::•:'"
'"'-.
5o
...
...
60 ,,,, •:•.:•:.•:.:•:•::•.. .... :: .•:•?• •?::..:..: . ... :½:..•...•., 8o ":'"•'"?•¾• ... •;:'::?:•::'•:• ":, :.-:'::'"•;5:•'•, ' ,, ,, •',-.;•::•'½%•.:... :.??•. ?•/• ;.:.:.:;•½::•::?', :, ,- 0 ', ', ===================== :;•:•",' - '20
<-
CO..R•SS•O.
"?•:•5-' ZE.S•O.-.
-2000 -1500 -1000 -500 2O 10 o lO 2o 3o40 •=
50 60 c- 70 Q. ß 80 (D90 •
. lOO . 11o . 120 ß 130 ß 140 150 0 500 1000 1500 2000 Figure 3ctakes place in most cases, except for very old cold lithosphere (> 750 Ma). The differences in the mechanical properties of the crust and mantle are related to variations in the nfineral compo- sition (e.g., quartz, diabase or quartz-diorite, Figure 3a), presen- ce of fluids (wet/dry rheology), porosity, and so on. Other inde- pendent data provide additional constraints on the choice of rheology. These data include seismicity distributions associated with brittle failure [Meissner and Tapponnier, 1982; Cho• and Molnar, 1983; Cloetingh and Banda, 1992; Govers et al., 1992; DdvercMre et aL, 1993]; anomalies of seisnfic velocity, reflec- tivity and attenuation supposedly associated with ductile zones [e.g., Kusznir and Matthews, 1988; Irevet, 1989], petrology data [Cloetingh and Banda, 1992], and data from nmgnetotelluric soundings (indicators of the presence of melts and fluids [Berdichevsky et al., 1982; M. N. Berdichevsky, personal com- munication, 1994], etc. Here we also show that Te estimates, thermotectonic age, plate curvature, and Moho depth can be used
to constrain the rheology. The possibility of crust-mantle decoupling suggests the presence of flow in the weak lower crest with associated effects like dissipative heating [Lobkovs•,, 1988; Kruse et al., 1991; Lobkovsky and Kerchman, 1992; Burov et al.,
19931.
Age (temperature) and activation energy. The lithosphere strengthens when it gets colder with age (Figure 3a), as well as when it is deformed with higher strain rates (Figure 3b). Howev- er, there is no direct relationship between the depth-temperature
(y-T, or better
to say,
y-H*/RT) distribution
and
the geological
age of the lithosphere at time of loading. Indeed, plates may un- dergo thermal resettings that completely change their actual thermal state (e.g., Kazakh shield [Burov et aL, 1990], Adriatic lithosphere [Kruse and Royden, 1994]). After some time (>750- 1000 Ma or cvcn> 400 Ma, Figure 2) the temperature distribu- tion in the lithosphere approaches a stationary state and practi- cally does not evaluate anymore.
3912 BUROV AND DIAMENT: ELASTIC THIC•SS OF THE CONTINENTAL LITHOSPI••
We use the term "thermal age" (see appendix) to discriminate from the true geological age. The thermal age (t) controls the depth to a specific geotherm obtained from the plate cooling model assuming that the lithosphere did not undergo thermal re- settings during this time (appendix, Figure 2). Therefore the thermal age gives the age of the last large-scale thermal event. In the absence of such events it coincides with the geological age (e.g., Siberian eraton, Tarim basin). The thermal age allows us to specify lithospheric geotherm, and it also provides a lower bound on the true age of the lithosphere. Use of the surface heat flux in
continental domains is less convenient because there it is too
"polluted" by upper crustal heat generation and superficial ther- mal effects due to erosion and sedimentation. Therefore it mainly reflects crustal processes and should not be used to infer directly the subcrustal geotherm [England and Richardson, 1980].
However the surface heat flux is still useful to constrain the
crustal geotherm [Jaupart, 1983].
The base of the mechanical lithosphere in continents is re- ferred to the depth at which the yielding stress is less than 10-20 MPa, that is the depth to the isotherm 700ø-•750øC [McNutt et al., 1988]. The depth to this geotherm is defined from the ther- mal model of the lithosphere (see appendix), and can be addi- tionally constrained from the heat flux data, seismic data and from inversion of the middle- and long-wavelength magnetic anomalies (this allows to define the depth to Curie's temperature 600øC [Achache et al., 1994]). However, we avoid prescribing
some fixed values for the minimum sensitive deviatoric stress
but make it dependent on the lithostatic pressure, for example. We thus prefer to define the depth to the mechanical base of the lithosphere as the depth where the yielding stress becomes neg- ligible compared to the lithostatic pressure (1-5% of the li- thostatic pressure at the depth to the isotherm 700ø-800øC). It is also sensible to relate the base of the mechanical lithosphere to some minimum sensitive value of the vertical gradient of yield- ing stress (say, 10-15 MP•). If the uncertainties in age/temperature are about 10-20%, the uncertainties in determi- nation of the depth to the mechanical base of the mantle litho- sphere will be only about 5-10% (Figure 3a). The same applies to the base of the mechanical crust (isotherm 300ø-400øC for quartzites). Note also (equation (lb)), that the yield stress is pro- portional to the 1/n power of the strain rate divided by the mate-
rial constant
and
exp(-H*/RT).
Keeping
in mind
that
n is -3, this
means that the uncertainty in the determination of the stress is roughly proportional to the cubic root from the uncertainties in
A*, • , and exp(-H*/RT).
Thus 10-20%
uncertainty
in the above
parameters will lead to only few percent uncertainty is the stress. Strain rate. Figure 3b shows dependence of the YSE on the strain rate. The basic strain rates are typically known within the accuracy of 1 order. As seen from Figure 3b, such uncertainty in estimation of the strain rate will change the yielding limits by no
more than 10%. Three orders of variation of the strain rate will
result in only 1 order of variation of the yielding stress for dislo- cation creep [e.g., Hopper and Buck, 1993].
Mechanical Model for Nonlinear Flexure
Deformation of an inelastic medium (plastic, viscous-elastic)
can be described as deformation of an elastic medium with time-
space variable elastic properties. This approach, known as the method of elastic solutions, is commonly used in applied me- chanics [e.g., Alexandrov and Potapov, 1990]. Deflection of an inelastic (brittle-elasto-ductile) plate can be modeled as deflec- tion of some equivalent elastic plate with space-variable Te. However, such effective Te, valid only for the instantaneous, or static plate geometry, may yield only correct strains but not nece- ssarily stresses, and it will vary with changes in the plate geome- try or in the distribution of loads.
Plate Equilibrium Equations in Rheology Independent Form
In a most general case a summary force applied to a volume V
of a deforming
body
is • FdV,
where
F is a force
acting
on
a unit
volume.
Each
of the
three
components
of the
force
• FfiV can
be
expressed
as J F•dV
= J oo'a,/Oxk
dV, where
c•a is a stress
tensor.
Correspondingly,
the
moment
of force
F is [Fr], where
r is the
radius-vector defined by the coordinates x• of a point to which the force is applied. The moment of all forces acting on the volume dV is [Landau and Liferitz, 1987]:
Mik
= I(F•xk
- F•x
i)dV
= J x•
- bxt
x
i dV (7)
This basic expression is rheology independent and thereby is valid for elastic and inelastic rheology. Assuming a Cartesian xyz coordinate system, let plane xz be horizontal, axis x be directed to the right, and y be downward positive. In the case of flexure of a plate, the vertical deflection of the plate depends only on two coordinates, x and z in our case. Most models of lithospheric flexure use cylindrical (plain strain) bending assuming that the plate is infinite in one direction [e.g., Watts and Talwani, 1974; Forsyth, 1980; McNutt, 1980; Lyon-Caen and Mobtar, 1983; Sheffels and McNutt, 1986; Watts, 1988; Judge and McNutt, 1991 ]. Let the plate be infinite in the z direction, then the strain component %z along the axis z, normal to xy plane, is zero (%• = 0). In this case the bending moment M=Mx, horizontal (longitudinal) force component Tx and vertical (shearing) force component Fx per unit width of the plate is expressed as follows:
Mx =
dy =-
(.v- y.) dy
o oT
x =-J•xt dy = - o'xr
dy
o oFx = - J*xy
0dY
= - J*xy
0dy =•
r3x (8)where y, is the depth to the neutral plane of the plate (single neutral plane is assumed in (8)). The upper limit h 2 corresponds to the depth at which the longitudinal stress c• and shear stress
c•xy
become
negligible: lim (c•,•/p,
y--}h 2
c•v/p)=O,
where
p is lithostatic
pressure.
Thus
in a general
case
the value of h 2 is equivalent to the depth at which lithospheric materials become so weak that they can only support negligibly low deviatoric stresses (stress of <10-20 MPa is commonly used as a sensitivity limit [Ranalii, 1994]). Thus, according to our definition, h 2 is the depth to the base of the mechanical litho- sphere.
The equation of static equilibrium of a thin plate [Timoshenko and Woinowsky-Krieger, 1959], derived from (8) is rheology in- dependent and thus holds for elastic, plastic, viscous, ductile or mixed rheology:
bx
2 + T•--ffx
+p_=p+
(9)
where w=w(x) is the vertical deflection of the plate, p_ is the buoyancy restoring force per unit area
h2+w(x) •+w(x)
BUROV AND DIAMENT: ELASTIC THICKNESS OF THE CONTINENTAL LITHOSPHE• 3913
pm(x,y) and p½(x,y) are the respective densities of the mantle and
crustal
material
(Pm=3330
kg/m
3 and pc=2670
kg/m
3 are their
typically inferred average values), g is the acceleration due to gravity, he is the thickness of the crust. The additional vertical force p+ is defined as the sum of topographic loads and effective vertical forces fa(x) associated with plate-boundary forces. These forces result from plate collision, interaction with the con- vecting mantle, buffed loads, and sediments. Thus
-h
p+ = g JPs(x,y)dy+
fa(x),
o
where h=h(x) is the topography elevations (negative above the sea level) and ps(x,y) is the density of the material above the
reference sea level.
The above equilibrium equations are valid within certain limits imposed by geometrical simplifications made for their derivation. These simplifications are thin plate approximation, the assumption of cylindrical bending, and the assumption of small plate deflections. The thin plate approximation neglects the effect of bending of normal and sheafing stresses. Thus it holds only when the thickness of the plate is much less than its length,
and essentially
less than the radius
of the plate curvature
R•v
'
The assumption of cylindrical bending implies that plane cross sections of a plate subjected to bending remain plane and normal to the neutral plane. Plate deflection has to be independent of the coordinate z. Finally, plate deflection has to be small compared to the thickness of the plate (all points of the neutral plane(s) displace only in the direction of the vertical (y) axis.)
At a first glance, the assumption of cylindrical bending might be a crude approximation for the continental lithosphere. Howe- ver, the radius of curvature of the arc front (Rx:) of most conti- nental thrust belts is much larger than the maximum possible values of h 2 (h 2 < 130-140 km, Figure 2, whereas Rxz > 350 •krn [McNutt et al., 1988; Ranalli, 1994]). This allows us to neglect plate bending in the plane of the surface of the Earth (xz plane) when predominant bending in the vertical (xy) plane occurs. Anyway, we have to keep in mind, that the values of Rxz bound
the radius of plate curvature
in the vertical plane (R•)
[Timoshenko and Woinowsky-Krieger, 1959]. This also applies to the radius of plate curvature in yz plane, which should be greater than Rxz and h 2 as well. All available direct estimates of Te (Figure 2) are obtained within these assumptions. Therefore we can use them to test the compatibility of our theoretically pre- dicted values of T e with the direct estimates.
Dependence on Rheology in Plate Equilibrium Equations The dependence of plate equilibrium equations on theology "plugs in" only at the stage when one has to specify the functions Mx and Tx in (9). Indeed, this requires us to define the material- dependent relationships between the internal stress components
((•, C•xy,
(•yy)
and
the strain
components
(•x•, •v, •3y)
(see
the
previous section).
Pure elastic theology: Single layer plate. The elastic plate
approximation
assumes
c• = c•
e = gx•E(1
- v 2)-• where,
for a
single-layer
plate,
gx•
= E-l(c•x•
- VC•yy)
•
(y-re/2)O2w(x)/Ox
2 . Assuming
single
layer
elastic
model
for
the lithosphere, one has to expect that h2 strictly correlates with the effective elastic thickness Te. However, as shown in Figure 2, this holds only for a few cases. Indeed, in terms of the elastic plate approximation it is difficult to provide a physically consis- tent interpretation for h2, since the deviatoric stresses 6e in the elastic plate monotonically grow with distance from the neutral plane, reaching maximum absolute levels at the upper (y=0) and bottom (y=Te) surfaces of the plate:
where
¾ -- Oo•,(x,y)/Oy
• E(1-v2)-•O2w(x)/Ox
2 is the vertical
gradient of the elastic deviatoric stress. The flexural rigidity D(x) and Te=Te(x) are functions of coordinate only and do not depend on the vertical deflection w and its spatial derivatives, as well as on the strain and stress. The properties of the elastic plate, de- fined through the variable parameters Mx=Mx(x) and Tx=Tx(x), are also independent of stress and strain.
Arbitrary theology: Composite plate with nonlinear properties and self-adjusting layering. For inelastic rheology the expressions for Mx and Tx can be derived from (8) in the same way as for the elastic rheology. The only difference is that the operators relating stress and strain will be defined through the nonlinear expression (5), constructed from constitutive equations (1)-(3) and (4).
Continental plates may exhibit horizontal mechanical discon- tinuities or low strength zones. For example, a weak lower crust that cmmot support significant bending stresses (Figure 3) may allow a strong upper crust to deform independently of the up- permost mantle lithosphere. The competent layers, separated by such weak zones, are no longer "welded" together, similar to the leaves of a laminated spring. In this case horizontal components of stress cannot be transmitted from one competent layer to an- other (upper crust and mantle). The lithosphere thus deforms as a system of distinct "subplates" with separate neutral planes [Lobkovsky and Ketchman, 1992]. The bending moment M x for a system with n neutral planes is
where
y; = y--yni(X), Yni is the depth
to the ith neutral
plane
(c•x•
lyf:0
= 0);
y?
( x
) = Y7
, Y[
( x
) = y[ are
the
respective
depths
to the lower and upper low-strength interfaces. Correspondingly, the thickness of the ith detached layer is y[ -y j- = N• i (x).
In addition, the material properties may also vary continuously within each discrete layer. The expression for Mx thus becomes
where m i is a number of "welded" (continuous C•x• ) sublayers in the ith detached layer:
? I
,
O' (X,y)y•(x)
xx
y[.o_,)(x
)
(•(x,y)=(•(g) is the bending
stress
defined
for material
pa-
rameters of jth sublayer belonging to the ith detached layer, J=JO). For example, for an elastic sublayer we have
Interiors of layers with nonlinear rheology and mixed com- position obey brittle, elastic, or ductile constitutive laws accord- ing to the principle of minimal yield stress (4)-(5). As stated above, this minimum depends on various local conditions such as temperature, stress gradient, pressure, mineral composition, and other specific features. These conditions determine as well the


![Figure 7c shows a test of our model for the oceanic litho- sphere against the data on the Nazca [Judge and McNutt, 1991 ] and Hawaiian Islands [Wessel, 1993]](https://thumb-eu.123doks.com/thumbv2/123doknet/14740587.576274/21.942.477.834.926.1137/figure-oceanic-sphere-nazca-mcnutt-hawaiian-islands-wessel.webp)