HAL Id: hal-00303363
https://hal.archives-ouvertes.fr/hal-00303363
Submitted on 22 Feb 2008HAL is a multi-disciplinary open access
archive for the deposit and dissemination of sci-entific research documents, whether they are pub-lished or not. The documents may come from teaching and research institutions in France or abroad, or from public or private research centers.
L’archive ouverte pluridisciplinaire HAL, est destinée au dépôt et à la diffusion de documents scientifiques de niveau recherche, publiés ou non, émanant des établissements d’enseignement et de recherche français ou étrangers, des laboratoires publics ou privés.
Measurements of UV irradiance within the area of one
satellite pixel
P. Weihs, M. Blumthaler, H. E. Rieder, A. Kreuter, S. Simic, W. Laube, A.
W. Schmalwieser, J. Wagner, A. Tanskanen
To cite this version:
P. Weihs, M. Blumthaler, H. E. Rieder, A. Kreuter, S. Simic, et al.. Measurements of UV irradiance within the area of one satellite pixel. Atmospheric Chemistry and Physics Discussions, European Geosciences Union, 2008, 8 (1), pp.3693-3720. �hal-00303363�
ACPD
8, 3693–3720, 2008Measurements of UV irradiance within the area of one satellite
pixel P. Weihs et al. Title Page Abstract Introduction Conclusions References Tables Figures ◭ ◮ ◭ ◮ Back Close
Full Screen / Esc
Printer-friendly Version Interactive Discussion
Atmos. Chem. Phys. Discuss., 8, 3693–3720, 2008 www.atmos-chem-phys-discuss.net/8/3693/2008/ © Author(s) 2008. This work is distributed under the Creative Commons Attribution 3.0 License.
Atmospheric Chemistry and Physics Discussions
Measurements of UV irradiance within the
area of one satellite pixel
P. Weihs1, M. Blumthaler2, H. E. Rieder1,3,*, A. Kreuter2, S. Simic1, W. Laube1, A. W. Schmalwieser4, J. Wagner1, and A. Tanskanen4
1
Institute for Meteorology, Department Water – Atmosphere – Environment, University of Natural Resources and Applied Life Sciences (BOKU), Vienna, Austria
2
Institute for Geography and Regional Research, University of Vienna, Vienna, Austria
3
Finnish Meteorological Institute, Helsinki, Finland
4
Institute of Medical Physics and Biostatistics, University of Veterinary Medicine, Vienna, Austria
*
now at: Institute for Atmospheric and Climate Science, ETH Zurich, Zurich, Switzerland Received: 3 January 2008 – Accepted: 6 January 2008 – Published: 22 February 2008 Correspondence to: P. Weihs (philipp.weihs@boku.ac.at)
ACPD
8, 3693–3720, 2008Measurements of UV irradiance within the area of one satellite
pixel P. Weihs et al. Title Page Abstract Introduction Conclusions References Tables Figures ◭ ◮ ◭ ◮ Back Close
Full Screen / Esc
Printer-friendly Version Interactive Discussion Abstract
A measurement campaign was performed in the region of Vienna and its surroundings from May to July 2007. Within the scope of this campaign erythemal UV was mea-sured at six ground stations within a radius of 30 km. First, the homogeneity of the UV levels within the area of one satellite pixel was studied. Second, the ground UV was
5
compared to ground UV retrieved by the ozone monitoring instrument (OMI) onboard the NASA EOS Aura Spacecraft. During clear sky conditions the difference in erythe-mal UV measured by the different stations was within the measurement uncertainty of 8%. For partly cloudy conditions and total overcast conditions the discrepancy of mo-mentary values between the stations is up to 200% or even higher. If averages of the
10
UV index over longer time periods are compared the difference between the stations decreases strongly. The agreement is better than 20% within a distance of 10 km be-tween the stations for 3 h averages. The comparison with OMI UV showed for clear sky conditions higher satellite retrieved UV values by on the average approximately 15%. For partly cloudy and overcast conditions the OMI derived surface UV estimates show
15
larger deviation from the ground-based reference data, and even bigger systematic positive bias.
1 Introduction
During the last three decades global increases in UV fluxes resulting from decreas-ing stratospheric ozone concentrations have been an issue of public concern because
20
of the direct linkage to human health (e.g. Scientific Committee on Problems of the environment (SCOPE), 1992, 1993; United Nations Environmental Program (UNEP), 1998; National Radiological Protection Board, 2002). A lot of effort has been done to understand the spectral UV climatology from ground-based measurements at different locations (WMO, 1995). Ground based measurements are sparsely located and most
25
ACPD
8, 3693–3720, 2008Measurements of UV irradiance within the area of one satellite
pixel P. Weihs et al. Title Page Abstract Introduction Conclusions References Tables Figures ◭ ◮ ◭ ◮ Back Close
Full Screen / Esc
Printer-friendly Version Interactive Discussion
radiation record from a ground-measurement station is available from the observatory Belsk in Poland dating back to 1978. Because of a lack in measurement data of UV in the past a lot of reconstruction studies for the UV-part of the spectra (e.g. Kaurola et al., 2000; Lindfors and Vuilleumier, 2005; Koepke et al., 2006; Rieder et al., 2008) have been performed. The results of these studies show that surface UV-radiation
sig-5
nificantly increased during the last 20 to 30 years. Near surface UV measurements, reconstruction of past UV doses as well as the development of satellite derivation tech-niques have been among big scientific issues within the UV community during the last years.
However, while the original TOMS surface UV algorithm makes an aerosol correction
10
based on the Aerosol Index, the current OMI surface UV algorithm does not include any correction for absorbing aerosols.
The satellite-derived surface UV data provided by TOMS measurements has been extensively validated by comparison with ground measurements (eg. Kalliskota et al., 2000; McKenzie et al, 2001b; Fioletov et al., 2002; Chubarova et al., 2002; Cede et al.,
15
2004; Arola et al., 2005; Kazantzidis et al., 2006; Tanskanen et al., 2008).
According to these studies the satellite derived surface UV data are 0 to 40% higher than ground-based data during snow free conditions. The validation of the TOMS data showed, that surface UV is highly underestimated at high latitude sites because sea-sonal snow is interpreted as thick clouds by the algorithms (e.g. Kalliskota et al., 2000;
20
Krotkov et al., 2001, 2002). Further it has been reported that the largest differences between satellite-derived and measured UV irradiances occur for the shortest wave-lengths (e.g. Kazantzidis et al., 2006). With regard to the spectral aspect, Wuttke et al. (2003) emphasized the importance of spectral comparisons within validation studies to give hints about possible sources of uncertainties. Altogether, the mentioned studies
25
show that the validation of the newly released OMI surface UV products is an important scientific task in this area of research. In addition a big question mark is the influence of ground inhomogeneity on the UV retrieval as well as the representativeness of the derived UV at one pixel. No studies have been performed up to now to systematically
ACPD
8, 3693–3720, 2008Measurements of UV irradiance within the area of one satellite
pixel P. Weihs et al. Title Page Abstract Introduction Conclusions References Tables Figures ◭ ◮ ◭ ◮ Back Close
Full Screen / Esc
Printer-friendly Version Interactive Discussion
study the inhomogeneity of UV within the area of one pixel and so to give also hints concerning the possible fluctuations within the area of one pixel. Within the present study we performed a validation of the satellite retrieved ground UV and in addition studied possible inhomogeneity within the area of one satellite pixel.
2 Material and methods
5
In this study we compared the surface UV indices derived from OMI with the ground-based measurements from 6 biometers in the city of Vienna and its surroundings over the three months in summer 2007.
2.1 Ground measurements
6 Biometers (Model 501, Solar Light) were used during a measurement campaign from
10
the beginning of May until the end of July 2007. This type of detectors has a spectral sensitivity which is adapted to the human erythema action spectrum and therefore it gives directly a signal related to the biological reaction. However, due to the small mismatch between the sensitivity of the detector and the action spectrum a thorough calibration is necessary, which results in a calibration matrix in dependence on solar
15
zenith angle and on atmospheric ozone content. The average angular response error (“cosine error”) of the detector in dependence on the solar zenith angle is taken into account in the calibration matrix (Webb et al., 2006). Before deploying the detectors at their respective stations they were intercompared and homogenized during 5 days at one of these sites (Grossenzersdorf (4)). The 6 stations BOKU University (1),
Stre-20
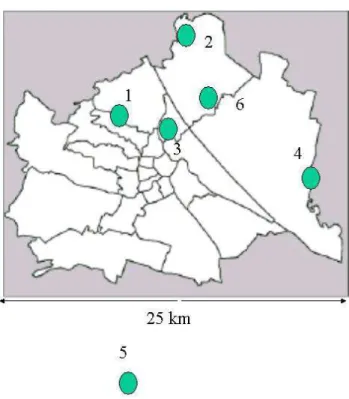
bersdorf (2), TGM (3), Grossenzersdorf (4), Bad Voeslau (5) and Vienna Veterinary University (6) were chosen to get a representative picture of the UV irradiance distribu-tion within an area of 30 km. An overview over the locadistribu-tion of the 6 stadistribu-tions in Vienna is provided in Fig. 1 while the station number, geographic position and altitude are given in Table 1. Two of the stations (TGM and Vienna Veterinary University) are situated
ACPD
8, 3693–3720, 2008Measurements of UV irradiance within the area of one satellite
pixel P. Weihs et al. Title Page Abstract Introduction Conclusions References Tables Figures ◭ ◮ ◭ ◮ Back Close
Full Screen / Esc
Printer-friendly Version Interactive Discussion
in the centre of the city where the largest turbidity is expected. Two of them (BOKU and Strebersdorf) are situated in the northern part of Vienna. BOKU is situated in a residential area in the 19th district of Vienna in an altitude of 256 m a.s.l. a little bit higher than the other stations. It could be expected that during some times of the day it may be situated over an eventual temperature inversion. Strebersdorf is situated at the
5
northern limit of Vienna at 175 m a.s.l. Station Bad Voeslau is already at a distance of 30 km from the southern limit of Vienna at an altitude of 286 m a.s.l. It could be used as a reference station if the highly polluted area was only situated in Vienna. During the whole campaign at station 1 an automatic sun photometer (Precision Filter Radiome-ter, PMOD/WRC, Switzerland) was operated, which was mounted on a sun tracker and
10
measured every minute the irradiance from the direct sun at the wavelengths 368 nm, 412 nm, 500 nm and 862 nm. From these data the aerosol optical depth was calculated for each wavelength. Additionally at station BOKU (1), hemispheric sky photographs were routinely taken every 15 min with a fish eye camera. It was used to check the cloudiness conditions for specific days.
15
3 Results
3.1 Comparison of ground measurement data 3.1.1 Clear-sky conditions
The measured surface UV-radiation was compared between all stations under three atmospheric conditions: clear-sky (sunshine duration equal to 100% of maximum
pos-20
sible sunshine), partly cloudy and overcast (no sunshine at all) (Fig. 2a–2c). BOKU (1) was chosen as a reference station for this comparison, since the additional measure-ments such as cloud cover monitoring and aerosol optical depth measuremeasure-ments were performed there.
Under clear sky conditions the differences in UV-radiation of all stations to BOKU
ACPD
8, 3693–3720, 2008Measurements of UV irradiance within the area of one satellite
pixel P. Weihs et al. Title Page Abstract Introduction Conclusions References Tables Figures ◭ ◮ ◭ ◮ Back Close
Full Screen / Esc
Printer-friendly Version Interactive Discussion
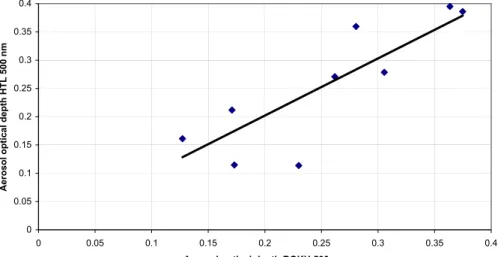
University were within ±5% (see Table 2a) which is within the measurement uncer-tainty of the instruments (±5%) used within this study. These results show that under clear sky conditions the atmospheric conditions within the study area are in most cases constant and the aerosol effect from urban pollution is not detectable because the re-sults lie within the measurement uncertainty of the instruments. This conclusion is
5
confirmed by the measurements of aerosol optical depth performed in the city centre (station TGM) and at BOKU at the same time (Fig. 3), which show no distinctive differ-ence between the aerosol optical depth at both stations. The effect of aerosol optical depth on UV irradiance was then analysed. We first performed a homogenization of all data by converting them to a contant level of total column ozone (300 DU) using
10
following equation:
HomUVery = UVery ∗ Korr (1)
where Uvery is the measured erythemal UV irradiance
HomUVery is the erythemal UV irradiance homogenized to column ozone of 300 DU Korr is the homogenization factor and is calculated using following equation
15
Korr = ModUV(300 DU)/ModUV(O3) (2)
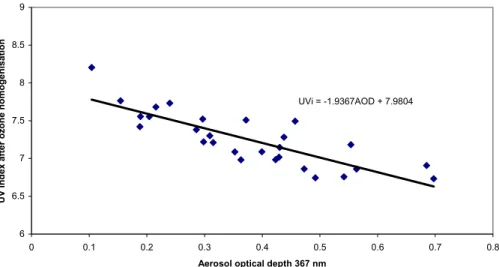
Where ModUV(300DU) is the erythemal UV irradiance calculated with the radiative transfer model SDISORT (Stamnes et al., 1988) using a column ozone value of 300 DU and ModUV(O3) is erythemal UV irradiance calculated with the actual ozone amount. The column ozone values determined by OMI were taken for this homogenisation. The
20
dependence of erythemal UV on aerosol optical depth is shown for a solar zenith angle of 30◦ (approximately solar zenith angle during the overpass of the AURA satellite) in Fig. 4. There is a decrease in UV index of approximately 2.5% per increase in aerosol optical depth at 368 nm of 0.1. According to the assumed accuracy of the UV biometers of ±5%, only changes in aerosol optical depth larger than 0.2 result in a change in
25
UV larger than 5% and may be reliably detected using UV measurements. The largest fluctuations in aerosol optical depth during the campaign were in the order of magnitude
ACPD
8, 3693–3720, 2008Measurements of UV irradiance within the area of one satellite
pixel P. Weihs et al. Title Page Abstract Introduction Conclusions References Tables Figures ◭ ◮ ◭ ◮ Back Close
Full Screen / Esc
Printer-friendly Version Interactive Discussion
of 0.6. Analysis of changes in aerosol optical depth on satellite UV retrieval accuracy may therefore be performed since the expected effects of turbidity on UV irradiance are expected to be larger than the measurement uncertainty of about ±5%. Altogether clear sky data showed no systematic difference between the stations. Ground UV showed however a distinctible dependence on aerosol optical depth.
5
3.1.2 Cloudy conditions
For days with partial cloudiness, data are comparable to the clear-sky data. The fluc-tuations of the measured UV index are however slightly larger. It is noticeable here, that the differences between the stations are larger than under clear-sky conditions. This can be explained mainly through differences in cloud cover and cloud reflection
10
at the different measurement sites at the same time. The average difference of all the stations to BOKU University (Table 2) lie within ±5%.
For days with totally overcast conditions (sunshine duration equal 0) we obtained larger differences between the different stations and BOKU station (1). The absolute fluctuations of the UV index are also much larger. The average differences between
15
the stations 5 and 6 to BOKU University (Table 2) lie within ±6% which is almost within the measurement uncertainty of the used instruments. Under overcast conditions the average differences within the different stations is even larger than for days with partial cloudiness (see Table 2c). This can be explained through differences in cloud types and cloud properties. The largest difference between BOKU station (1) and TGM (3)
20
situated in the centre of the city with an altitude difference of 80 m may be explained by low altitude fog layers connected with ground inversions.
3.1.3 Subpixel variation
The variability within one pixel during cloudy conditions was then adressed. The size of the satellite pixel ranges approximately between 13×24 km and 50×50 km depending
25
ACPD
8, 3693–3720, 2008Measurements of UV irradiance within the area of one satellite
pixel P. Weihs et al. Title Page Abstract Introduction Conclusions References Tables Figures ◭ ◮ ◭ ◮ Back Close
Full Screen / Esc
Printer-friendly Version Interactive Discussion
variability V of the station x around a mean systematic bias of the station to BOKU was calculated using following equation:
V(station x)=X(Ri − Rmean) ∗ 100/n (3)
Where Ri is the momentary or the averaged ratio over a given time intervall (1 h, 2 h, 3 h) of the UV index at station x to the UV index at station BOKU
5
Rmean is the average of all Ri of station x. n is the number of values
Figure 5 shows the variability V as a function of the distance from BOKU station for different time intervals. Each distance corresponds to a station which is shown in Table 3. The variability increases with increasing distance from BOKU. In general the
10
variability to BOKU decreases when UV index is averaged over a longer time period. An exception is V for total overcast conditions and for distances larger than 17 km, where averaging the UV index does not contribute to a decrease of the variability. The explanation may lie in different cloud optical characteristics due to the large distance which may be the most dominant factor. The strongest decrease in variability at most
15
of the stations is obtained when momentary values are averaged over a 1 h interval. The difference of variability between 1 h mean, 2 h means and 3 h means is less pro-nounced.
Altogether the results from the different measurement sites show that under clear-sky conditions one single value (as provided by the satellite) is representative for the
20
area of one satellite pixel. For partly cloudy or overcast conditions it has to be taken into account that atmospheric conditions can be quiet heterogeneous within the area of one satellite pixel (compare Table 2 b and c). Taking this into account the representa-tiveness of one single measurement is much weaker than under clear-sky conditions. The variability of stations within a radius of 10 km of BOKU station is however below 20
25
ACPD
8, 3693–3720, 2008Measurements of UV irradiance within the area of one satellite
pixel P. Weihs et al. Title Page Abstract Introduction Conclusions References Tables Figures ◭ ◮ ◭ ◮ Back Close
Full Screen / Esc
Printer-friendly Version Interactive Discussion
3.2 Comparison of ground measurement data with satellite observations
In this section a comparison of the OMI-derived UV index with ground measurements under different atmospheric conditions (clear-sky, partly cloudy and overcast) is shown. During the entire measurement campaign we had totally 77 OMI-overpasses available which were within the needed geographic neighborhood to the measurement sites used
5
within the campaign. In total we had the opportunity to compare OMI-data with ground measurements 9 times under overcast conditions, 23 times under clear-sky conditions and 45 times under partly cloudy conditions.
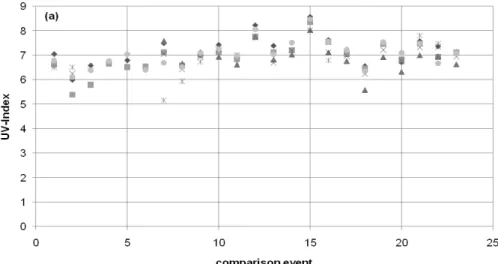
3.2.1 Comparison for clear sky conditions
The comparison of satellite data with ground measurements under clear sky
condi-10
tions has been possible for 23 observation events during the measurement campaign (Fig. 6a). In general the satellite slightly overestimated the ground UV. The difference between the satellite UV values and the ground measured value is in general between 0 and 40% (if outlier are neglected) (see also Fig. 7). The average difference between the satellite UV-value and the ground measured value is +16% at BOKU University (1),
15
+15% at Bad Voeslau (5) and Grossenzersdorf (4), +11% at Vienna Veterinary Uni-versity (6), +14% at the station Strebersdorf (2) and +18% at TGM (3). These results agree with the overestimation of satellite derived UV-data over urban areas (without snow cover) under clear sky conditions in the range of 0% to 40% reported in sev-eral papers (e.g. Kalliskota et al., 2000; McKenzie et al, 2001b; Fioletov et al., 2002;
20
Chubarova et al., 2002; Cede et al., 2004; Arola et al., 2005; Kazantzidis et al., 2006). Figure 6a gives a comparison of all ground measurements with the corresponding OMI UV-data under clear-sky conditions. Figure 7 shows the ratio of OMI erythemal UV to the ground measured UV at station BOKU (1) as a function of the aerosol optical depth at 368 nm. An increase in the ratio as a function of aerosol optical depth can be seen.
25
The ratio increases from 1.05 for an aerosol optical depth of 0.15 to 1.35 for an aerosol optical depth of 0.6. if one of the value around 1.45 is considered as an outlier). The
ACPD
8, 3693–3720, 2008Measurements of UV irradiance within the area of one satellite
pixel P. Weihs et al. Title Page Abstract Introduction Conclusions References Tables Figures ◭ ◮ ◭ ◮ Back Close
Full Screen / Esc
Printer-friendly Version Interactive Discussion
discrepancy between OMI UV and ground measurements seems to be slightly larger for solar zenith angles (SZA) larger than 30 degrees than for SZA smaller than 30◦. These findings also agree with the results obtained by Arola et al. (2005).
3.2.2 Comparison for partly cloudy conditions
The comparison of OMI-products with ground measurements under partly cloudy
con-5
ditions has been possible for 45 observation events during the measurement campaign. Since momentary values seem not to be able to characterise the UV levels in the area of one satellite pixel (Sect. 3.1), hourly averaged values of the UV index were used for this comparison to OMI. The satellite UV-values are one average higher by 25% at the stations Grossenzersdorf (4), 27% at Vienna Veterinary University (6), 32% at
10
Bad Voeslau (5), 24% at the station TGM (3), 30% at BOKU University (1) and 37% at station Strebersdorf (2). Figure 6b gives a comparison of all ground measurements with the corresponding OMI UV-data under partly cloudy conditions. The median of the differences of OMI to ground UV stations is with values between 12 and 26% lower since it does not include outliers.
15
3.2.3 Comparison for overcast conditions
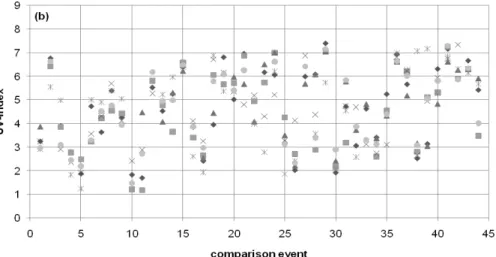
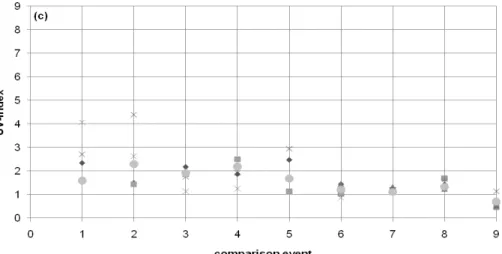
During the entire measurement campaign we had the opportunity to study the agree-ment of OMI satellite data with ground measureagree-ments for 9 observation events during totally overcast conditions (Fig. 6c). The analysis of the datasets shows that under overcast conditions the OMI UV algorithm does not agree very well with the ground
20
observations. In average the OMI instrument overestimates the UV-values by more than 50%. The average difference between the satellite derived data and the ground observations is 112% at TGM (3), 115% at Bad Voeslau (5), 98% at Vienna Veterinary University(6), 98% at BOKU University (1), 56% at Grossenzersdorf (4) and 126% in Strebersdorf (2). An outlier may however strongly influence the average ratio when
25
avail-ACPD
8, 3693–3720, 2008Measurements of UV irradiance within the area of one satellite
pixel P. Weihs et al. Title Page Abstract Introduction Conclusions References Tables Figures ◭ ◮ ◭ ◮ Back Close
Full Screen / Esc
Printer-friendly Version Interactive Discussion
able because of missing data. The median may therefore in this case be more suited to characterize the discrepancy between satellite and ground UV. The median of the differences is +50% at Grossenzersdorf (4), +61% for BOKU (1) and Vienna Veterinary University (6) but +89% at TGM (3), +98% at Strebersdorf (2) and still +115% at Bad Voeslau (5).
5
Altogether, these results indicate an overestimation of simulated ground UV by the OMI UV algorithm. An improvement of the algorithm for overcast conditions is nec-essary to improve the quality and usability of satellite UV datasets also under these atmospheric conditions.
4 Discussion and conclusion
10
Under clear-sky conditions the OMI UV-values overestimate those measured at ground in average by 11 to 18%. This overestimation is known already from other studies that compared satellite and ground observation datasets. In general the OMI surface UV algorithm provides useful information on distribution of surface UV radiation. A more profound analysis however shows that the discrepancy between OMI and ground UV
15
increases with increasing turbidity. These results confirm the overestimation of ground UV by TOMS and OMI which was found in previous studies (Kalliskota et al., 2000; McKenzie et al, 2001b; Fioletov et al., 2002; Chubarova et al., 2002; Cede et al., 2004; Arola et al., 2005; Kazantzidis et al., 2006). It also confirms findings by Arola et al. (2005) which showed the increase of the discrepancy between OMI and ground
20
measurements with increasing aerosol optical depth.
Under partly cloudy and overcast conditions some improvement of the UV-algorithm or some additional routines in the OMI scheme are needed to get a better fit between satellite data and ground observations. While under partly cloudy conditions the satel-lite UV-values are 25% to 37% higher than the ground observations the ratio OMI to
25
ground UV becomes even larger for overcast conditions. The satellite overestimates the observed ground values by more than 50%.
ACPD
8, 3693–3720, 2008Measurements of UV irradiance within the area of one satellite
pixel P. Weihs et al. Title Page Abstract Introduction Conclusions References Tables Figures ◭ ◮ ◭ ◮ Back Close
Full Screen / Esc
Printer-friendly Version Interactive Discussion
For an improvement of the OMI UV-algorithms under partly cloudy and overcast conditions more data concerning the cloud optical depth in order to first test the OMI cloud optical depth retrieval algorithms will be required.
Concerning the representativeness of one UV value for one whole pixel one value may be sufficient to characterize the UV levels of the Viennese area
(ap-5
prox. 30×30 km) under clear sky conditions. Under partly cloudy conditions the average differences between the stations are within ±10%. Absolute difference in UV index at a given time of the day may however reach values of up to 5 UV index und overcast conditions (see Fig. 2c). Under total overcast conditions discrepancies between the stations as high as 57% may be reached.
10
Altogether the results of this study indicate that currently ground based measure-ment networks cannot be replaced by the use of satellite data because of the still high overestimation of actual UV-values under cloudy and overcast conditions. To get a homogeneous and representative UV time series that enables the study of trends in erythemal UV-radiation, a combination of high quality ground based measurements
15
supplemented by satellite observations are necessary.
Acknowledgements. The Dutch-Finnish built OMI instrument is part of the NASA EOS Aura
satellite payload. The OMI project is managed by NIVR and KNMI in the Netherlands. We thank the OMI International Science Team for the satellite data used in this study. The OMI surface UV data were obtained from the NASA Aura Validation Data Center (AVDC). This work
20
was performed in the framework of the International ESA/KNMI/NIVR OMI “Announcement of Opportunity for Calibration and Validation of the Ozone Monitoring Instrument”, providing early access to provisional OMI data sets and guidance to public OMI data. The PFR-sunphotometer was kindly provided by the Institute for Meteorology and Geophysics, University of Innsbruck, Austria.
25
This work was funded by FFG, Austria within the scope of the projects OMI-ASAP Validation of Ozone Monitoring Instrument (OMI) Ground UV Products (OMI-ASAP).
ACPD
8, 3693–3720, 2008Measurements of UV irradiance within the area of one satellite
pixel P. Weihs et al. Title Page Abstract Introduction Conclusions References Tables Figures ◭ ◮ ◭ ◮ Back Close
Full Screen / Esc
Printer-friendly Version Interactive Discussion References
Arola, A., Kazadzis, S., Krotkov, N., Bais, A., Gr ¨obner, J., and Herman, J. R.: Assess-ment of TOMS UV bias due to absorbing aerosols, J. Geophys. Res., 110, D23211, doi:10.1029/2005JD005913, 2005.
Bhartia, P. K. and Wellemeyer, C.: TOMS version 8 Algorithm Theoretical Basis Document,
5
http://toms.gsfc.nasa.gov, November 24, 2004.
Cede, A., Luccini, E., Nu ˜nez, L., Piacentini, R. D., Blumthaler, M., and Herman, J.: TOMS derived erythemal irradiance versus measurements at the stations of the Argentine UV Mon-itoring Network, J. Geophys. Res., 109, D08109, doi:10.1029/2004JD004519, 2004.
Chubarova, N. E., Yurova, A. Y., Krotkov, N. A., and Herman, J. R.: Comparisons between
10
ground measurements of broadband ultraviolet (300 to 380 nm) and total ozone mapping spectrometer ultraviolet estimates at Moscow from 1979 to 2000, Opt. Eng., 41, 12, 2070– 3081, 2002.
Fioletov, V. E., Kerr, J. B., Wardle, D. I., Krotkov, N., and Herman, J. R.: Comparison of Brewer ultraviolet irradiance measurements with total ozone mapping spectrometer
satel-15
lite retrievals, Opt. Eng., 41, 12, 3051–3061, 2002.
Herman, J. R., Krotkov, N. A., Celarier, E., Larko, D., and Labow, G.: Distribution of UV radiation at the Earth’s surface from TOMS measured UV-backscattered radiances, J. Geophys. Res. 104, 12 059–12 076, doi:10.1029/1999JD900062, 1999.
Kalliskota, S., Kaurola, J., Taalas, P., Herman, J. R., Celarier, E., and Krotkov, N.: Comparison
20
of the daily UV doses estimated from Nimbus7/TOMS measurements and ground-based spectroradiometric data, J. Geophys. Res., 105, 5059–5067, doi:10.1029/1999JD900926, 2000.
Kaurola, J., Taalas, P., Koskela, T., Borkowski, J., and Josefsson, W.: Long-term variations of UV-B doses at three stations in northern Europe, J. Geophys. Res., 105, D16, 20 813–
25
20 820, doi:10.1029/2000JD900258, 2000.
Kazantzidis, A., Bais, A. F., Gr ¨ober, J., Herman, J. R., Kazadzis, S., Krotkov, N., Kyr ¨o, E., den Outer, P. N., Garane, K., G ¨orts, P., Lakkala, K., Meleti, C., Slaper, H., Tax, R. B., Turunen, T., and Zerefos, C. S.: Comparison of satellite-derived UV irradiances with ground-based measurements at four European stations, J. Geophys. Res., 111, D13207,
30
doi:10.1029/2005JD006672, 2006.
ACPD
8, 3693–3720, 2008Measurements of UV irradiance within the area of one satellite
pixel P. Weihs et al. Title Page Abstract Introduction Conclusions References Tables Figures ◭ ◮ ◭ ◮ Back Close
Full Screen / Esc
Printer-friendly Version Interactive Discussion Kazantzidis, A., Kryscin, J., Lindfors, A., Olseth, J. A., den Outer, P., Pribullova, A.,
Schmal-wieser, A., Slaper, H., Staiger, H., Verdebout, J., Vuilleumier, L., and Weihs, P.: Modelling solar UV radiation in the past: algorithms and input data, Proc. SPIE, 6362, 1–11, 2006. Krotkov, N. A., Bhartia, P. K, Herman, J. R., Ahmad, Z., and Fioletov, V.: Satellite estimation
of spectral surface UV irradiance 2: Effect of horizontally homogeneous clouds and snow, J.
5
Geophys. Res., 106, 11 743–11 759, doi:10.1029/2000JD900721, 2001.
Krotkov, N. A., Herman, J. R., Bhartia, p. K., Seftor, C., Arola, A., Kaurola, J., Kalliskota, S., Taalas, P., and Geogdzhaev, I. V.: Version 2 total ozone mapping spectrometer ultraviolet algorithm: problems and enhancements, Opt. Eng., 41, 12, 3028–3039, 2002.
Levelt, P. F., Hilsenrath, E., Leppelmeier, G. W., Van den Oord, G. H. J., Bhartia, P. K.,
Tam-10
minen, J., De Haan, J. F., and Veefkind, J. P.: Scientific Objectives of the Ozone Monitoring Instrument, IEEE Trans. Geo. Rem. Sens., 44, 5, 1199–1208, 2006.
Lindfors, A. and Vuilleumier, L.: Erythemal UV at Davos (Switzerland), 1926–2003, estimated using total ozone, sunshine duration, and snow depth, J. Geophys. Res., 110, D02104, doi:10.1029/2004JD005231, 2005.
15
McKenzie, R. L., Seckmeyer, G., Bais, A. F., Kerr, J.B., and Madronich S.: Satellite retrievals of erythemal UV dose compared with ground-based measurements at northern and southern midlatitudes, J. Geophys. Res., 106, 24 051–24 062, doi:10.1029/2001JD000545, 2001b. National Radiological Protection Board: Health effects from ultraviolet radiation: Report of an
advisory group on non-ionising radiation, Doc. NRP, 13, 1, UK, 2002.
20
Rieder, H., Holawe, F., Simic, S., Blumthaler, M., Krzycin, J., Wagner, J., Schmalwieser, A., and Weihs, P.: Reconstruction of erythemal UV-levels for two stations in Austria: A comparison between alpine and urban regions, Atmos. Chem. Phys, accepted, 2007.
SCOPE: Effects of Increased Ultraviolet Radiation on Global Ecosystems: Scientific Committee on Problems of the Environment (SCOPE), 51 bd de Montmorency, 75016 Paris, France,
25
1993.
SCOPE: Effects of Increased Ultraviolet Radiation on Biological Systems: Scientific Committee on Problems of the Environment (SCOPE), 51 bd de Montmorency, 75016 Paris, France, 1992.
Stamnes, K., Tsay, S. C., Wiscombe, W., and Jayaweera, K.: Numerically stable algorithm for
30
discrete-ordinate-method radiative transfer in multible scattering and emitting layered media, Appl. Opt., 27, 2502–2509, 1988.
ACPD
8, 3693–3720, 2008Measurements of UV irradiance within the area of one satellite
pixel P. Weihs et al. Title Page Abstract Introduction Conclusions References Tables Figures ◭ ◮ ◭ ◮ Back Close
Full Screen / Esc
Printer-friendly Version Interactive Discussion OMI, IEEE Trans. Geo. Rem. Sens., 44, 1267–1271, 2006.
Tanskanen, A., Lindfors, A., Mtt, A., Krotkov, N., Herman, J., Kaurola, J., Koskela, T., Lakkala, K., Fioletov, V., Bernhard, G., McKenzie, R., Kondo, Y., O’Neill, M., Slaper, H., DenOuter, P., Bais, A. F., and Tamminen, J.: Validation of daily erythemal doses from ozone Monitor-ing Instrument with ground-based UV measurement data, J. Geophys. Res., 112, D24S44,
5
doi:10.1029/2007JD008830, 2008.
United Nations Environment Program (UNEP): Environmental effects of ozone depletion: 1998 assessment, Nairobi, Kenya, 1998.
Webb, A., Gr ¨obner, J., and Blumthaler, M.: A Practical Guide to Operating Broadband In-struments Measuring Erythemally Weighted Irradiance, Office for Official Publications of the
10
European Communities, Luxembourg, 21 pp., 2006, ISBN 92-898-0032-1, 2006.
Wuttke, S., Verdebout, J., and Seckmeyer, G.: An improved algorithm for satellite-derived UV radiation, Photochem. Photobiol., 77, 1, 52–57, 2003.
World Meteorological Organization (WMO): Scientific Assessment of Ozone Depletion: 1994, Global Ozone Research and Monitoring Project, WMO Rep. N, 37, Geneva, 1995.
ACPD
8, 3693–3720, 2008Measurements of UV irradiance within the area of one satellite
pixel P. Weihs et al. Title Page Abstract Introduction Conclusions References Tables Figures ◭ ◮ ◭ ◮ Back Close
Full Screen / Esc
Printer-friendly Version Interactive Discussion
Table 1. Information on ground based stations used within this study.
Station Station Code Geographic Position Altitude
Boku University 1 16◦19′E, 48◦14′N 256 m a.s.l
Strebersdorf 2 16◦23′E, 48◦18′N 175 m a.s.l
Tgm 3 16◦22′E, 48◦13′N 178 m a.s.l
Grossenzersdorf 4 16◦33′E, 48◦12′N 156 m a.s.l
Bad Voeslau 5 16◦12′E, 48◦57′N 286 m a.s.l
ACPD
8, 3693–3720, 2008Measurements of UV irradiance within the area of one satellite
pixel P. Weihs et al. Title Page Abstract Introduction Conclusions References Tables Figures ◭ ◮ ◭ ◮ Back Close
Full Screen / Esc
Printer-friendly Version Interactive Discussion
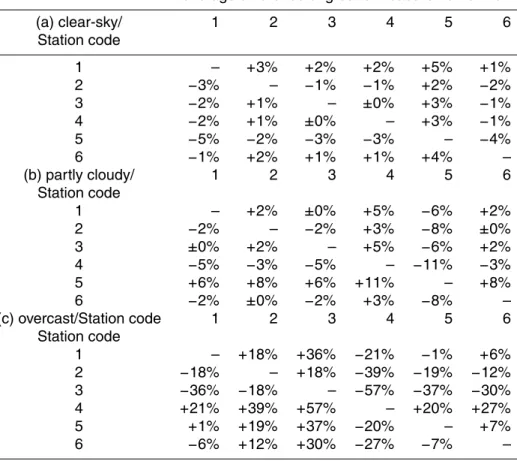
Table 2. Average deviation of measured UV between the different ground stations under
clear-sky (a), partly cloudy (b) and overcast (c) conditions. Stations in the left column are always compared to the stations mentioned in the upper row (e.g. for clear sky conditions, average UV of station 2 is on average lower by 3% than UV of station 1).
average difference of ground measurements in %
(a) clear-sky/ 1 2 3 4 5 6 Station code 1 – +3% +2% +2% +5% +1% 2 −3% – −1% −1% +2% −2% 3 −2% +1% – ±0% +3% −1% 4 −2% +1% ±0% – +3% −1% 5 −5% −2% −3% −3% – −4% 6 −1% +2% +1% +1% +4% – (b) partly cloudy/ 1 2 3 4 5 6 Station code 1 – +2% ±0% +5% −6% +2% 2 −2% – −2% +3% −8% ±0% 3 ±0% +2% – +5% −6% +2% 4 −5% −3% −5% – −11% −3% 5 +6% +8% +6% +11% – +8% 6 −2% ±0% −2% +3% −8% – (c) overcast/Station code 1 2 3 4 5 6 Station code 1 – +18% +36% −21% −1% +6% 2 −18% – +18% −39% −19% −12% 3 −36% −18% – −57% −37% −30% 4 +21% +39% +57% – +20% +27% 5 +1% +19% +37% −20% – +7% 6 −6% +12% +30% −27% −7% –
ACPD
8, 3693–3720, 2008Measurements of UV irradiance within the area of one satellite
pixel P. Weihs et al. Title Page Abstract Introduction Conclusions References Tables Figures ◭ ◮ ◭ ◮ Back Close
Full Screen / Esc
Printer-friendly Version Interactive Discussion
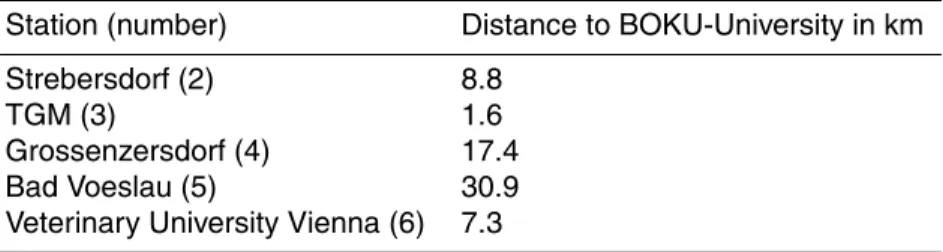
Table 3. Distance of the stations to BOKU University.
Station (number) Distance to BOKU-University in km
Strebersdorf (2) 8.8
TGM (3) 1.6
Grossenzersdorf (4) 17.4
Bad Voeslau (5) 30.9
ACPD
8, 3693–3720, 2008Measurements of UV irradiance within the area of one satellite
pixel P. Weihs et al. Title Page Abstract Introduction Conclusions References Tables Figures ◭ ◮ ◭ ◮ Back Close
Full Screen / Esc
Printer-friendly Version Interactive Discussion
ACPD
8, 3693–3720, 2008Measurements of UV irradiance within the area of one satellite
pixel P. Weihs et al. Title Page Abstract Introduction Conclusions References Tables Figures ◭ ◮ ◭ ◮ Back Close
Full Screen / Esc
Printer-friendly Version Interactive Discussion
Fig. 2a. Comparison of ground measurements performed at the 6 stations at noon during
ACPD
8, 3693–3720, 2008Measurements of UV irradiance within the area of one satellite
pixel P. Weihs et al. Title Page Abstract Introduction Conclusions References Tables Figures ◭ ◮ ◭ ◮ Back Close
Full Screen / Esc
Printer-friendly Version Interactive Discussion
Fig. 2b. Comparison of ground measurements performed at the 6 stations at noon during partly
ACPD
8, 3693–3720, 2008Measurements of UV irradiance within the area of one satellite
pixel P. Weihs et al. Title Page Abstract Introduction Conclusions References Tables Figures ◭ ◮ ◭ ◮ Back Close
Full Screen / Esc
Printer-friendly Version Interactive Discussion
Fig. 2c. Comparison of ground measurements performed at the six stations at noon during
ACPD
8, 3693–3720, 2008Measurements of UV irradiance within the area of one satellite
pixel P. Weihs et al. Title Page Abstract Introduction Conclusions References Tables Figures ◭ ◮ ◭ ◮ Back Close
Full Screen / Esc
Printer-friendly Version Interactive Discussion 0 0.05 0.1 0.15 0.2 0.25 0.3 0.35 0.4 0 0.05 0.1 0.15 0.2 0.25 0.3 0.35 0.4
Aerosol optical depth BOKU 500 nm
A e ro s o l o p ti c a l d e p th H T L 5 0 0 n m
Fig. 3. Comparison of aerosol optical depth measurements at station BOKU (1) and at station
ACPD
8, 3693–3720, 2008Measurements of UV irradiance within the area of one satellite
pixel P. Weihs et al. Title Page Abstract Introduction Conclusions References Tables Figures ◭ ◮ ◭ ◮ Back Close
Full Screen / Esc
Printer-friendly Version Interactive Discussion ± UVi = -1.9367AOD + 7.9804 6 6.5 7 7.5 8 8.5 9 0 0.1 0.2 0.3 0.4 0.5 0.6 0.7 0.8
Aerosol optical depth 367 nm
U V in d e x a fte r o zo n e h o m o g e n is a ti o n
Fig. 4. Dependence of UV index on aerosol optical depth. A homogenisation was performed
so that UV index is referred to a column ozone value of 300 DU. Solar zenith angle is equal to 30±1◦.
ACPD
8, 3693–3720, 2008Measurements of UV irradiance within the area of one satellite
pixel P. Weihs et al. Title Page Abstract Introduction Conclusions References Tables Figures ◭ ◮ ◭ ◮ Back Close
Full Screen / Esc
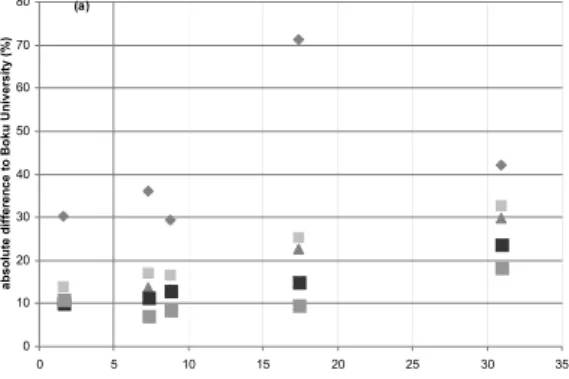
Printer-friendly Version Interactive Discussion (a) 0 10 20 30 40 50 60 70 80 0 5 10 15 20 25 30 35
distance to BOKU University (km)
a b s o lu te d iffe re n c e to B o k u U n iv e rs ity (% ) (b) 0 10 20 30 40 50 60 0 5 10 15 20 25 30 35
distance to BOKU University (km)
a b s o lu te d iffe re n c e to B o k u U n iv e rs ity (% ) 12:00 11:30-12:30 11:00-13:00 10:30-13:30 09:30-14:30
Fig. 5. Variability of UV index compared to BOKU UV index as a function of distance for
different averaging intervals. 12:00 is for momentaneous values, 11:30–12:30 is average from 1130 Local solar time (LST) to 12:30 LST, 11:00–13:00 is average from 11:00 LST to 13:00 LST, 10:30–13:30 is average from 10:30 LST to 13:30 LST, 09:30–14:30 is average from 09:30 LST to 14:30 LST. The distances correspond to the stations as denoted in Table 3.
ACPD
8, 3693–3720, 2008Measurements of UV irradiance within the area of one satellite
pixel P. Weihs et al. Title Page Abstract Introduction Conclusions References Tables Figures ◭ ◮ ◭ ◮ Back Close
Full Screen / Esc
Printer-friendly Version Interactive Discussion
Fig. 6a,b. Ratios of ground measurements to OMI observations during clear-sky (a), partly
cloudy (b) and totally overcast conditions (c) from May to July 2007. Following results of Sect. 3.1, for the clear sky comparisons momently values were used and for cloudy conditions 1 h averages were used.
ACPD
8, 3693–3720, 2008Measurements of UV irradiance within the area of one satellite
pixel P. Weihs et al. Title Page Abstract Introduction Conclusions References Tables Figures ◭ ◮ ◭ ◮ Back Close
Full Screen / Esc
Printer-friendly Version Interactive Discussion
ACPD
8, 3693–3720, 2008Measurements of UV irradiance within the area of one satellite
pixel P. Weihs et al. Title Page Abstract Introduction Conclusions References Tables Figures ◭ ◮ ◭ ◮ Back Close
Full Screen / Esc
Printer-friendly Version Interactive Discussion 1 1.05 1.1 1.15 1.2 1.25 1.3 1.35 1.4 1.45 0 0.1 0.2 0.3 0.4 0.5 0.6 0.7
Aerosol optical depth 368 nm
O MI /g ro u n d U V ra ti o SZA>=30 SZA<30
Fig. 7. Ratio of satellite retrieved to ground measured (BOKU station) erythemal UV for clear