HAL Id: inserm-02483088
https://www.hal.inserm.fr/inserm-02483088
Submitted on 18 Feb 2020HAL is a multi-disciplinary open access archive for the deposit and dissemination of sci-entific research documents, whether they are pub-lished or not. The documents may come from teaching and research institutions in France or abroad, or from public or private research centers.
L’archive ouverte pluridisciplinaire HAL, est destinée au dépôt et à la diffusion de documents scientifiques de niveau recherche, publiés ou non, émanant des établissements d’enseignement et de recherche français ou étrangers, des laboratoires publics ou privés.
Force Control After Stroke
Gaia Valentina Pennati, Jeanette Plantin, Loïc Carment, Pauline Roca,
Jean-Claude Baron, Elena Pavlova, Jörgen Borg, Påvel Lindberg
To cite this version:
Gaia Valentina Pennati, Jeanette Plantin, Loïc Carment, Pauline Roca, Jean-Claude Baron, et al.. Recovery and Prediction of Dynamic Precision Grip Force Control After Stroke. Stroke, American Heart Association, 2020, �10.1161/STROKEAHA.119.026205�. �inserm-02483088�
Title
Recovery and prediction of dynamic precision grip force control after stroke
Authors
Gaia Valentina Pennati, MD1, Jeanette Plantin, MSc1, Loïc Carment, PhD2, Pauline Roca3,
PhD, Jean-Claude Baron3, MD, PhD, Elena Pavlova, PhD1, Jörgen Borg, MD, PhD1, Påvel G
Lindberg, PhD1, 2
1Karolinska Institutet, Department of Clinical Sciences, Danderyd Hospital, Division of
Rehabilitation Medicine, Stockholm, Sweden
2Institut de Psychiatrie et Neurosciences de Paris, Inserm U1266, Paris, France
3Institut de Psychiatrie et Neurosciences de Paris, Inserm U1266, Hôpital Sainte-Anne,
Université Paris Descartes, Paris, France
Corresponding author
Gaia Valentina Pennati, Division of Rehabilitation Medicine, Danderyd Hospital, SE-18288
Stockholm, Sweden
Tel.: +46722779072; E-mail: gaia.valentina.pennati@ki.se
Cover Title
Precision grip recovery after stroke
Total number of tables and figures
Tables 2; Figures 3
Keywords
Stroke/Complication; Recovery of function; Predictions and Projections; Brain Imaging;
Corticospinal Tract
Cerebrovascular Disease/Stroke; Rehabilitation; Prognosis; Quality and Outcomes; Magnetic
Resonance Imaging
Word Count
Abstract
Background and Purpose: Dexterous object manipulation, requiring generation and control of
finger forces, is often impaired after stroke. This study aimed to describe recovery of precision
grip force control after stroke, and to determine clinical and imaging predictors of 6 month
performance.
Methods: 80 first ever stroke patients with varying degrees of upper limb weakness were
evaluated at 3 weeks, 3 and 6 months after stroke. Twenty-three healthy individuals of
comparable age were also studied. The Strength-dexterity test was used to quantify index finger
and thumb forces during compression of springs of varying length in a precision grip. The
coordination between finger forces (CorrForce), along with Dexterity-score and
Repeatability-score were calculated. Anatomical MRI was used to calculate weighted corticospinal tract
lesion load (wCST-LL).
Results: CorrForce, Dexterity-score and Repeatability-score in the affected hand were
dramatically lower at each time point compared to the less-affected hand and the control group,
even in patients with mild motor impairment according to Fugl-Meyer assessment. Improved
performance over time occurred in CorrForce and Dexterity-score but not in
Repeatability-score. The Fugl-Meyer hand subscale, sensory function and wCST-LL best predicted
CorrForce and Dexterity-score status at 6 months (R2 .56 and .87, respectively). wCST-LL
explained most of the variance in CorrForce (R2 .34) and Dexterity-score (R2 .50) at 6 months.
Absence of recovery in CorrForce was predicted by wCST-LL> 4 cc and in Dexterity-score by
wCST-LL> 6 cc.
Conclusions: Findings highlight persisting deficits in the ability to grasp and control finger
forces after stroke. Sensory and motor hand impairments together with wCST-LL can predict
performance at 6 months and degree of CST lesion alone predicts lack of post stroke precision
Clinical Trial Registration–URL: http://www.clinicaltrials.gov. Unique identifier:
Introduction
Impaired fine motor control of fingers is common after stroke, reducing the ability to grasp and
manipulate objects and negatively impacting daily activities and quality of life.1 Accurate
evaluation of precision grip (i.e., the ability to grasp an object between the tactile pads of the
thumb and fingertips) is therefore likely to be important for prognosis and for the development
of targeted upper limb interventions. Post stroke precision grip deficits, when grasping stable
objects, have been well characterized and include impaired dosing of force (to the object being
manipulated) and loss of coordination of grip and lift (upward) forces.2, 3 However, few studies
have described dynamic finger force control (i.e., the ability to appropriately generate
dynamically scaled and directed force by the digits while grasping unstable objects), which is
frequently affected after stroke4, or its longitudinally recovery5, 6, leaving many aspects unclear.
The first aim of the present longitudinal study of 80 individuals with first ever stroke was to
describe the recovery of dexterous manipulation as assessed by the Strength-dexterity test. This
test allows to quantify the dynamic interaction between fingertip forces and measures the
ability to stabilize an unstable object in a precision grip7. In addition, the coordination between
finger forces (CorrForce), the ability to dynamically adapt applied finger forces
(Dexterity-score) and the reproducibility of performance (Repeatability-(Dexterity-score) were also investigated.
Since force generation is usually more compromised distally after stroke8 and differs in time
course of recovery from individuated finger control9, 10, we hypothesized that precision grip
force control measures would show a proportionally greater impairment compared to maximal
power or pinch grip force and to upper limb motor impairment measured with the Fugl-Meyer
assessment. The present study’s second aim was to identify best predictors of both 6-month
status and longitudinal recovery in precision grip force control after stroke. Based on previous
corticospinal tract (CST)9, 11, 12, but also that the best prediction model would additionally
include measures of hand sensory12, 13 and motor impairment14.
Methods
The data supporting this study findings are available from the corresponding author upon
reasonable request.
Study design and participants
Eighty post stroke subjects (57 male; age 52.7±9.4 years) admitted as inpatients to the
Department of Rehabilitation Medicine at Danderyd Hospital, Stockholm, Sweden with a
first-ever CT or MRI-verified stroke and upper limb muscle weakness (score≤ 4/5 on Manual
Muscle Testing) were included. Exclusion criteria included history of any other neurological
or rheumatologic disorders of the hand, cerebellar lesions, contraindications to MRI scan, and
severe cognitive dysfunction. Twenty-three healthy adult individuals of comparable age (11
male; age 46.9±13.1 years) and with no history of neurological disease constituted a control
group. Assessments in stroke patients were conducted bilaterally at 2-6 weeks (mean time 3
weeks, T1), three (T2) and 6 months (T3) after injury, and with the dominant hand in the
healthy individuals.
Written informed consent was obtained from all participants. The study was approved by the
Regional Ethical Review Board in Stockholm (DNR: 2011/1510-31/3). All procedures
complied with the Declaration of Helsinki.
Clinical measures
Fugl-Meyer assessment of the upper extremity (FMA-UE) was used to measure upper limb
motor function (excluding the three reflex-items, yielding a maximum of 60 points).15 Motor
impairment levels were defined as: severe= 0-12, severe-moderate= 13-30, moderate-mild=
(BBT) and compared to normative data (please see http://stroke.ahajournals.org), maximum
voluntary contraction (MVC) in power grip with the Jamar isometric dynamometer (Digital
Hand Dynamometer, Saeham, South Korea) and in key-pinch with the Jamar pinch gauge
(Pinch Gauge, B&L Engineering, USA). Tactile sensation of finger tips was examined with the
Semmes-Weinstein Monofilament (North Coast Medical, Inc., USA) (from 0= absent
sensation, to 5= normal sensation). Two-point (2p) discrimination was measured at the thumb
and index finger tips with the Dellon-McKinnon Disk-Criminator (0= total absence of
sensation, 1= perceived stimuli at a distance ≥ 12 mm, 2= ≥ 7 mm and 3= < 7mm, considered
normal sensation).
Strength-dexterity test and performance measures
The Strength-dexterity test allows quantification of the dynamic regulation of fingertip forces
during a pinch task.17 The method measures the ability to compress and control a variety of
springs (N= 8) which are unstable and prone to buckling and with diverse length (free length
from 1.80 cm of spring 8 to 4.60 cm of spring 1), and therefore with different demands on
strength and dexterity (spring 8= easiest, spring 1= most difficult to compress).
Dynamic index finger and thumb forces were recorded using two force sensors (unit:
gram-force, gf)17, and analyzed off-line using Matlab R2017B (MathWorks, Natick, MA, USA).
Coordination of index finger and thumb forces was investigated by calculating a correlation
coefficient between force signals (CorrForce).
A Dexterity-score was calculated:
where Max Spr= force required for full compression of that spring, Test Spr= average of
maximal sustained compression forces achieved with the test spring, ∑7𝑖=0𝑀𝑎𝑥 𝑆𝑝𝑟 (8 – i)= sum over the eight springs of the forces required to compress to solid length, m= spring number
𝐷𝑒𝑥𝑡𝑒𝑟𝑖𝑡𝑦 − 𝑠𝑐𝑜𝑟𝑒 = ∑𝑚𝑖=0 𝑀𝑎𝑥 𝑆𝑝𝑟 (8 − 𝑖) + 𝑇𝑒𝑠𝑡 𝑆𝑝𝑟 (8 − 𝑚 − 1) ∑7 𝑀𝑎𝑥 𝑆𝑝𝑟
(-1≤ m< 6). The Dexterity-score indicates the maximal level of instability that the patient’s
sensorimotor system is able to control, and higher values reflect better performance. The
previous formula17 was modified excluding dead bands of compression force of the test spring
(i.e., the regions in the beginning and end of the compression range), to account for the
characteristics of this study population in the sub-acute phase after stroke, which was mostly
unable to maintain the subsequent longer spring in spite of the ability to produce enough force.
A Repeatability-score, evaluating the reproducibility of performance across the ten trials, was
computed:
where SD Test Spr= standard deviation of the average of maximal sustained compression
forces achieved with the test spring, Max Spr= force required for full compression of that
spring, m= spring number (-1≤ m< 6). A high Repeatability-score indicated that the subject
was able to reproduce similar dynamic force compression across trials.
Patients unable to perform dynamic compressions were assigned values equal to 0 for
CorrForce and Dexterity-score, indicating complete loss of precision grip.
For details on assessment procedure, please see Supplemental Material
http://stroke.ahajournals.org.
Magnetic Resonance Imaging
Brain imaging was performed at T1 with an Ingenia 3.0T MR-system (www.usa.philips.com)
with an 8HR head coil. High resolution T1-weighted anatomical images were acquired using
TFE 3D (3D gradient echo-based sequence): FOV 250x250x181 mm, matrix 228x227, slice
thickness 1.2 mm, slice spacing 0.6 mm and number of slices 301 (Echo time= shortest,
relaxation time= shortest). T2 FLAIR images were also acquired.
Lesion maps
𝑅𝑒𝑝𝑒𝑎𝑡𝑎𝑏𝑖𝑙𝑖𝑡𝑦 − 𝑠𝑐𝑜𝑟𝑒 = 1 − 𝑆𝐷 𝑇𝑒𝑠𝑡 𝑆𝑝𝑟 (8 − 𝑚 − 1) 𝑀𝑎𝑥 𝑆𝑝𝑟 (8 − 𝑚 − 1)
Before delineating lesion maps, T1-weighted images were normalized to MNI template using
SPM12 (www.fil.ion.ucl.ac.uk/spm/software/spm12/). Cost function masking was used to
avoid distortion of lesion by normalization procedure18, and the images were inspected visually
to rule out poor normalization. Lesion maps were manually drawn on all axial slices of
normalized T1 anatomical images using MRIcron
(http://people.cas.sc.edu/rorden/mricron/index.html/) by researcher (PL) and verified by
experienced neurologist (JCB) who were blinded to all clinical data except the lesioned
hemisphere. Lesion location was verified on FLAIR images and lesion maps were binarized.
Lesion volume (unit: cubic centimeter, cc) was calculated using MRIcron. Lesion maps were
used to calculate weighted corticospinal tract lesion load (wCST-LL; unit: cubic centimetre,
cc)19 using previously constructed CST template based on regions of interest in the precentral
gyri, posterior limb of internal capsule, cerebral peduncle and anteromedial pons.20
Statistical analysis
Group differences and effect of time were investigated using one way-ANOVA and two-way
repeated measures ANOVAs. Bonferroni’s post-hoc procedure was computed for mean
comparisons. Spearman’s rank order correlation test (Spearman’s Rho, rs) was used to
investigate relations between force control, clinical and MRI measures.
A multivariable linear regression analysis was performed to predict precision grip impairment
at 6 months using the most significant clinical and imaging variables identified in the
correlation analysis. Hierarchical linear regression models, in which wCST-LL was entered
first, were used to ascertain the unique variance accounted for by the clinical variables.
Proportional recovery scores in precision grip measures were calculated.21 The study
population was then divided into two groups, with recovery (recoverypos, score> 0) and absence
of recovery (recoveryabs, score≤ 0), and univariate logistic regression models were performed
The significance level was set at p≤ .05. All statistical analyses were performed using SPSS
Statistics for Windows, Version 25.0 (Armonk, NY: IBM Corp). Predictive models were
verified by leave-one-out cross-validation using R, Version 3.6.0 (R Core Team).
Results
Clinical measures
FMA-UE showed moderate-severe upper limb motor impairment in stroke patients, as shown
in Table 1. Measures of sensory and motor functions were significantly reduced in the affected
hand compared to the less-affected hand. BBT revealed number of patients with impaired gross
manual dexterity, including in the less-affected side (n= 41 at T1 and n= 26 at T3).
Precision grip force control
Precision grip force profiles are shown in Figure 1. Dynamic compression forces were lower
in amplitude and less stable in the affected hand and characterized by poor correlation between
index finger and thumb forces (reduced CorrForce). Healthy subjects performed the
Strength-dexterity test with an average of sustained compression force of 146.63 gf, and stroke patients
at T1 with 109.51 gf with the less-affected hand and 43.7 gf with the affected hand.
There was a statistically significant difference between groups in CorrForce, Dexterity-score
and Repeatability-score [GROUP: F(2, 168)= 62.54, p< .001; F(2, 168)= 122.08, p< .001 and
F(2, 130)= 7.51, p< .005, respectively]. Post-hoc tests revealed that the three variables were
significantly lower in the affected hand compared to the less-affected side and to the healthy
control group (p< .001). No significant difference between the less-affected hand and the
control group was detected in the measures.
CorrForce and Dexterity-score improved over time in stroke patients [TIME: F(2, 224)=
4.4569, p= .01265; F(2, 224)= 12.417, p< .001, respectively]. (Figure 2) Dexterity-score
whereas CorrForce showed a more gradual increase, with a significant difference between T1
vs T3 only (p< .005). Despite the improvement over time, both values remained significantly
lower compared to the less-affected side at T3 (p< .001). Moreover, of the 33 patients with
mild degree of residual impairment in FMA-UE at T3, four (12%) continued having
pathological values in CorrForce and eleven (33%) in Dexterity-score (i.e.,< mean – 2SD of
healthy subjects). (Figure 3) Repeatability-score in the affected-hand did not change
significantly over time after stroke.
Relation between clinical scales and precision grip force control in the affected hand
Age and dominant hand being affected by the stroke (in 41.3% of patients) did not significantly
correlate with any force control variables. Both CorrForce and Dexterity-score correlated
significantly with motor and sensory impairment measures at each time point (corrected for
multiple comparisons). At T1, CorrForce correlated strongly with FMA-UE and FMA-Hand
(rs= .80 and rs= .86, p< .01), and with other clinical assessments of motor and sensory
impairments. Similarly, Dexterity-score at T1 strongly correlated with FMA-UE and FM-Hand
(rs= .86 and rs= .91, p< .01), and other motor and sensory impairments (please see
http://stroke.ahajournals.org).
Relation between brain lesion and precision grip force control in the affected hand
Lesion volume (mean= 116.88±147.79 cc) correlated negatively and weakly with FMA-Hand
(rs= -.30, p< .01) and precision grip control measures (rs< -.30, p< .05) at T1. At T3, lesion
volume correlated just moderately with CorrForce (rs= -.37, p< .01) and did not significantly
with Dexterity-score. The wCST-LL (mean= 3.83±3.51 cc) showed enhanced negative
correlation with CorrForce (rs= -.56, p< .01) and Dexterity-score (rs= -.58, p< .01). These
relationships were even stronger at T3: CorrForce (rs= .62, p< .01) and Dexterityscore (rs=
-.72, p< .01).
Significant regression equations were found for predicting precision grip force control status
at T3 (please see http://stroke.ahajournals.org). FMA-Hand, 2p Discrimination test and
wCST-LL emerged as highly significant predictors for both CorrForce (F(3,54)= 22.625, p< .005 with
an R2 of .557) and Dexterity-score (F(3,54)= 125.186, p< .005 with an R2 of .874). The
cross-validated coefficients of determination (R2) for CorrForce and Dexterity-score were .482 and
.854, respectively. Hierarchical models (Table 2) indicated that wCST-LL alone explained
most of CorrForce (R2= .344) and Dexterity-score (R2= .502) at 6 months. It also showed that
FMA-Hand and 2p Discrimination together accounted for a significant additional portion of
the variance in CorrForce (R2 =.213) and Dexterity-score (R2 =.373).
Prediction of probability of positive recovery in precision grip force control
Thirty-three (52%) patients improved to some extent in CorrForce from T1 to T3 and
thirty-nine (64%) patients in Dexterity-score. Univariate logistic regression models revealed that
wCST-LL was the most significant predictor for both recoverypos in CorrForce and
Dexterity-score (X2= 6.530, df= 1 and p= .011, and X2= 11.307, df= 1 and p= .001, respectively). The
predictive model for recovery in CorrForce explained 14.5% (Nagelkerke R2) of the variance
in CorrForce recovery and correctly classified 61.4% of cases. The predictive model for
recovery in Dexterity-score explained 25.0% of the variance in recovery and gave an overall
correct prediction rate of 78.9%. The predictive accuracy of the model for recovery in
CorrForce was 61.4% and for the model for recovery in Dexterity-score was 78.9% (please see
http://stroke.ahajournals.org). Higher wCST-LL was associated with a reduced likelihood of
recovering CorrForce and Dexterity-score (odds ratio .793, 95% CI: .657 - .959, p= .017, and
odds ratio .724, 95% CI: .589 - .891, p= .002, respectively). Thus, every 1-cc increase in
wCST-LL decreased the odds of having recoverypos in CorrForce by about 21%, and by about 28% in
Dexterity-score. The critical value in wCST-LL from the logistic regression that predicted
Of all the patients with wCST-LL values greater than 4.42 cc, 60% presented no positive
change in CorrForce while 77% of the patients with a lesion broader than 6.14 cc had no
recovery in Dexterity-score.
Discussion
Recovering stroke patients had major difficulties in ability to grasp and control the springs, to
coordinate finger forces and to perform reproducibly across trials. Although patients improved
over time, many remained impaired in the precision grip force control at 6 months after stroke
even in case of good overall upper limb and hand sensorimotor status as measured with clinical
measures. Sensorimotor impairments early after stroke and CST lesion load predicted precision
grip force control at 6 months and CST lesion load alone was a significant predictor of whether
patients would be likely to recover force control during first 6 months post-stroke.
Precision grip recovery
Precision grip performance recovered relatively poorly over time in the affected hand, with
24% of patients unable to perform the Strength-dexterity test at T3. CorrForce and
Dexterity-score measures improved, but values remained pathological in 39% and 67% of the patients,
respectively (far from healthy control performance, Figure 2). In addition, recovery in
Repeatability-score was not significant at group level. Decreased performance was even
evident in patients with maximal FMA-Hand score (n= 16 at T1 and n= 31 at T3). Individual
observations (Figure 3) indicate clinically relevant motor recovery at T3 as measured by
FMA-UE despite remaining impairment in fine grip force control and fine manipulative tasks. The
slower recovery in correlation of finger forces (compared to Dexterity-score) and the reduced
prediction of this measure, support previous reports showing that recovery of strength occurs
faster and mainly within the first 3 months after stroke compared to other aspects, such as the
A compromised ability to control dynamic grip forces was also identified in the less-affected
hand, in accordance with previous studies22 and possibly due to disruption of ipsilesional
projections of the CST, disinhibition of the non-lesioned hemisphere or disturbance of bilateral
frontoparietal-cerebellar networks.
Mechanism underlying impaired precision grip force control
Main predictors of poor precision grip force control at 6 months were hand motor impairment,
sensory impairment and CST lesion load. The hierarchical regression analysis confirmed our
hypothesis that the wCST-LL was the most significant predictor11 and that sensory function
and hand motor impairments explained additional variance of grip force control, extending
knowledge on predictors of functional outcomes post-stroke.23-28
The degree of lesion to the CST was a key predictor of precision grip force control at 6 months
after stroke, reflecting the essential role of CST for fine motor control, especially for precision
grip performance and finger individuation.9, 12, 29 CST lesion load was the only significant
predictor of positive change in precision grip control from 3 weeks to 6 months post-stroke.30, 31 This suggests that neurobiological processes involving residual CST integrity are critical for
recovery of fine motor control of fingers after stroke. This is also supported by studies showing
motor improvements in stroke patients recovering motor evoked potentials.20, 32 Quantitatively,
however, the moderate predictive value of CST lesion load for recovery of precision grip force
control points also to the likely contribution of other neural substrates and multiple pathways
in support of the recovery process33, such as cortico-cortical connections34, 35, cortico-basal
ganglia loops and other descending motor pathways such as the reticulospinal tract.9 The
FMA-Hand scores, in the predictive model with lesion load and sensory function, may be considered
a surrogate measure of these other contributory factors.
Findings also confirms the importance of early sensory status after stroke for recovery of
sensation and/or in proprioception in the affected hand at three weeks after stroke. This was
highly related with poor performance on the Strength-dexterity test at each time point. In
manipulation of deformable or unstable objects, such as a compressed spring, somatosensory
and visual feedbacks are critical for controlling the direction of fingertip force vectors.37
Impaired sensory function due to aging or stroke likely explains some of the decline in
dexterous manipulation38, 39 and has recently been shown to predict gains from robotic therapy
in the chronic phase post-stroke.40
Limitations
The timing of the first evaluation varied some between patients (2-6 weeks after stroke) but the
variability was low for this kind of longitudinally study and did not affect predictive models.
It is recalled that a wCST-LL of 1.0 cc in the centrum semiovale has a different impact
compared to a 1.0 cc lesion at the level of internal capsule, due to a higher concentration of
CST fibers in the latter. Transcranial magnetic stimulation would have been useful to evaluate
presence of a motor evoked potential, shown to be valuable for the prediction of hand
impairment according to the Action Research Arm Test.26 Since reliability of the
Strength-dexterity test has not been assessed in stroke patients, further studies are desirable. It is
important to note that the study sample was a relatively young stroke group (mean age 52.70
years), which makes it difficult to generalize the results to the entire stroke population.
Conclusions
The current study provides evidence of impaired precision grip in the affected hand over the
first 6 months after stroke, even in patients with no or mild-upper limb motor impairment. Early
sensory and motor hand impairments and CST lesion load can predict late precision grip
deficits. wCST-LL was also related to longitudinal recovery in precision grip control. Finally,
assessment, as with the Strength-dexterity test, to detect impairments otherwise unrecognized
that might impact the recovery of a useful hand after stroke.
Acknowledgements
We express our appreciation to the patients who participated in this study and their families.
We thank the medical team of the Division of Rehabilitation Medicine, Danderyd Hospital that
contributed to recruitment of patients and provided communication materials.
Sources of Funding
This study was supported by Grant from Lars Hedlund (Karolinska Institutet Dnr
2-1582/2016), Promobilia Foundation, STROKE-Riksförbundet and NEURO Sweden.
Disclosures
PGL is a shareholder in the company Aggero MedTech AB manufacturing a measurement
instrument for spasticity and has patented a method for measurement of manual dexterity
(EP2659835A1). He declares no conflict of interest with the present work.
References
1. Ekstrand E, Rylander L, Lexell J, Brogardh C. Perceived ability to perform daily hand
activities after stroke and associated factors: A cross-sectional study. BMC neurology.
2016;16:208
2. Allgower K, Hermsdorfer J. Fine motor skills predict performance in the jebsen taylor
hand function test after stroke. Clin. Neurophysiol. 2017;128:1858-1871
3. Nowak DA. The impact of stroke on the performance of grasping: Usefulness of kinetic
and kinematic motion analysis. Neurosci. Biobehav. Rev. 2008;32:1439-1450
4. Seo NJ, Rymer WZ, Kamper DG. Altered digit force direction during pinch grip
5. Kurihara J, Lee B, Hara D, Noguchi N, Yamazaki T. Increased center of pressure
trajectory of the finger during precision grip task in stroke patients. Exp Brain Res.
2019;237:327-333
6. Pavlova EL, Borg J. Impact of tactile sensation on dexterity: A cross-sectional study of
patients with impaired hand function after stroke. J. Mot. Behav. 2018;50:134-143
7. Valero-Cuevas FJ, Smaby N, Venkadesan M, Peterson M, Wright T. The
strength-dexterity test as a measure of dynamic pinch performance. Journal of biomechanics.
2003;36:265-270
8. Colebatch JG, Gandevia SC. The distribution of muscular weakness in upper motor
neuron lesions affecting the arm. Brain : a journal of neurology. 1989;112 ( Pt
3):749-763
9. Xu J, Ejaz N, Hertler B, Branscheidt M, Widmer M, Faria AV, et al. Separable systems
for recovery of finger strength and control after stroke. J. Neurophysiol.
2017;118:1151-1163
10. Lang CE, Wagner JM, Edwards DF, Sahrmann SA, Dromerick AW. Recovery of grasp
versus reach in people with hemiparesis poststroke. Neurorehabil Neural Repair.
2006;20:444-454
11. Feng W, Wang J, Chhatbar PY, Doughty C, Landsittel D, Lioutas VA, et al.
Corticospinal tract lesion load: An imaging biomarker for stroke motor outcomes.
Annals of neurology. 2015;78:860-870
12. Wolbrecht ET, Rowe JB, Chan V, Ingemanson ML, Cramer SC, Reinkensmeyer DJ.
Finger strength, individuation, and their interaction: Relationship to hand function and
corticospinal tract injury after stroke. Clin. Neurophysiol. 2018;129:797-808
13. Semrau JA, Herter TM, Scott SH, Dukelow SP. Examining differences in patterns of
14. Hoffmann G, Conrad MO, Qiu D, Kamper DG. Contributions of voluntary activation
deficits to hand weakness after stroke. Topics in stroke rehabilitation. 2016;23:384-392
15. Woodbury ML, Velozo CA, Richards LG, Duncan PW, Studenski S, Lai SM.
Dimensionality and construct validity of the fugl-meyer assessment of the upper
extremity. Arch Phys Med Rehabil. 2007;88:715-723
16. Woytowicz EJ, Rietschel JC, Goodman RN, Conroy SS, Sorkin JD, Whitall J, et al.
Determining levels of upper extremity movement impairment by applying a cluster
analysis to the fugl-meyer assessment of the upper extremity in chronic stroke. Arch
Phys Med Rehabil. 2017;98:456-462
17. Dayanidhi S, Hedberg A, Valero-Cuevas FJ, Forssberg H. Developmental
improvements in dynamic control of fingertip forces last throughout childhood and into
adolescence. J Neurophysiol. 2013;110:1583-1592
18. Brett M, Leff AP, Rorden C, Ashburner J. Spatial normalization of brain images with
focal lesions using cost function masking. NeuroImage. 2001;14:486-500
19. Zhu LL, Lindenberg R, Alexander MP, Schlaug G. Lesion load of the corticospinal
tract predicts motor impairment in chronic stroke. Stroke. 2010;41:910-915
20. Birchenall J, Teremetz M, Roca P, Lamy JC, Oppenheim C, Maier MA, et al. Individual
recovery profiles of manual dexterity, and relation to corticospinal lesion load and
excitability after stroke -a longitudinal pilot study. Neurophysiologie clinique =
Clinical neurophysiology. 2019;49:149-164
21. Prabhakaran S, Zarahn E, Riley C, Speizer A, Chong JY, Lazar RM, et al.
Inter-individual variability in the capacity for motor recovery after ischemic stroke.
22. Semrau JA, Herter TM, Kenzie JM, Findlater SE, Scott SH, Dukelow SP. Robotic
characterization of ipsilesional motor function in subacute stroke. Neurorehabil. Neural
Repair. 2017;31:571-582
23. Stinear CM, Barber PA, Petoe M, Anwar S, Byblow WD. The prep algorithm predicts
potential for upper limb recovery after stroke. Brain : a journal of neurology.
2012;135:2527-2535
24. Stinear CM, Byblow WD, Ward SH. An update on predicting motor recovery after
stroke. Annals of physical and rehabilitation medicine. 2014;57:489-498
25. Nijland RH, van Wegen EE, Harmeling-van der Wel BC, Kwakkel G. Presence of
finger extension and shoulder abduction within 72 hours after stroke predicts functional
recovery: Early prediction of functional outcome after stroke: The epos cohort study.
Stroke. 2010;41:745-750
26. Stinear CM, Byblow WD, Ackerley SJ, Smith MC, Borges VM, Barber PA. Prep2: A
biomarker-based algorithm for predicting upper limb function after stroke. Annals of
clinical and translational neurology. 2017;4:811-820
27. Kim B, Winstein C. Can neurological biomarkers of brain impairment be used to predict
poststroke motor recovery? A systematic review. Neurorehabil Neural Repair.
2017;31:3-24
28. Boyd LA, Hayward KS, Ward NS, Stinear CM, Rosso C, Fisher RJ, et al. Biomarkers
of stroke recovery: Consensus-based core recommendations from the stroke recovery
and rehabilitation roundtable. International Journal of Stroke. 2017;12:480-493
29. Lemon RN. Descending pathways in motor control. Annual review of neuroscience.
2008;31:195-218
30. Riley JD, Le V, Der-Yeghiaian L, See J, Newton JM, Ward NS, et al. Anatomy of
31. Burke Quinlan E, Dodakian L, See J, McKenzie A, Le V, Wojnowicz M, et al. Neural
function, injury, and stroke subtype predict treatment gains after stroke. Annals of
neurology. 2015;77:132-145
32. Byblow WD, Stinear CM, Barber PA, Petoe MA, Ackerley SJ. Proportional recovery
after stroke depends on corticomotor integrity. Annals of neurology. 2015;78:848-859
33. Rondina JM, Park CH, Ward NS. Brain regions important for recovery after severe
post-stroke upper limb paresis. Journal of neurology, neurosurgery, and psychiatry.
2017;88:737-743
34. Schulz R, Koch P, Zimerman M, Wessel M, Bonstrup M, Thomalla G, et al.
Parietofrontal motor pathways and their association with motor function after stroke.
Brain : a journal of neurology. 2015;138:1949-1960
35. Rinne P, Hassan M, Fernandes C, Han E, Hennessy E, Waldman A, et al. Motor
dexterity and strength depend upon integrity of the attention-control system.
Proceedings of the National Academy of Sciences of the United States of America.
2018;115:E536-e545
36. Meyer S, De Bruyn N, Krumlinde-Sundholm L, Peeters A, Feys H, Thijs V, et al.
Associations between sensorimotor impairments in the upper limb at 1 week and 6
months after stroke. J. Neurol. Phys. Ther. 2016;40:186-195
37. Johansson RS, Flanagan JR. Coding and use of tactile signals from the fingertips in
object manipulation tasks. Nature reviews. Neuroscience. 2009;10:345-359
38. Dayanidhi S, Valero-Cuevas FJ. Dexterous manipulation is poorer at older ages and is
dissociated from decline of hand strength. The journals of gerontology. Series A,
Biological sciences and medical sciences. 2014;69:1139-1145
39. Lindberg P, Ody C, Feydy A, Maier MA. Precision in isometric precision grip force is
40. Ingemanson ML, Rowe JR, Chan V, Wolbrecht ET, Reinkensmeyer DJ, Cramer SC.
Somatosensory system integrity explains differences in treatment response after stroke.
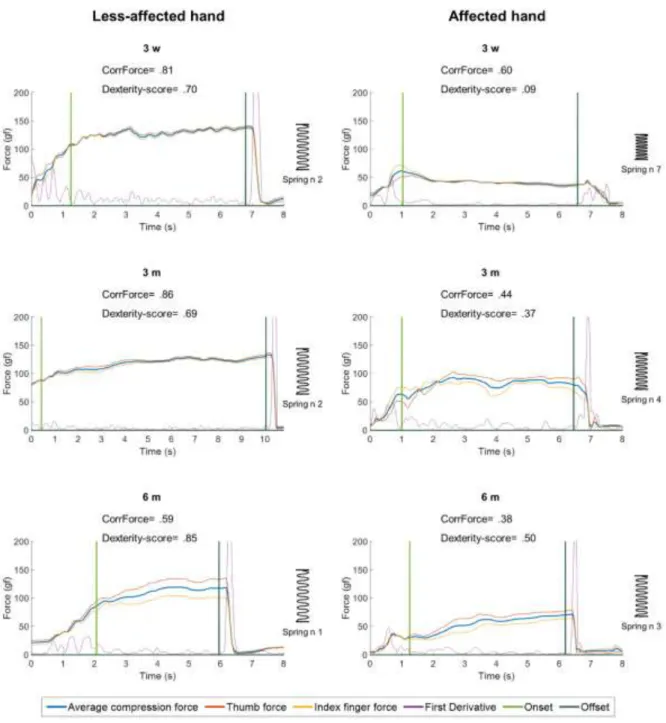
Figure 1. Dynamic compression force profiles acquired in a patient with the less-affected hand
and affected hand at 3 weeks, 3 and 6 months after stroke. Springs of increasing length and
higher strength and dexterity requirement were compressed at each time point (spring 8=
easiest; spring 1= hardest). Force data from the thumb (red line) and index finger (yellow) and
the average compression force (blue) are shown. Less well stabilized profile with a lower
affected hand. The difference in CorrForce is noticeable between the two hands early after
stroke (0.70 versus 0.09).
Figure 2. Effect of time on CorrForce (A) and Dexterity-score (B) in the affected hand (Solid
circles) and less-affected hand (Hollow square). Vertical bars denote 95% confidence intervals.
CorrForce significantly differed between 3 weeks and 6 months in the affected hand;
Dexterity-score significantly improved at 3 months and then at 6 months in the affected hand. No
significant differences in precision hand grip were detected over time in the less-affected side.
Figure 3. Correlation between Fugl-Meyer assessment of the upper extremity (FMA-UE) and
CorrForce (A) and Dexterity-score (B) measured with the affected hand at 6 months after
stroke. Four levels of upper limb motor impairment are displayed according to FMA-UE score:
severe= 0-12 (n= 26), severe-moderate= 13-30 (n= 5), moderate-mild= 31-47 (n= 11) and
Dexterity-score values defined in the healthy subjects. Note the mismatch between recovery in
FMA-UE and precision grip scores: patients showing full recovery or mild impairment in upper
limb motor function still had reduced CorrForce (n= 4) or Dexterity-score (n= 11) values
Table 1. Baseline participants' characteristics
Patients (N= 80) Healthy subjects (N= 23) Affected side Less-affected side
Age, years, mean±SD 52.70±9.46 46.91±13.12
Sex (male / female), n (%) 57 (71.3) / 23 (28.7) 11 (47.8) / 12 (52.2)
Stroke hemisphere (left / right), n (%) 30 (37.5) / 50 (62.5) Stroke type (ischemic / haemorrhagic), n (%) 55 (68.8) / 25 (31.3) Hand dominance (affected / non-affected), n (%) 33 (41.3) / 45 (56.3) NIHSS, mean±SD 7.55±5.50 wCST-LL, cc, mean±SD 3.83±3.51 FMA-UE, mean±SD 23.53±23.09 FMA-Hand, mean±SD 5.59±6.00 FMA-Proprioception, mean±SD 4.19±3.48 BBT, mean±SD 15.35±21.48 50.99±14.03
2p Discrimination test, median (IQR) 0 (0-2) 2 (2-2)
Monofilament test, median (IQR) 4 (0-8) 9 (8-10)
Power grip MVC, mean±SD 10.35±13.86 35.3±10.45 41.59±10.63
Key-pinch MVC, mean±SD 2.72±3.47 8.98±2.37 9.75±1.91
IQR= Interquartile Range. NIHSS= National Institutes of Health Stroke Scale; wCST-LL=
extremity; FMA-Hand= Meyer assessment hand subscale; FMA-Proprioception=
Fugl-Meyer assessment sensation, position subscale; BBT= Box & Block Test; 2p Discrimination
Table 2. Hierarchical Regression Analysis for variables predicting CorrForce and Dexterity-score
R2 R2 change B Beta Sig.
CorrForce Model 1 wCST-LL .344 -.076 -.587 .000* .000* Model 2 wCST-LL 2p Discrimination test .511 .166 -.056 .150 -.429 .437 .000* .000* .000* Model 3 2p Discrimination test FMA-Hand wCST-LL .557 .046 .098 .023 -.032 .285 .349 -.248 .000* .018* .021* .049* Dexterity-score Model 1 wCST-LL .502 -.073 -.708 .000* .000* Model 2 wCST-LL 2p Discrimination test .680 .178 -.056 .122 -.544 .453 .000* .000* .000* Model 3 FMA-Hand wCST-LL 2p Discrimination test .874 .195 .036 -.018 .038 .716 -.175 .141 .000* .010* .027*
*p< .05. wCST-LL= weighted corticospinal tract lesion load; 2p Discrimination test=