HAL Id: hal-01592045
https://hal.archives-ouvertes.fr/hal-01592045
Submitted on 5 Oct 2017
HAL is a multi-disciplinary open access
archive for the deposit and dissemination of
sci-entific research documents, whether they are
pub-lished or not. The documents may come from
teaching and research institutions in France or
abroad, or from public or private research centers.
L’archive ouverte pluridisciplinaire HAL, est
destinée au dépôt et à la diffusion de documents
scientifiques de niveau recherche, publiés ou non,
émanant des établissements d’enseignement et de
recherche français ou étrangers, des laboratoires
publics ou privés.
Modeling a bacterial ecosystem through chemotaxis
simulation of a single cell
Nesrine Ouannes, Nouredinne Djedi, Yves Duthen, Hervé Luga
To cite this version:
Nesrine Ouannes, Nouredinne Djedi, Yves Duthen, Hervé Luga. Modeling a bacterial ecosystem
through chemotaxis simulation of a single cell. Symposium on Artificial Life And Robotics (ICAROB
2016), Jan 2016, Beppu, Japan. pp. 1-6. �hal-01592045�
O
pen
A
rchive
T
OULOUSE
A
rchive
O
uverte (
OATAO
)
OATAO is an open access repository that collects the work of Toulouse researchers and
makes it freely available over the web where possible.
This is an author-deposited version published in :
http://oatao.univ-toulouse.fr/
Eprints ID : 16904
The contribution was presented at XX :
http://alife-robotics.co.jp/
To cite this version :
Ouannes, Nesrine and Djedi, Nouredinne and Duthen, Yves
and Luga, Hervé Modeling a bacterial ecosystem through chemotaxis simulation
of a single cell. (2016) In: Symposium on Artificial Life And Robotics
(ICAROB 2016), 19 January 2016 - 22 January 2016 (Beppu, Japan).
Any correspondence concerning this service should be sent to the repository
administrator:
[email protected]
Modeling a Bacterial Ecosystem Through Chemotaxis
Simulation of a Single Cell
Abstract We present in this paper an artificial life ecosystem in which the genes in the genome encode chemotaxis of bacteria that aim at: detecting resources (or sensing the environment), controlling the bacteria motion and producing a foraging behavior, and allow-ing bacteria to communicate together to obtain more sophisticated behaviors. The chemotaxis network of a cell is modulated by a hybrid approach that uses an algebraic model for the receptor clusters activity and an ordinary differential equation for the adaptation dy-namics, and a metabolism model that is based on the transformation of matter from ’food’. The results show analysis of the motion obtained by some bacteria and their effects on the population behaviors generated by evolution. This evolution allows bacteria to have the ability to adapt themselves to better growth in the en-vironment and to survive. As future work, we aim to improve the effect of the communication between bac-teria to obtain bacbac-teria that can emerge as new species, and to integrate the concept of colonies.
Keywords Artificial life · Bacterial chemotaxis · Single cell
1 Introduction
Simulation models in artificial life have focused metabolic, cellular systems and artificial chemistries. Artificial life research has also made progress in the study of adap-tive behavior through computational models of artifi-cial organisms. Remarkably simple chemical reactions can perform movements toward some attractants, and are therefore capable of modulating the behavior of ar-tificial organisms.
We will also demonstrate whether a simple bacterial chemotaxis process of a cell can explain the evolution of more complicated behaviors such as bacterial popula-tion dynamics. One of the central quespopula-tions of modern systems biology is the influence of microscopic parame-ters of a single cell on the behavior of a cell population. In terms of bacterial chemotaxis, this issue can be for-mulated as the influence of signaling network param-eters on the spatiotemporal dynamics of bacteria that migrate towards chemical attractants and away from repellents. This chemotaxis is one of the simplest be-haviors known, and it likely is one of the first bebe-haviors to have existed in the history of life on earth.
In the bacterial chemotaxis process, when no attrac-tant or repellant is present, or when the concentration of attractant or repellant is uniform, a bacterium such as E .coli tends to swim in a random walk, with periods of smooth swimming (or runs) interrupted by brief tum-bles that changes the swimming direction. In response to attractant gradient, this random walk becomes bi-ased and the bacteria tumble less frequently when en-countering increasing concentrations of an attractant (i.e., they swim longer runs), and tumble more fre-quently when the attractant concentration is decreasing [1]. The motivation for studying such small organisms lies in the belief that elucidating the mechanisms con-trolling their behavior will help in understanding more complex biological pathways and organisms. Phospho-rylation cascade in a chemotaxis network was first sim-ulated by Bray et al [2], using a system of ODEs, and [3], a later version of their model, added adaptation. A major advance in chemotaxis modeling was achieved in [4]. Later, in [5], a theoretical analysis of a full ODE system with included phosphorylation cascade.
Here, we present a bacterial ecosystem by simulat-ing bacteria chemotaxis network. The chemotactic
Es-Nesrine Ouannes, NourEddine Djedi, Yves Duthen et
Hervé Luga
cherichia coli bacterium model describes signal process-ing by mixed chemoreceptor clusters, which is a rapid-equilibrium (algebraic) model, adaptation through methy-lation simulated by ordinary differential equations (ODEs), and the running and tumbling of a cell with a flagella motor [6]. The metabolism of this bacterium is a set of chemical reactions that occur in the cell. These chemi-cal reactions are designed digitally to perform different functions as split, mutation and death. the aim goal of this metabolic model is to demonstrate the importance of recycling the matter in an ecosystem environment.
2 Bacterial Chemotaxis
The chemotaxis process consists of three stages: chemore-ception, signaling, and adaptation [7]. Methyl accept-ing chemotaxis proteins (MCPs) are located along the cell surface. These proteins act as chemoreceptors and bind with chemicals in the environment. If a nutrient attractant is detected outside of the cell, through MCP, the level of production of protein CheA decreases be-cause the receptors state shifts to the off state. It has been shown that the activity of the receptor cluster de-pends on the local ligand concentration and the methy-lation level according to the MWC (Monod-Wyman-Changeux signal processing) model [8], [9]. CheA binds with phosphate in the cell (denoted CheA-P). And the phosphate group is transferred from the active CheA to the response regulator CheY. The concentration of CheY-P modulates the motor and its behavior makes the cell run or tumble.
2.1 MWC model
We applied the MWC model for a mixed receptor clus-ter [8], [9], where each receptor homodimer is described by a two-state model. The inactive state of a receptor has a higher affinity to the attractant than the active state. The entire complex exists with all of its receptor homodimers either active or inactive. The probability A that receptor cluster is active is dependent on ligand concentration and the methylation state of the recep-tors and calculated as:
A = 1/(1 + eF) (1)
Where F = Fon- Fof f, and where Fon/of f is the free en-ergy of the cluster to be on/off as a whole. Hence, the average activity per receptor in the cluster is A. The total free-energy difference in the mean-field approxi-mation is F = nrfr(m), which is just the sum of the
individual free-energy differences between the receptor on and off states.
fr(m) = fron− frof f = ǫr(m) + log(
1 + [S ]/Kon r 1 + [S ]/Krof f
) (2)
where [S] is the ligand concentration, Kron/of f is the dissociation constant for the ligand in the on and off state, respectively. The methylation state of the recep-tor enters via the ”offset energy” ǫr(m).
2.2 Adaptation model
Adaptation is modeled according to the mean-field ap-proximation of the assistance-neighborhood (AN) model [8], [10]. Adaptation in chemotaxis is mediated by two enzymes, methyltransferase CheR and methylesterase CheB. It is assuming that the demethylating enzyme CheB works only on active receptors and that the methy-lating enzyme CheR works only on inactive receptors within the AN. Each bound CheR adds methyl groups at a rate a(1-A), and each bound CheB removes methyl groups at a rate bA. It is assumed that both enzymes work at saturation ([CheR]= 0.16, [CheB]= 0.28) [11]: dm/dt = a(1 − A) [CheR ] − bA [CheB ] (3)
The average methylation level evolves in time as m(t + ∆t) = m(t) + kV ∆t (4)
The parameter k indicates the adaptation rate rela-tive to the wild type adaptation rate V that is the rate of receptor methylation (see equation 3) [6].
2.3 Kinase activity
Both ligand binding and receptor methylation affect the activity of CheA. For example, the increase of an attrac-tant inhibits CheA activity, but subsequently methy-lates a specific receptor. CheA kinase activity [6] is cal-culated as (varing into [0,1]):
CheA = CheAtotAKA/(AKA+ KYCheYtot) (5) Where, A is the probability that receptor cluster is active, CheYtotis the total CheY concentration that is equal to 9.7 acoording to [11], KA=5 and KY=100 are the rate constants acoording to [6].
2.4 CheY phosphorylation
The concentration of CheYp is obtained as a function of active CheA from the steady-state equation [12]. CheY = CheYtotKYA/(KYCheA + KZCheZ + gy)(6)
Where, CheYtot is the total CheY concentration, and CheZ is the total CheZ concentration, CheA is the active [CheA ], and ky = 100µM−1s−1, kZ = 30/ [CheZ ]s−1, Y = 0.1 are the rate constants accord-ing to [12], [13], [14]. Receptor modification increases CheA activity and decreases sensitivity to attractants.
2.5 The CCW motor bias
The CCW motor bias depends on CheYp concentration in the following form [15].
mb = mb0
CheY (1 − mb0) + mb0
(7) Where, mb0 (0.65) is the steady-state motor bias.
3 Bacterial Metabolism
The metabolism is responsible for essential cycles of growth, development and reproduction. Genes and move-ments of a bacterium affect the majority of these cycles. An organism’s genome may contain instructions that encode the ability to metabolize one or more substrates present in the environment. Metabolism of a food ei-ther accelerates or decelerates a bacterium’s replication rate by a factor that is positive or negative, signifying a nutrient or a toxin, respectively. In this model, ev-ery bacterium is represented by a genome from which it extract its basic properties describing how it moves, gains energy, expels toxins, and produces waste. These properties are updated in the genome at each time step, mutation is applied after each ”split” operation.
Forrest and Jones’ simulation [16] allows for simple material cycling through agent bodies. Materials are collected by the agents and stored for a time before be-ing released back into the environment when the agent dies. From this point of view, we adopted this idea and the bacteria when they die, they will be transferred to a source of energy for the other bacteria.
Metabolism is calculated as the organism’s total en-ergy (enen-ergy obtained via the metabolizable food in addition to basal energy provided equally to all organ-isms) and subtracted to the ’cost of motion’ generated from the tumble frequency produced by the bacteria network. This metabolic model, supports bacteria to
stabilize their energy consumption in order to reach splitting threshold. After this each bacterium splits into two daughter cells. The food (i.e. food sources or waste of bacteria) is stored internally and used up as follows: ∆Mt= (M0+A(MF+MW)+MT+mb0MM+MS)∆t(8) – ∆Mt is the total metabolic expenditure (by which the internal store or the energy gained from foods is depleted in each time step);
– M0 is the base level metabolism (or the initial level at birth, which is equal to 25);
– A is the ability of bacteria to consume a food from the environment (according to the encoding genome described in the next section);
– MF is the metabolic value stored from the food sources consumption that is +2 units;
– MW is the metabolic value stored from the waste consumption (+1 unit);
– MT is the metabolic cost of toxin consumption (-2); – MM is the metabolic cost of movement (-1 unit); – mb0 is the tumble frequency obtained from
chemo-taxis network of the bacteria;
– MS is the metabolic cost of split operation (Mt/2).
4 Genetic representation
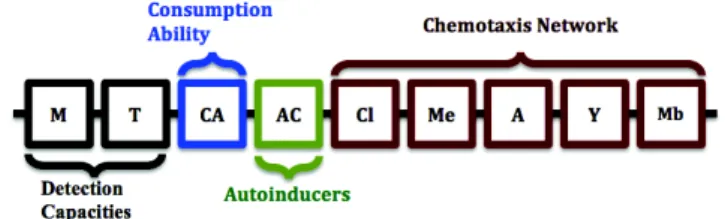
In the bacterial chemotaxis, there is a processing system of moderate complexity within the cell, triggered by its inputs and producing an output response. In E.Coli bacterium, this response corresponds to a change in the flagella rotation. The bacterial chemotaxis shows prop-erties of receptor function, adaptation, memory and motor bias. To control these properties in order to sim-ulate bacterial population behaviors, we use a genome that encodes the activities of each level in the chemo-taxis network. In this genome, we have two different types of encoding as presented in figure 1. First, a bi-nary encoding that describes the different capacities of a bacterium, that are: The capacities to detect a nutri-ent, and toxins with the same receptors. These capabil-ities serve as inputs for the network chemotaxis. The M and T values correspond to a small or large zone of nu-trient detection. A consumption capacity of a bacteria, explaining how many a bacterium can consume from the food, this capacity is affecting the metabolism pro-cess (see equation 8). The gene AC represents the con-centration of autoinducers (or the ability of detecting small diffusing autoinducers molecules), allowing bac-teria to produce molecules and detect the molecules produced by other bacteria presented in their group, in order to communicate each other.
Second, a real encoding that encodes functions of the chemotaxis network of a bacterium that are: Cluster
Fig. 1 The bacterium’s genome.
activity (CI), kinase activity, methylation level (Me), CheY phosphorylation (Y) and motor bias (Mb), that are obtained from the equations (1) to (7).
Once a bacterium manages to accumulate enough energy to reach the division state, it divides immedi-ately into two identical daughter cells, except that, the new bacterium copy will be mutated, in order to en-able bacteria to evolve. This ensures that the parent’s genetic material is preserved, while at the same time new genetic material is introduced in the population. A small probability pmof mutation is proposed to be ap-plied to the genome, by associating a noise to a selected gene. It must be emphasized at this point that, after the division process, the amount of energy of the parent’s cell will be distributed equally to the two copies. This will guarantee that the parent cell continues to exist, and it can create many different offsprings during its lifetime and does not ”die” after division.
5 Experimental Results
The objective of this work is to design an artificial ecosystem populated with bacteria. The set of exper-iments presented here are established in order to try to found a solution of the question of how to demonstrate if a simple bacterial chemotaxis process of a cell can explain the evolution of more complicated behaviors as bacterial population dynamics?
Simulated bacteria live and evolve in a 2-dimensional environment subdivided into discrete grid squares in which the bacteria exist as individual entities (i.e. the biotic element of the ecosystem). The developed model allows distinguishing three resources that are: (i) food (a source of energy) diffuses from multiple point of the environment and also (ii) from dead bacteria (or waste), and (iii) toxin resources. Although the environ-ment has been discretized, bacteria are free to move in the continuous two-dimensional space by translating their location. Each bacterium has one cell, all have equal size, shape, chemotaxis network controlling their movements, and artificial genomes generated at each run. All other parameter setups used in the Chemotaxis Networkare the same as presented in our previous work [17]. At the start of each run, the bacteria had random
locations in the environment. We started each evolu-tionary run from 10 bacteria with randomly generated genomes. Dead bacteria are replaced by sources
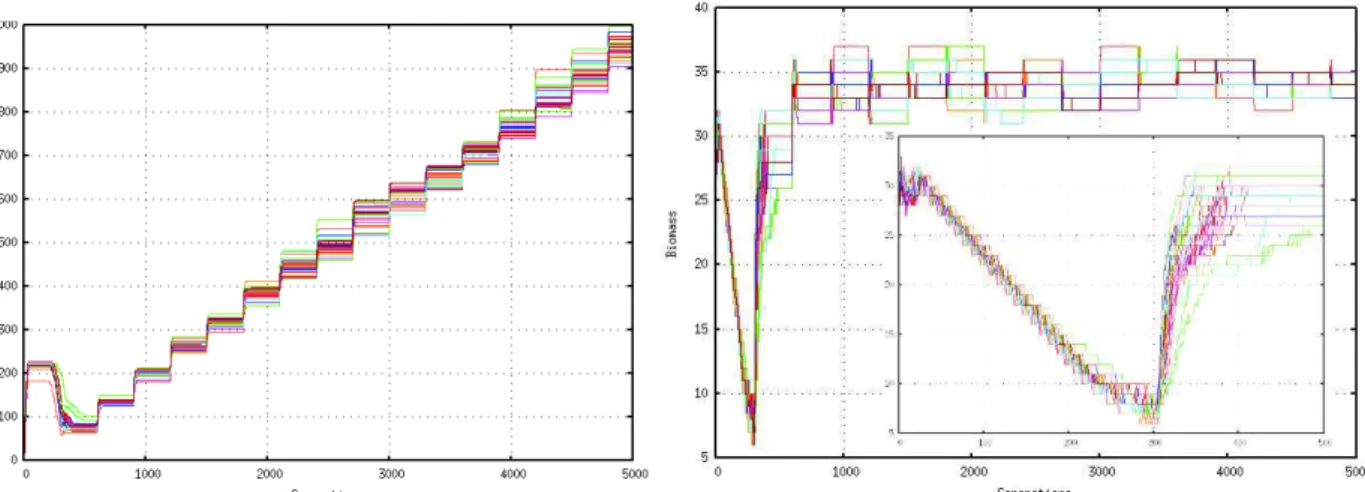
All runs presented in figure 2 (left-hand) show a fast population increase in the first twenty simulation cycles (or generations). This increase leads to a population re-production (or split), and then the population stays rel-atively constant for about 200 generations. From this level to the generation 300, the population decreases rapidly. This is a consequence of two facts. First a high number of bacteria die due to the depletion of food re-sources. Secondly, the speed of decrease is due to the bad MCP and toxin avoidance capacities. From gener-ation 300, and every 300 cycles, the growth rate is of-ten increased according to the capacities defined in the genome of each bacterium, which are also advanced. The number of species varies great during an experi-ment, which means that bacteria frequently split and die over time. It is important not simply relate this to food in the environment and to their own biomass, it is rather related the evolved capacities.
We test the changes in the values of the population’s collective energy for all 30 runs, as presented in Figure 2 (right-hand) were we observe that the metabolizable resources are consumed, while the populations collec-tive energy decreases in the beginning of the run (as new cells are created), at the division process’s maxi-mum speed, division process the biomass is exponen-tially decreased. Knowing that all sources are depleted. Within thirty generations, while many bacteria die be-cause they did not have enough energy for movement, but fortunately not all the population, as, all simulation will stop in this case (but this has been tested before choosing the environment parameters). In iteration 300, when new nutrients resources are added to the environ-ment, the bacteria consume nutrients, split, and when no more nutrient are present in the environment, their Energy decreases again but avidly than before. This means that the bacteria obtained after thousand of time steps are more stabilized and more effective in their use of energy. This effectiveness is due to the evolved ca-pacities of detection (MCP caca-pacities) of nutrients and mostly is due to the approved consumption ability.
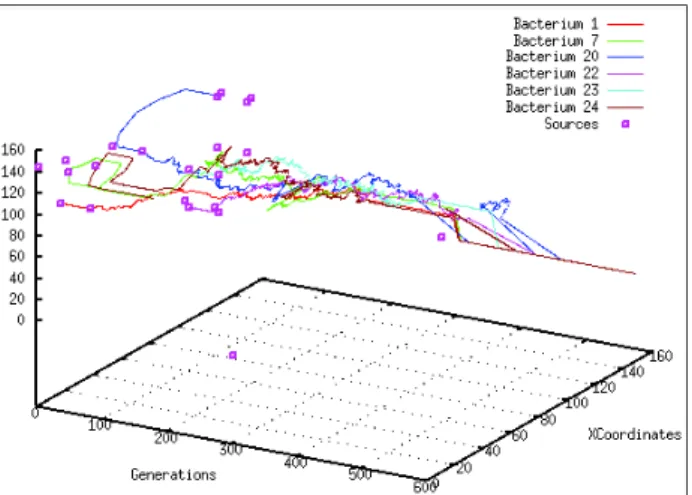
The evolved capacities of bacteria effect the chemo-taxis network response, for example: if a large zone is covered with a bacterium, it will conduct it to a long runmovement (i.e. Inactive State). Also, if a good con-sumption ability is obtained, the bacteria metabolism will be better optimized. We also present data about the oscillations of the swimming of some bacteria. The figure 3 shows the path of (x,y) coordinates of some bacteria borrowed from the simulation, where each bac-terium applies long runs and short tumbles in the
pres-Fig. 2 Left-Hand. The Growth rate runs, which we have replicated 30 times with quantitatively the same results, representing the optimal values of the whole of the bacteria for 5000 steps. Right-Hand. The Energy of the evolved population of bacteria for 30 runs at 5000 generations. Inside the figure, a zoom in the same runs for 500 generations.
ence of nutrient sources (as response to the nutrient), and a random walk in the Steady State. Run is a pe-riod of long straight swimming, and tumble is when bacteria stop and abruptly change their orientations, which is seen in the figure as the angles formed be-tween two runs. This path graph explained how bacte-ria moved from their initial positions toward a favorite zones, where two phases of evolution are remarked, in the first 300 cycles: bacteria are executing long run from a source to another, mostly in the first 20 cycles, and when all resources are depleted the oscillations became biased then a random walk is executed. The same thing is remarked in the second 300 cycles.
6 Discussion
The results show that a simple simulation model of single-celled creatures and biological mechanisms and simple chemical reactions allows us to model more com-plicated behaviors of a population of bacteria. We sum-marize that the growth rate (or bacteria number) con-tinues to increase for several hundred epochs, as the re-sources are eventually present in the environment, and the population’s collective lifespan is ameliorated be-cause the evolved bacteria consume less energy with their optimal capacities and gather more sources. The behavior of the system is thus to favor emergence (or adaptation) of best capacities to detect food and avoid toxins, therefore to avoid death and to better reproduce and to survive longer.
When bacteria are moving, consuming and split-ting, their chemotaxis network are optimized in order to control their evolution. The figure 4 explain how the chemoatxis network answer to changes happened in the environment and inside the bacterium cell. Four
inter-nal states are observed in this response; Steady State, Fully Inactive, Adapted , and Fully Active State. In each of these states the different protein’s concentrations are observed and analyzed referred to [6].
In the Steady State the bacteria perform a random walk, and exploring the environment with the initial values: (the kinase CheA =0.0164, and methylation =1.92, the CheY =1.92. Finally the motor bias =0,65). All these values are used by the ordinary differential equa-tions to calculate their changes over time. When bac-teria detect food sources, they enter to a consump-tion state, where transmembrane receptors sense this changes of attractant and became inactive.The attrac-tant binding inhibit the autophosphorylation activity of CheA. The CheY phosphorylated by the groups re-ceived from CheA (CheY-P), diffuses to the flagellar motors and changes of motor rotation, and causes a run. This increase of attractant concentration (realized by an attractant detection) shifts the equilibrium to off state of the receptors (i.e. Fully Inactive State), that results in an initial fast decreases of kinase activ-ity (CheA) (to 0.002) and hence CheY level, and causes longer runs (i.e mb 0.75). The decrease of ChA activity is followed by a slow CheR dependent adaptation.
In the Adapted State, the probabilities of booth states of the receptors (on, off ) are equal, and the booth CheR, and CheB enzymes are working for methylation and demethylation processes. In this state, methylation increases receptor ability to simulate CheA activity.
A removal of attractants shifts the system to the on state (or Fully Active State) that activates CheA autophosphorylation (0.047) and hence the downstream CheY phosphorylation. Methylation also decreases the activity of the receptor complex to attractant, thereby regulating the ligand binding to receptor complex.
Fig. 3 Path realized by some bacteria in 2D space for the first 600 cycles. The squares present the sources of nutrients that are present until the generation 20 and again from 300.
7 Conclusion and Future work
Our model was been designed to simulate growth and behavior of bacterial ecosystem; it controls a group of bacteria cells at each time step. To analyze the ob-tained behaviors, we present data that characterizes bacteria positions in space, Energy, and, state in the cellular reproduction cycle. These results demonstrate that bacteria are still able to evolve through mutation. The constructed model of chemotactic E .coli employed a hybrid model for pathway simulation, with mixed al-gebraic, ODE, and stochastic components instead of a fully stochastic model with an evolutionary algorithm to evolve a population of bacteria.
In future work, we aim to improve the effect of the chemotaxis network to obtain more powerful bacteria that can emerge as new species which behaves differ-ently from others, via the concept of colonies, and also to test this model on different environmental conditions and various changes.
References
1. Adler., J. (1975), Chemotaxis in bacteria. Annual, Review of Biochemistry, 44: 341-356.
2. Bray, D., Bourret, R. B., and Simon, M. I. (1993). Com-puter simulation of the phosphorylation cascade control-ling bacterial chemotaxis. Molecular Biology of the Cell, 4(5):469.
3. Levin, M. D., Morton-Firth, C. J., Abouhamad, W. N., Bourret, R. B., and Bray, D. (1998). Origins of individual swimming behavior in bacteria. Biophysical journal, 74(1): 175-181.
4. Barkal, N. and Leibler, S. (1997). Robustness in simple biochemical networks. Nature, 387(6636):913-917.
5. Mello, B. A. and Tu, Y. (2003). Perfect and nearperfect adaptation in a model of bacterial chemotaxis. Biophysical journal, 84(5): 29-43.
Fig. 4 Graph of variations in concentrations of proteins and enzymes used inside bacteria during the chemotaxis process.
6. Vladimirov, N., Lvdok, L., Lebiedz, D., and Sourjik, V. (2008). Dependence of bacterial chemotaxis on gradient shape and adaptation rate. PLoS computational biology, 4(12):e1000242.
7. Berg, H. C. (2000). Motile behavior of bacteria. Physics Today, 53(1):24-30.
8. Endres, R. G. and Wingreen, N. S. (2006). Precise adap-tation in bacterial chemotaxis through assistance neighbor-hoods.
9. Keymer, J. E., Endres, R. G., Skoge, M., Meir, Y., and Wingreen, N. S. (2006), Chemosensing in escherichia coli: two regimes of two-state receptors. Proceedings of the Na-tional Academy of Sciences of the United States of America, 103(6):1786-1791.
10. Hansen, C. H., Endres, R. G., andWingreen, N. S. (2008), Chemotaxis in escherichia coli: a molecular model for robust precise adaptation, PLoS computational biology, 4(1):e1. 11. Li M, Hazelbauer GL (2004) Cellular stoichiometry of the
components of the chemotaxis signaling complex. J Bacte-riol 186: 3687-3694.
12. Kollmann, M., Lvdok, L., Bartholome, K., Timmer, J., and Sourjik, V, (2005), Design principles of a bacterial sig-nalling network. Nature, 438(7067):504-507.
13. Stewart, R., Russell, C., Roth, A., and Dahlquist, F. (1988), Interaction of cheb with chemotaxis signal trans-duction components in Escherichia coli: modulation of the methylesterase activity and effects on cell swimming behav-ior, Cold Spring Harbor symposia on quantitative biology, 53: 27-40.
14. Sourjik, V. and Berg, H. C. (2002). Binding of the Es-cherichia coli response regulator chey to its target measured in vivo by fluorescence resonance energy transfer, Proceed-ings of the National Academy of Sciences, 99(20):12669-12674.
15. Cluzel, P., Surette, M., and Leibler, S. (2000), An ultra-sensitive bacterial motor revealed by monitoring signaling proteins in single cells, Science, 287(5458):1652-1655. 16. Forrest, S. and T. Jones (1994). Modelling Adaptive
Sys-tems with Echo. In Complex SysSys-tems: Mechanisms of Adap-tation. P 3-21.
17. Ouannes, N., Djedi, N., Luga, H., and Duthen, Y. (2014). Modeling a bacterial ecosystem through chemotaxis simu-lation of a single cell. pages 96-102, AROB , Beppu, Japan.