HAL Id: cea-02500844
https://hal-cea.archives-ouvertes.fr/cea-02500844
Submitted on 6 Mar 2020
HAL is a multi-disciplinary open access archive for the deposit and dissemination of sci-entific research documents, whether they are pub-lished or not. The documents may come from teaching and research institutions in France or abroad, or from public or private research centers.
L’archive ouverte pluridisciplinaire HAL, est destinée au dépôt et à la diffusion de documents scientifiques de niveau recherche, publiés ou non, émanant des établissements d’enseignement et de recherche français ou étrangers, des laboratoires publics ou privés.
M. Bottin
To cite this version:
M. Bottin. Molten Corium Concrete Interaction investigation of convective heat transfer in a pool with gas sparging. ERMSAR 2015 - 7th European Review Meeting on Severe Accident Research, Mar 2015, Marseille, France. �cea-02500844�
Molten Corium Concrete Interaction: investigation of convective heat
transfer in a pool with gas sparging
M. Bottin1
1) CEA/DEN Cadarache/SMTA/LPMA, 13108 St Paul lez Durance Cedex, France
Summary
During a severe accident in a Pressurized Water Reactor, corium may fall in the reactor pit and interact with concrete. The CLARA setup, financed by EDF, IRSN, GDF-Suez and CEA, has been designed to understand the heat transfer phenomena involved in the Molten Concrete Corium Interaction (MCCI). The facility is composed of a pool of simulant liquids, percolated by air and internally heated by direct electrical current. It is in contact with several heat exchangers in order to maintain walls at a constant temperature and to measure local heat losses. The experiments performed aimed at studying the influence of liquid viscosity (varying from 1 to 10000 mPa.s by dissolution of hydroxyethyl cellulose in the water), air injection velocities (ranging from 0 to 10 cm/s) on both horizontal and vertical walls and pool length, on heat transfer distribution.
This paper presents the findings on heat transfer which would contribute to the understanding of MCCI. After a literature review on the existing heat transfer experiments and correlations for two-phase (liquid-gas) flow, the CLARA experiments are described. Then, the results obtained are presented: influence of superficial gas velocity and liquid properties (especially viscosity) on heat transfer, evaluation of ratio between heat transfer on vertical and horizontal interface, influence of the pool dimensions. Finally, the analysis and interpretation of CLARA experiments are given: comparison to the literature data, development of correlations concerning the heat transfer along the vertical and horizontal plate, comparison to results obtained with real materials.
A. REVIEW ON HEAT TRANSFER EXPERIMENTS AND CORRELATIONS
Two-phase flow heat transfer within a heated bubbling pool has been extensively studied. In Ref. [1], a state of the art is presented listing the existing experiments and correlations on this subject. The main experiments with significant results are:
- The BALI Ex-Vessel tests (Ref. [2]): gas was injected through a porous bottom plate, viscosity and gas flow-rate were varied and the pool was electrically heated. Those tests led to the development of the following correlation :
ℎ = 19.6. 𝑘𝑘. �𝜌𝜌𝜌𝜌𝜎𝜎�0.5�𝜌𝜌.𝐽𝐽𝑔𝑔3 𝜇𝜇𝜌𝜌 � 0.146 �𝜇𝜇.𝑐𝑐𝑝𝑝 𝑘𝑘 � −0.22
This is one of the correlations used in the MCCI code TOLBIAC-ICB (Ref. [3]) developed by CEA with the support of EDF.
- The Duignan et al. (Ref. [4]) tests: gas was injected through a multi-hole bottom plate, the pool had small dimensions (~10cm), was heated at the bottom and the power was not evacuated. Those particular conditions raise the question of the representativeness of the results.
- The Kutateladze - Malenkov (Ref. [5]) tests: they investigated the heat transfer between an internally heated pool and a horizontal wall with gas injection but the experimental conditions are not well known. They used various liquids and gases providing extensive experimental results.
- The Kölbel (Ref. [6]) tests: They aimed at measuring the heat transfer coefficient between a vertical wall and a two-phase pool with varying viscosity and superficial gas velocity.
The main conclusion in Ref. [1] was that there is no experience with gas injected simultaneously through the bottom and the lateral walls on representative viscosity and gas velocity ranges. Moreover, for most of the experiments, the pool had small dimensions and/or was locally heated which is, again, not representative of the real case. This lack of experimental results justified the build-up of the CLARA facility. The existing correlations dedicated to the calculation of heat transfer in a bubbling pool were also listed in Ref. [1], including BALI correlation whose expression is given above, and concluded that the correlation based on Deckwer’s (Ref. [7]) theoretical approach gives the best results. Indeed, in Ref. [7], a theoretical interpretation of the heat transfer mechanism in bubble agitated systems is given, using the surface renewal theory of interphase mass transfer. Here, the heat equation is solved by introducing a characteristic time which is defined as the contact time of the fluid eddy at the heat exchange area. This time is calculated considering the typical length and velocity of the micro scale eddies of Kolmogorov theory of isotropic turbulence (valid for large Reynolds numbers). The following correlation, involving the Stanton, Reynolds, Froude and Prandtl dimensionless numbers, for heat transfer between impermeable surface and liquid-gas mixture is then given:
St = 0.1(ReFrPr²)-1/4
B. EXPERIMENTS DESCRIPTION
B.1. CLARA setup
CLARA (Coefficient for Lateral and Axial heat tRAnsfer) aims to investigate MCCI phenomenology by measuring heat transfer coefficient in two-phase flows along vertical and horizontal isothermal walls. The experiments aims at revealing the influence of liquid viscosity, superficial gas velocity and geometry on heat transfer coefficient. The tests were performed with different liquids covering range of dynamic viscosity from approximately 1 mPa.s to 10000 mPa.s. The water is used as a liquid with the lowest viscosity, while higher viscosity is obtained with solutions of hydroxyethyl cellulose (HEC) in water. The apparatus is composed of a pool, a system of heat exchangers, a system for gas injection, a heating system for the liquid, instrumentation for measuring temperature and void fraction and a computer system for commands, control and data acquisition. The CLARA rectangular shaped pool has a maximum volume of 0.6 m3 (2 m long × 0.25 m deep × 1.2 m high); the length can be varied from 0.5 to 2m. It is made of Plexiglas, allowing visualization. The two largest walls are equipped on their inner surface with copper electrodes which allow direct heating of the pool by dissipation of electrical power. The system for heat exchange in the CLARA apparatus contains several units placed on one of the vertical walls and on the bottom wall of the pool. Each one of these units contains a heat exchanger designed to cool the liquid inside the pool and to maintain a homogeneous surface temperature by water circulating in an engraved spiral channel. The knowledge of the water temperature entering and exiting a heat exchanger is used to calculate the extracted heat by each unit. Air is injected through the two smallest vertical walls and the bottom wall. The gas distribution plates are placed over the heat exchangers. One of the vertical wall is only equipped of gas injection plates without heat exchanger.
Two series of experiments were performed in the CLARA facility to study the influence of air injection and viscosity of the fluid on heat transfer in addition to characterization tests. The first experiments were performed in the small configuration of the CLARA facility (0.5m long, 0.25m large and 0.25m high). An analysis of this first series of experiments was developed by the CEA Grenoble (Ref. [8]). Then, 76 experiments were performed in the large configuration
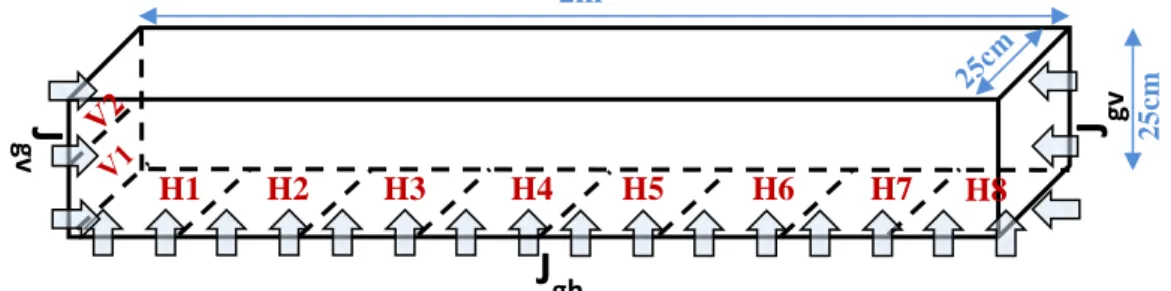
(with the length increased from 0.5 to 2 m). This paper presents mainly the results obtained with the large configuration which is represented on Figure 1 with its two vertical heat exchangers (V1, V2) and eight horizontal heat exchangers (ranging from H1 to H8). The viscosity was varied between 1 and 10000 mPa.s corresponding to the addition of the following mass fractions of hydroxyethyl cellulose (HEC): 0 %, 0.75 %, 1.2 %, 2.3 %, 4.1 % (and 8 % for the small configuration tests). The different gas superficial velocities (horizontal and vertical) investigated were: 0, 0.7, 2, 4 and 7cm/s.
Figure 1. Sketch of the large configuration of the CLARA facility
B.2. Parameters of interest
B.2.a. Heat transfer coefficient h
Heat transfers depend on the temperature difference between the bulk pool (Tp) and the wall (Tw) and on the power extracted by heat exchangers to keep the wall at a constant temperature. Gas injected through a surface Sair is brought from air temperature (Tair) to wall temperature (Tw) thanks to some power (Pair) before entering the pool. Heat transfer expression is thus given by the relation:
(
)
air(
p w)
air w p ech ech T T S P T T S P h − + − =(
)
(
)
w p air w air air air air p w p ech e ech s ech ech liq liq p T T T T Q S c T T T T Q S c h − − + − − = , ρ . . , , , ρ . .with h the heat transfer coefficient, Pech the power used to bring the water from Te,ech (entering temperature) to Ts,ech (exiting temperature), Sech the heat exchanger surface, Qech the water flow-rate in heat exchanger, Qair the air flow-rate. Wall temperatures chosen to evaluate heat transfer coefficients are the temperatures measured in front of the center of each heat exchanger. These temperatures are indeed the one used to control wall temperature.
The uncertainty associated to heat transfer coefficient is calculated considering sensors resolution. Thermocouples have a resolution of 0.3°C, gas and water flow-meter have respectively a resolution of 0.83% and 1% (manufacturers data). The errors for the measured heat transfer coefficient range from 7 to 20% for the large configuration (experiments performed in a pool with an extended length). The errors for the small configuration (with a reduced pool length) were larger and could reach 45%.
B.2.b. Viscosity
In order to investigate the influence of liquid viscosity, different liquids have been used in CLARA experiments: water and aqueous HEC solutions. The viscosity measurements have shown that the solutions of HEC are shear-thinning non-Newtonian fluids, which means that
H1 H2 H3 H4 H5 H6 H7 H8 2m
J
ghJ
gvJ
gv 25c m (3) (4)their viscosity decreases with shear rate. Using the power law model (Ostwald model) the relation between the shear stress 𝜏𝜏 and the shear rate 𝛾𝛾̇ is represented as
𝜏𝜏 = 𝐾𝐾𝛾𝛾̇𝑛𝑛 (𝑛𝑛 ≤ 1) where K is the consistency coefficient and n the power law index.
In order to determine the consistency coefficient K and the power law index n, the measurement results for each liquid are approximated by power function. Defining the apparent liquid viscosity 𝜇𝜇 as a ratio of average shear stress and the average shear rate, from the relation (5),we can obtain:
𝜇𝜇 = 𝐾𝐾𝛾𝛾̇𝑛𝑛−1
The values of the constants K and n-1 for each liquid at 22 °C and 42 °C are given in Table 1. Table 1: Consistency coefficient and power law index for liquids used in the CLARA experiments
K (Pa.sn) n-1 22°C 42°C 22°C 42°C Water 0.001 0.0006 0 0 HEC 0.75% 0.017 0.008 -0.03 -0.01 HEC 1.2% 0.061 0.03 -0.07 -0.06 HEC 2.3% 0.58 0.27 -0.17 -0.12 HEC 4.1% 6.2 2.5 -0.32 -0.24 HEC 8% 28 13 -0.46 -0.36
According to Ref. [9], the average value of shear rate in bubble columns can be expressed as follows:
𝛾𝛾̇ = �𝜌𝜌𝜌𝜌𝐽𝐽𝑔𝑔
𝐾𝐾 �
1 𝑛𝑛+1
Substituting the equation (7)in the equation (6) one can obtain the apparent viscosity of the non-Newtonian liquid for given superficial gas velocity. It was assumed that the constants K and n-1 linearly decrease as the liquid temperature increases in the experimental range of interest. The viscosity evaluated for heat transfer along the bottom plate uses the horizontal superficial gas velocity Jgh and will be denoted µh, the viscosity for vertical heat transfer calculated with the vertical superficial gas velocity Jgv will be denoted µv. One have to note that viscosity varies importantly with the added fraction of HEC but doesn’t change much throughout the velocity range studied here.
C. RESULTS
C.1. Heat transfer distribution
Figure 2 shows the vertical (hv2 and hv1 for the upper and lower heat exchangers respectively) and horizontal (hh1 to hh8) heat transfers for different superficial velocities and viscosities. In order to show relative results, the values are divided by an arbitrarily chosen heat transfer coefficient h0. In the first column, the horizontal superficial velocity is much more important than the vertical one. In the second column, the vertical superficial velocity is much more important than the horizontal one. In the third column, the horizontal superficial velocity equals the vertical one. Each line represents a viscosity, the smallest viscosity on the first line, the largest on the last line.
(6)
As can be seen, heat transfer is almost constant along the horizontal wall. It is more important in the half upper part of the vertical wall than in the lower one and the increase of Jgv increases this difference. The increase of the liquid velocity in the top region was shown in Ref. [10]. Moreover, bubbles, more numerous as the altitude increases, participate to the mixing of the flow. These conditions promote the heat exchange at the top of the pool. In a general way, the liquid agitation promoted by the presence of bubbles near a wall is likely to increase the transfer at that place.
For the same gas velocities conditions, the increase of concentration implies a decrease of heat transfer along all the walls. Viscosity plays an essential role in heat transfer as it is involved in convection mechanisms. A second consequence of the increase of concentration is that the ratio hv/hh diminishes, i.e. heat transfer is reduced at the vertical wall whatever the gas injection configuration. The features highlighted by this figure are discussed in the paragraph hereafter.
Figure 2. Heat transfer coefficient distribution for different viscosity and gas injection conditions
In what follows, heat transfer will be averaged spatially: hh is the average horizontal heat transfer, hvis the average vertical heat transfer.
C.2. Gas injection from bottom and from lateral walls
C.2.a. Influence of the gas velocity
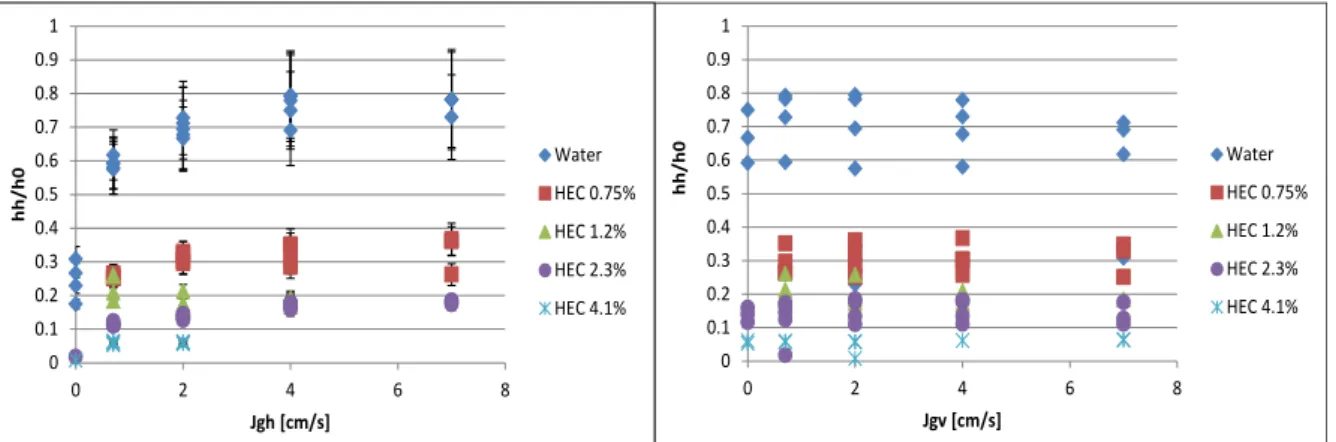
Figure 3 reveals the influence of horizontal and vertical superficial gas velocity on the horizontal heat transfer coefficient divided by the same arbitrary heat transfer coefficient h0 as in previous paragraph. It can be seen that heat transfer increases against increasing horizontal gas flow-rate. It seems that this increase is quite rapid for the low gas velocities until it reaches a plateau. The same evolution was already observed by Ref. [11] : horizontal heat transfer becomes constant as long as enough gas is injected. The horizontal heat transfer coefficients evolution versus the vertical superficial gas velocity shows a different behavior: the coefficients don’t vary with the amount of gas injected. The influence of viscosity is clear: heat transfer decreases with increasing viscosity.
Figure 3. Horizontal heat transfer coefficient evolution versus horizontal (on the left) and vertical (on the right) superficial gas velocity
Figure 4shows the evolution of the vertical heat transfer divided by a random heat transfer coefficient h0 with the horizontal and vertical superficial gas velocity. Concerning the influence of the horizontal gas velocity, there is no clear trend noticeable; the vertical heat transfer seems to be independent from the rate of gas injected from below. This feature was already observed by Ref. [11]. Concerning the influence of the vertical gas velocity, it can be seen that heat transfer increases with increasing gas flow-rate, similarly to what was observed for the horizontal case. But here, vertical heat transfer doesn’t seem to plateau out, it keeps increasing with increasing vertical gas flow-rate.
0 0.1 0.2 0.3 0.4 0.5 0.6 0.7 0.8 0.9 1 0 2 4 6 8 hh /h 0 Jgh [cm/s] Water HEC 0.75% HEC 1.2% HEC 2.3% HEC 4.1% 0 0.1 0.2 0.3 0.4 0.5 0.6 0.7 0.8 0.9 1 0 2 4 6 8 hh /h 0 Jgv [cm/s] Water HEC 0.75% HEC 1.2% HEC 2.3% HEC 4.1%
Figure 4. Vertical heat transfer coefficient evolution versus horizontal (on the left) and vertical (on the right) superficial gas velocity
On Figure 5, the heat transfer coefficients measured by the upper (hv2) and the lower (hv1) heat exchangers on the vertical wall are plotted. Only a few points are represented for the sake of readability. One can see that, as observed before, the lateral heat transfer is always larger in the upper part than in the lower part of the pool. While the order of magnitude of the hv2/hv1 ratio is about ten in natural convection, here it is about one possibly because of the fluid homogenization induced by the presence of bubbles.
Figure 5. Vertical heat transfer coefficient (lower and upper region) evolution versus vertical superficial gas velocity
On Figure 6, the horizontal and vertical heat transfer coefficients are plotted versus the viscosity and one can see that the decrease of heat transfer with increasing viscosity seems, in both cases, to follow a power-law.
Figure 6. Horizontal heat transfer evolution versus viscosity 0 0.2 0.4 0.6 0.8 1 1.2 0 2 4 6 8 hv /h 0 Jgh [cm/s] Water HEC 0.75% HEC 1.2% HEC 2.3% HEC 4.1% 0 0.2 0.4 0.6 0.8 1 1.2 0 2 4 6 8 hv /h 0 Jgv [cm/s] Water HEC 0.75% HEC 1.2% HEC 2.3% HEC 4.1% 0 0.2 0.4 0.6 0.8 1 1.2 0 2 4 6 8 hv /h 0 Jgv [cm/s] hv2 - Water hv2 - HEC 0.75% hv2 - HEC 1.2% hv2 - HEC 2.3% hv2 - HEC 4.1% hv1 - Water hv1 - HEC 0.75% hv1 - HEC 1.2% hv1 - HEC 2.3% hv1 - HEC 4.1% 0.01 0.1 1
1E-04 1E-03 1E-02 1E-01 1E+00 1E+01
hh /h 0 μh [Pa.s] Water HEC 0.75% HEC 1.2% HEC 2.3% HEC 4.1% 0.01 0.1 1
1E-04 1E-03 1E-02 1E-01 1E+00 1E+01
hv /h 0 μv[Pa.s] Water HEC 0.75% HEC 1.2% HEC 2.3% HEC 4.1%
C.2.b. Ratio between lateral and bottom heat transfers hv/hh
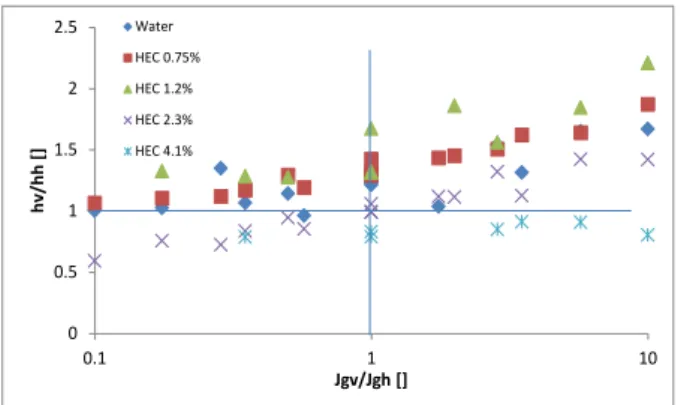
On Figure 7, the ratio between the vertical heat transfer coefficient and the horizontal one is plotted versus the ratio of the vertical superficial gas velocity on the horizontal one. The ratio ranges between 0.5 and 2 which means that there is no important anisotropy observed. The ratio increases whatever the viscosity: it means that the difference between lateral and bottom heat transfer is enhanced when lateral gas injection is promoted (i.e. Jgv is increased). This figure also shows the influence of viscosity. For the 3 lowest viscosities, the behavior is the same: the ratio is between 1 and 2 which shows that the heat exchange is slightly promoted laterally. For the most viscous fluids, the hv/hh ratio can be below 1, heat is preferably transferred through the bottom wall than laterally.
Figure 7. Ratio between the vertical and the horizontal heat transfer coefficient versus the ratio between the vertical and the horizontal superficial gas velocity
C.3. Analysis and interpretation
From a general point of view, the presence of bubbles induces a fluid agitation and participates in heat exchange. For the conditions investigated in the CLARA experiments, when gas is present, the heat transfer coefficient doesn’t depend significantly on the amount of gas, but depends much more on the viscosity. It shows that heat transfer depends on local phenomena. When the gas is injected laterally, bubbles hardly reach the bottom of the pool: the heat transfer at the horizontal wall is reduced. When the gas is injected through the bottom wall, the bubbles that rise along the vertical walls participate to the heat transfer and the associated coefficient values are similar to those measured for simultaneous horizontal and vertical gas injection. That is why, in the next paragraph devoted to the modeling of CLARA results, only the local quantities are considered in the different correlations.
C.3.a. Heat transfer modeling
In the TOLBIAC-ICB MCCI code, several correlations are available to estimate the heat transfer: the Blottner (Ref. [12]) correlation, the Kutateladze and Malenkov (Ref. [5]) correlation, the Deckwer (Ref. [7]) correlation and the BALI correlation (eq. (1), Ref. [2]) built from the BALI Ex-vessel experiments. The comparison, between measured and calculated with the BALI correlation Nusselt number Nu (𝑁𝑁𝑁𝑁 = ℎ. ℒ/𝑘𝑘 with ℒ being the Laplace length) for both small and long configurations, is represented on Figure 8. The black line represents the case where the measured coefficient equals the calculated one; the dashed lines represent the ± 40% deviation. One can see that the discrepancy between the experimental results and the correlation is quite important. It shows that this correlation fails to reproduce the heat transfer coefficients measured in the CLARA experiments.
0 0.5 1 1.5 2 2.5 0.1 1 10 hv /h h [ ] Jgv/Jgh [] Water HEC 0.75% HEC 1.2% HEC 2.3% HEC 4.1%
Figure 8. Comparison between measured (for both small and large configurations) and calculated with the BALI correlation Nu numbers
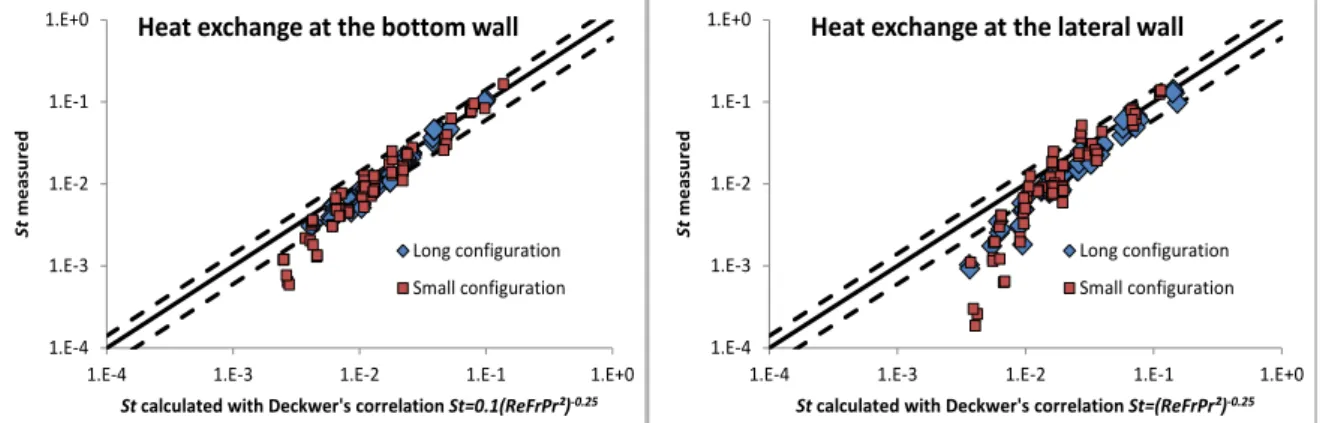
The Deckwer correlation (eq. (2), Ref. [7]) was identified in Ref. [1] to best reproduce experimental data from the literature. This correlation involves the Stanton, Reynolds, Froude and Prandtl dimensionless numbers. Their expressions are the following:
For heat exchange at the bottom wall: 𝑆𝑆𝑆𝑆 = ℎℎ
𝜌𝜌.𝑐𝑐𝑝𝑝.𝐽𝐽𝑔𝑔ℎ, 𝑅𝑅𝑅𝑅 = 𝐽𝐽𝑔𝑔ℎ.2ℒ.𝜌𝜌 𝜇𝜇ℎ , 𝐹𝐹𝐹𝐹 = 𝐽𝐽𝑔𝑔ℎ2 𝜌𝜌.2ℒ, 𝑃𝑃𝐹𝐹 = 𝜇𝜇ℎ.𝑐𝑐𝑝𝑝 𝑘𝑘 For heat exchange at the lateral wall: 𝑆𝑆𝑆𝑆 = ℎ𝑣𝑣
𝜌𝜌.𝑐𝑐𝑝𝑝.𝐽𝐽𝑔𝑔𝑣𝑣, 𝑅𝑅𝑅𝑅 = 𝐽𝐽𝑔𝑔𝑣𝑣.2ℒ.𝜌𝜌 𝜇𝜇𝑣𝑣 , 𝐹𝐹𝐹𝐹 = 𝐽𝐽𝑔𝑔𝑣𝑣2 𝜌𝜌.2ℒ, 𝑃𝑃𝐹𝐹 = 𝜇𝜇𝑣𝑣.𝑐𝑐𝑝𝑝 𝑘𝑘
The comparison, between measured and calculated (with Deckwer’s correlation) St numbers, for both small and long configurations, is represented on Figure 9 for horizontal and vertical heat transfer. The black line represents the case where the measured St equals the calculated one; the dashed lines represent the ± 40% deviation.
Figure 9. Comparison between measured and calculated St numbers for small and large configurations and for horizontal and vertical heat transfer
One can see that, for small Stanton numbers, which globally corresponds to high viscosities, the Deckwer correlation overestimates heat transfer. Several explanations can be given:
- This correlation is based on Kolmogorov’s turbulence theory and does not take into account the sources of creation of turbulence. In particular, bubble injection, growth and detachment that occur near the heat exchange wall, are likely to create turbulent eddies that contribute to liquid motion (near-wall turbulence) and consequently to the heat transfer.
0.1 1 10 100 0.1 1 10 100 Nu -mea su red
Nu - calculated with BALI correlation
hv hh 1.E-4 1.E-3 1.E-2 1.E-1 1.E+0
1.E-4 1.E-3 1.E-2 1.E-1 1.E+0
St
me
as
ure
d
St calculated with Deckwer's correlation St=0.1(ReFrPr²)-0.25
Heat exchange at the bottom wall
Long configuration Small configuration 1.E-4 1.E-3 1.E-2 1.E-1 1.E+0
1.E-4 1.E-3 1.E-2 1.E-1 1.E+0
St
me
as
ure
d
St calculated with Deckwer's correlation St=(ReFrPr²)-0.25
Heat exchange at the lateral wall
Long configuration Small configuration
- The Kolmogorov’s theory of isotropic turbulence is valid only in the case of fully developed turbulent flow with very high Reynolds number. In context of CLARA experiments, the fully developed turbulent flow is certainly not reached in the viscous liquids.
- The energy dissipation rate is calculated with the pressure drop in the pool corresponding to a bottom injection which is not correct for the gas injected laterally.
- The decrease of heat transfer can also possibly be explained by the presence of a gas film which can thermally insulate the pool from the wall and diminish heat transfers.
Furthermore, the heat transfer behavior differs between the bottom and the lateral walls and a single correlation may not reproduce the observed trends.
We therefore propose two new correlations, one for the bottom wall and one for the lateral wall, of type St=a(ReFrPr²)b which is the form proposed by Ref. [13]. As these correlations should be implemented in the MCCI TOLBIAC-ICB code, we determine the maximum of the
ReFrPr² quantity that is likely to be encountered in the reactor case i.e. the most critical case for
a corium melt in interaction with concrete.
- The maximum corium density is ρ =8000 kg/m3 - The maximum corium viscosity is µ=1 Pa.s
- The maximum superficial gas velocity is Jg=0.1 m/s - The maximum corium heat capacity is cp=1200 J/kg/K - The minimum corium heat conductivity is k=2 W/m/K
These quantities may not be realistic as they don’t correspond to the same moment of the severe accident scenario. For example, a high corium density corresponds to the beginning of the MCCI while a high viscosity is obtained when an important fraction of concrete was ablated that is to say rather at the end of the MCCI. Nevertheless, we consider here a conservative situation in order to determine the larger ReFrPr² range. As ReFrPr² can be rewritten ρ.µ.Jg3.cp²/g/k², the maximum value of ReFrPr² on the reactor range is then about 3.105.
We calculate the a and b parameters of the St=a(ReFrPr²)b correlation by minimizing the quadratic quantity ∑(𝑆𝑆𝑆𝑆 − 𝑎𝑎(𝑅𝑅𝑅𝑅𝐹𝐹𝐹𝐹𝑃𝑃𝐹𝐹²)𝑏𝑏)2. As can be seen on Figure 10, we then obtain:
St=0.1(ReFrPr²)-0.285 for the heat transfer at the bottom wall
St=0.15(ReFrPr²)-0.296 for the heat transfer at the lateral wall
The exponents (-0.285 and -0.296 for the bottom and the lateral walls respectively) are weaker than in Deckwer’s correlation (exponent -0.25). We observe that the agreement is poor for high ReFrPr² numbers (less representative of the reactor case) for the same reasons as given for the discrepancy between experimental results and the Deckwer’s correlation.
Figure 10. Comparison between experimental results and calculations with the new correlation for heat exchange at the bottom and lateral walls
0.0001 0.001 0.01 0.1 1
1.E-01 1.E+01 1.E+03 1.E+05 1.E+07
St ReFrPr² Horizontal - St=f(ReFrPr²) Vertical - St=f(ReFrPr²) St=0.1(ReFrPr²)-0.285 St=0.15(ReFrPr²)-0.296
ReFrPr² reactor range
3.105
(8) (9)
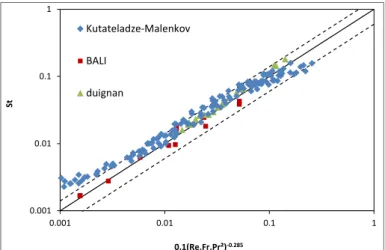
We finally check that the correlation, here for the horizontal heat transfer, reproduce the other results from the literature. This comparison is plotted on Figure 11 with the ± 40% discrepancy represented in dashed lines and we can see that the agreement is rather good.
Figure 11. Comparison between results from the literature and the new correlation for horizontal heat transfer
One have to note that recently, on the base of CLARA results, IRSN also established a new set of heat transfer correlations (Ref. [14]) taking into account a possible difference between the horizontal and the lateral superficial velocities resulting from a possible anisotropic ablation.
C.3.b. Comparison with prototypical materials experiments
MCCI experiments performed with prototypical materials on reduced scale facilities showed ablation trends (Ref. [11]):
- For calcareous concretes, the gas release is important, the pool viscosity is low and experiments showed a rather isotropic concrete ablation
- For siliceous concretes, the gas flow rate is low, the viscosity is important and anisotropic trends were experimentally observed: lateral ablation is predominant compared to the one at the bottom of the pool.
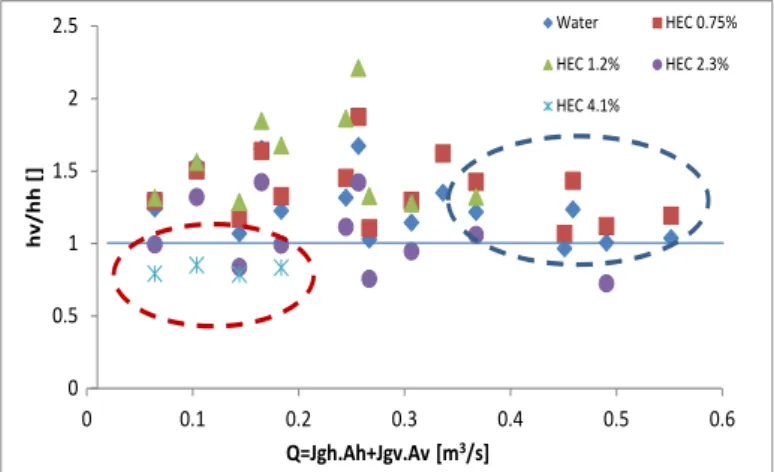
On Figure 12, we plotted the hv/hh ratio versus the total gas flow rate for the different viscosity values experimentally tested and for the reactor range. For a high gas release and a low viscosity (the region in the dashed blue circle), we rather have a hv/hh ratio slightly over 1 so rather a slightly anisotropic trend. For a low gas flow-rate and a high viscosity (the region in the dashed red circle), the hv/hh ratio is slightly below 1 so a rather isotropic trend or even a heat exchange promoted at the bottom of the pool.
0.001 0.01 0.1 1 0.001 0.01 0.1 1 St 0,1(Re.Fr.Pr²)-0.285 Kutateladze-Malenkov BALI duignan
Figure 12. Ratio between the vertical and the horizontal heat transfer coefficient versus the total gas flow rate
Trends in CLARA are different from those observed in prototypical corium pools experiments. We can conclude that the convection in a more or less viscous pool percolated by gas is not the predominant mechanism of ablation trends observed in experiments with prototypical materials. It is possible that those ablation trends are related to the behavior of interfaces, including crusts, which is currently poorly understood.
D. CONCLUSION
Heat flux distribution shows a homogeneous heat transfer along the bottom of the pool while, on the lateral wall, it is more important in the upper region than in the lower one. The presence of bubbles induces a fluid agitation and enhances heat exchange. The variable parameters for those series of experiments were the amount of gas injected and the viscosity. We saw that the influence of viscosity on heat transfer was largely predominant with a decrease in the form of a power law. The influence of the gas velocity on the heat exchange (which increases with increasing gas flow-rate) is much more limited and local. These conclusions are valid over the gas velocity and viscosity ranges studied in the CLARA facility which are also representative of the reactor case. Anisotropic trends with increasing viscosity were observed: the lateral heat exchange is promoted for the lowest viscosities while heat is preferably transferred at the bottom for the most viscous fluids. We then compared the CLARA experimental results to some correlations from the literature. The agreement between the CLARA results and Deckwer correlation (Ref. [7]), based on a theoretical approach, is better than with the BALI correlation (Ref. [2]) but still insufficient. Therefore, based on CLARA results, two new correlations of type
St=a(ReFrPr²)b (a=0.1 and b=-0.285 for the heat transfer at the bottom wall, a=0.15 and b=
-0.296 for the heat transfer at the lateral wall) were proposed and we checked that the agreement
with literature data was correct. Finally, a comparison between the prototypical materials and the CLARA tests exhibited opposite behaviors showing that anisotropy trends observed in prototypical materials tests cannot be understood without a better knowledge of phenomena occurring at the interface (crusts). Further experiments with velocity measurements or enhanced visualization would lead to a better representation of the fluids circulation patterns.
References
[1] B. Tourniaire, «A heat transfer correlation based on a surface renewal model for molten core concrete interaction study,» Nuclear Engineering and Design, vol. 236, pp. 10-18, 2006. 0 0.5 1 1.5 2 2.5 0 0.1 0.2 0.3 0.4 0.5 0.6 hv /h h [ ] Q=Jgh.Ah+Jgv.Av [m3/s] Water HEC 0.75% HEC 1.2% HEC 2.3% HEC 4.1%
[2] J. M. Bonnet, «Thermal hydraulic phenomena in corium pools for ex-vessel situations: the BALI experiment,» chez ICONE 8, Baltimore, USA, 2000.
[3] B. Spindler, B. Tourniaire et J. Seiler, «Simulation of MCCI with the TOLBIAC-ICB code based on the phase segregation model,» Nuclear Engineering and Design, vol. 236, p. 2264–2270, 2006.
[4] M. Duignan, G. Greene et T. Irvine, «Heat transfer from a horizontal bubbling surface to an overlying water pool,» Chemical Engineering Communication, vol. 87, pp. 185-194, 1990.
[5] S. S. Kutateladze et I. G. Malenkov, «Hydrodynamic analogy between heat transfer and nucleate boiling crisis in boiling and bubbling - experimental data,» Heat Transfer
Soviet Research, vol. 16, p. 1–46, 1984.
[6] H. Kölbel, W. Siemes, R. Maas et M. K., «Wärmeüberbang an Blasensaülen,»
Chemie Ingenieur Technik, vol. 30, pp. 400-404, 1958.
[7] W. D. Deckwer, «On the mechanism of heat transfer in bubble column reactors,»
Chemical Engineering Science, vol. 35, p. 1341–1346, 1980.
[8] M. Amizic, E. Guyez, J.-M. Seiler et M. Bottin, «Experimental study of heat transfer in liquid-gas flow: preliminary CLARA test findings,» Heat and Mass Trasnfer, To be published.
[9] J. Sánchez Pérez, E. Rodríguez Porcel, J. Casas Lopez, J. Fernandez Sevilla et Y. Christi, «Shear rate in stirred tank and bubble column bioreactors,» Chemical
Engineering Journal, vol. 124, p. 1–5, 2006.
[10] F. B. Cheung et M. Epstein, «Two-phase bubble-liquid boundary layer flow along vertical and inclined surfaces,» Nuclear Engineering and Design, vol. 99, pp. 93-100, 1987.
[11] C. Journeau et J. F. Haquet, «Convection heat transfer anisotropy in a bubbling viscous pool—Application to molten core–concrete interaction,» Nuclear Engineering
and Design, vol. 239, p. 389–394, 2009.
[12] F. G. Blottner, Hydrodynamics and heat transfer characteristics of liquid pools with bubble agitation, Rapport NUREG/CR-0944, 1979.
[13] W. Kast, «Analyse des Wärmeübergangs in Blasensäulen,» International Journal
of Heat and Mass Transfer, vol. 5, p. 329–336, 1962.
[14] B. Michel, «New Set of Convective Heat Transfer Coefficients Established for Pools and Validated against CLARA Experiment for Application to Corium Pools,»
Nuclear Engineering and Design, To be published.
Acknowledgement
The author would like to acknowledge the financial support from CEA, EDF, IRSN, GDF-Suez and SARNET. TOLBIAC-ICB code is developed in the frame of an agreement between CEA and EDF. The results presented in this paper were obtained from the experiments performed at the CEA Grenoble by Marc Samaille. A special thank is addressed to Milan Amizic, Marie Seiler, Estelle Guyez, Gilles Ratel, Claude Bonnard and Jean-François Haquet for their constructive discussions that largely contributed to the development of the analysis presented in this paper.