HAL Id: hal-00956765
https://hal-univ-rennes1.archives-ouvertes.fr/hal-00956765
Submitted on 7 Mar 2014HAL is a multi-disciplinary open access archive for the deposit and dissemination of sci-entific research documents, whether they are pub-lished or not. The documents may come from
L’archive ouverte pluridisciplinaire HAL, est destinée au dépôt et à la diffusion de documents scientifiques de niveau recherche, publiés ou non, émanant des établissements d’enseignement et de
Feature extraction and classification for rectal bleeding
in prostate cancer radiotherapy: A PCA based method
Aureline Fargeas, Amar Kachenoura, Oscar Acosta, Laurent Albera, Gael
Drean, Renaud de Crevoisier
To cite this version:
Aureline Fargeas, Amar Kachenoura, Oscar Acosta, Laurent Albera, Gael Drean, et al.. Feature extraction and classification for rectal bleeding in prostate cancer radiotherapy: A PCA based method. Innovation and Research in BioMedical engineering, Elsevier Masson, 2013, 34 (4-5), pp.296-299. �10.1016/j.irbm.2013.07.009�. �hal-00956765�
Feature extraction and classification for rectal bleeding
in prostate cancer radiotherapy: A PCA based method
Aur´eline Fargeasa,b
, Amar Kachenouraa,b
, Oscar Acostaa,b , Laurent Alberaa,b, Ga¨el Dr´eana,b, Renaud De Crevoisiera,b,c
a
INSERM, U1099, Rennes, F-35000, France.
b
Universit´e de Rennes 1, LTSI, Rennes, F-35000, France.
c
D´epartement de Radiotherapie, Centre Eug`ene Marquis, Rennes, F-35000, France.
1. Introduction
Rectal bleeding is one of the most important sequelae after prostate can-cer radiotherapy and impacts the patients quality of life [1]. Understanding local dose/toxicity relationships is crucial to correlate the treatment outcome with the planning parameters. Several studies have found significant corre-lations between the parameters derived from rectal Dose-Volume Histograms (DVHs) and the incidence of bleeding such as NTCP models [2]. NCTP models use data in the native space and do not need registration step. More precisely, these methods consist of a reduction of 3D dose distributions to DVHs at the expense of the spatial information about location. Nevertheless, it is important to note some crucial limitations:
• a same DVH may correspond to different dose distributions;
• these methods require the estimation of population specific parameters optimized over a larger database.
In a previous work, we introduced a novel method based on Principal Component Analysis (PCA) [3] to predict rectal bleeding following high-dose prostate cancer radiotherapy. This method exploits the Three-dimensional planned Dose Distribution (3D-pDD) without any parameterization. An in-herent problem of outcome modeling is that the analysis with a large number of variables is computationally expensive. Many features may be extracted from data to provide new representations of the populations anatomy. The main goal of features selection is to find an optimal subset from a full set of features which provide relevant information to match or improve the perfor-mances of classifiers. In this study, based on the method proposed in [3], we compare the existing approach (namely sequential) with a novel approach (namely combinatory) to select relevant features. In [3], the sequential ap-proach was applied. This selection of features provides higher statistical performances for classifying the rectal bleeding patients. PCA was applied to 3D-pDD of patients treated for prostate cancer by intensity-modulated radiotherapy (IMRT). This allowed for a comparison of the two approaches to select features with respect to their power to make predictions.
2. Materials and methods
2.1. Data and registration
A total of 63 prostate cancer patients who received a total dose of 80 Gy in the prostate by IMRT were included in the study. For each patient, only the CT acquisition, volume delineations and the 3D-pDD were acquired. The delivery was guided by means of an Image-Guided Radiation Therapy (IGRT) protocol, with cone beam CT images or two orthogonal images (kV or MV
imaging devices), using gold fiducial markers in 57% of patients. Eleven of them present rectal bleeding (≥ grade 1) at 2 years. Only the 3D-pDD within the rectum was analyzed. Patients planning CT and dose distributions were elastically registered on a single coordinate system by combining the CTs and organs delineations with the demons algorithm [4], as explained in [5].
2.2. Principal component analysis
Feature extraction methods determine an appropriate subspace of dimen-sionality R in the original feature space of dimendimen-sionality P (R ≤ P ). Linear transforms have been widely used for feature extraction and dimensionality reduction. In this communication, PCA and ICA were used. The purpose of PCA is to derive a relatively small number of decorrelated linear combina-tions (principal components) of a set of random variables while retaining as much of the information from the original variables as possible. Typically, the PCA for the random vector xm = [xm
1 , · · · , xmN]T consists in looking for an overdetermined (N × P ) (i.e. P ≤ N ) orthonormal linear transform W such that the P components of the vector zm = [zm
1 , · · · , zPm]T = WTxm are mutually uncorrelated. Thus, if we denote W = [e1, · · · , ef]T as the eigen-vectors of Rx (the covariance matrix of xm), corresponding to the eigen-values (λ1, · · · , λP ) where λ1 ≥ · · · ≥ λP, the first principal component of xm is zm1 = eT1xm. Likewise, the P -th principal component is obtained as zmP = eT
Pxm. In our case, each individuals 3D-pDD can be represented as a 1D vector by vertically concatenating the transpose rows of all the slices. Thus, we obtained a (N ×M ) matrix X for all the individuals, where M = 63 represents the number of individuals (the variables) and N the number of voxels (the number of observations carried out). Only the voxels lying within
the rectum were considered (N = 12, 726). After centering the data, the eigen-decomposition of the covariance matrix Rx = XXT was performed. However, because of the huge size of Rx, its diagonalization is computa-tionally expensive. A usual procedure is to perform the eigen-decomposition of a M × M covariance matrix Cx = XTX, yielding new P eigenvectors Y = [y1, · · · , yP]. This leads to an indirect way of computing the original eigenmatrix W as W = XY. It has to be noticed that because the rank of Rx can not exceed M , the maximum number P of meaningful eigenvectors is less or equal to M .
2.3. Classification procedure
The whole procedure is divided in two steps, namely the training step and the classification step.
2.3.1. Training step: features selection
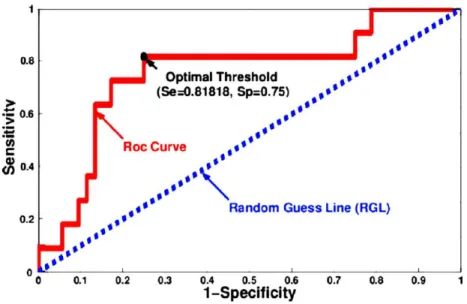
In this section, we aimed at finding the more discriminant features (eigen-vectors). That is to say, the one that better classify the population into rectal and non-rectal bleeding groups. We used the Receiver Operating Charac-teristic (ROC) curve. The ROC curve is the graph that displays the full picture of trade-off between the true positive rate (Sensitivity, Se) and false positive rate (1-Specificity, 1-Sp) across a series of cut-off points as shown in Fig. 1. For each feature, we obtained the optimal cut-off point (named optimal threshold) that best discriminates the two groups. To do so, we max-imized the vertical distance from line of equality (Random Guess Line, RGL, Fig. 1) to each point of the curve. After computing the optimal threshold associated to each feature, we performed the top ranked axis from the axis
Figure 1: ROC curve and corresponding optimal threshold when using the more relevant principal axis (34th).
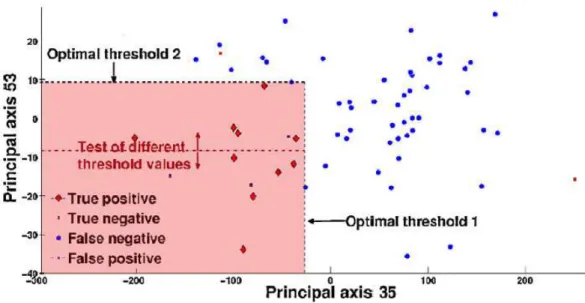
associated with the maximal optimal threshold to the minimal one. If the re-sult obtained when using the best feature is not significant, another solution is the exploitation of more than one feature (combinations of features) to discriminate between patients with and without rectal bleeding. We use two different approaches (sequential and combinatory) to choose the n-optimum features set. For the sake of clarity, we explain the two approaches in the case where n = 2 (using the two best features as depicted in Fig. 2).
Sequential approach. The first feature is chosen as the most discriminant axis (the one with the highest vertical distance to the RGL). Then the Sequential Forward Selection (SFS) [6] strategy is used to select the second feature that provides the 2-optimum feature set. In other words, the threshold of the second feature is equal to the optimal threshold obtained from its ROC
Figure 2: Projection of patients when using the first two more relevant principals axes.
curve (Fig. 2).
Combinatory approach. In this case, the first feature is chosen as for sequen-tial approach. However, to set the threshold of the second feature, we test all the values of its cut-off points (red dotted line in Fig. 2). Then, the second optimal threshold is equal to the cut-off point that gives the best statisti-cal performance. It is interesting to note that, contrary to the sequential approach, when we use a combination of features (n ≥ 1) the performance never decreases. Indeed, if the second feature does not improve the perfor-mance in terms of Se and Sp, we just take into account the results previously obtained using the n − 1 best features.
2.3.2. Classification step
In order to classify a new patient, we project its 3D-pDD on the sub-space spanned by the n vectors base representing the n-optimum features set. Eventually, the patient is classified as having rectal bleeding if its 3D-pDD projection (n dimensional vector) is include in the toxic area (red area, Fig. 2).
3. Results and discussions
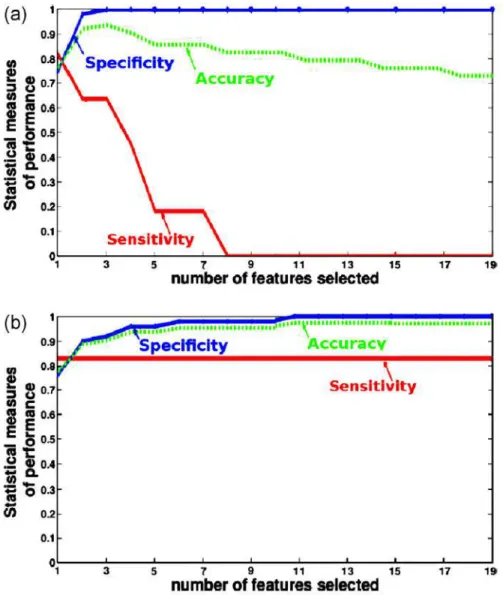
Because of the reduced number of patients (especially the number of patients suffering from rectal bleeding, 11 patients), a leave-one-out cross validation is performed to estimate the accuracy of our predictive model. At each round of the cross-validation, one patient is randomly extracted and used as test sample for validating the analysis. Then the proposed procedures are applied to the 62 remaining patients. The performance of the proposed methods is evaluated by computing the sensitivity (Se) and the specificity (Sp). The Se represents the percentage of patients with rectal bleeding who are correctly identified as having rectal bleeding effects. The Sp defines the percentage of patients without rectal bleeding who are correctly identified. Fig. 3 displays the performance of the classifier as a function of the number, n, of exploited features when using (a) the sequential approach and (b) the combinatory approach. When using just the best feature (namely the 34th), 82% of patients suffering from rectal bleeding and 75% of non-rectal bleeding patients have been well classified (Se = 0.82 and Sp = 0.75), which means that only two patient with rectal bleeding and 13 non-rectal bleeding patients were badly classified. In the case where we exploited more than one feature,
Figure 3: Accuracy, sensitivity and specificity as function of the number of exploited features using: (a) sequential approach, and (b) combinatory approach.
Fig. 3 (a) shows that the sequential approach is more efficient when using only the best feature (34th). Indeed, the performance dramatically decreases in terms of sensitivity when using more than one feature. Regarding the
combinatory approach (Fig. 3 (b)), the best results (Se = 0.82 and Sp = 1) were obtained when more than 15 features were exploited. It means that only two patients were badly classified (and 61 patients were well classified). We note that, with this approach, the statistical measures increase when more than one feature were used. We also remarked that, in this case, the performance of our classifier is stable when more than 15 features were used. This may suggest that there are redundant or irrelevant information in the remained features. The low number of patients (63 patients) did not allow to estimate the population specific parameters optimized over a larger database of well-established pre-diction methods such as NTCP models. Future work includes comparison with these methods on a larger database.
4. Conclusion
In this work, we applied the proposed PCA based methods to classify prostate cancer patients suffering from rectal bleeding. Although the exper-iments were performed on a reduced data set, the two procedures used to select the relevant features (sequential and combinatory) provide high ac-curacy and suggest that our methodology is promising to study the local dose/toxicity relationships. We also show that the approach used to select the best combination of principal axes is very important. Application on large database will be performed in future to more evaluate the robustness of the proposed methods.
Acknowledgments
This work was supported by Region Bretagne and has received a French government support granted to the CominLabs excellence laboratory and managed by the National Research Agency in the Investing for the Future program under reference ANR-10-LABX-07-01.
[1] A. Jackson, Partial irradiation of the rectum, in: Seminars in radiation oncology, Vol. 11, Elsevier, 2001, pp. 215–223.
[2] T. Rancati, C. Fiorino, G. Gagliardi, G. Cattaneo, G. Sanguineti, V. C. Borca, C. Cozzarini, G. Fellin, F. Foppiano, G. Girelli, et al., Fitting late rectal bleeding data using different NTCP models: results from an italian multi-centric study (AIROPROS0101), Radiotherapy and oncology 73 (1) (2004) 21–32.
[3] B. Chen, O. Acosta, A. Kachenoura, J. D. Ospina, G. Drean, A. Simon, J.-J. Bellanger, P. Haigron, R. De Crevoisier, Spatial characterization and classification of rectal bleeding in prostate cancer radiotherapy with a voxel-based principal components analysis model for 3D dose distri-bution, in: Prostate Cancer Imaging. Image Analysis and Image-Guided Interventions, Springer, 2011, pp. 60–69.
[4] J.-P. Thirion, Image matching as a diffusion process: an analogy with maxwell’s demons, Medical image analysis 2 (3) (1998) 243–260.
[5] O. Acosta, G. Drean, J. D. Ospina, A. Simon, P. Haigron, C. Lafond, R. De Crevoisier, Voxel-based population analysis for correlating
lo-cal dose and rectal toxicity in prostate cancer radiotherapy, Physics in medicine and biology 58 (8) (2013) 2581.
[6] D. P. Muni, N. R. Pal, J. Das, Genetic programming for simultaneous feature selection and classifier design, Systems, Man, and Cybernetics, Part B: Cybernetics, IEEE Transactions on 36 (1) (2006) 106–117.


