HAL Id: hal-03141908
https://hal.inrae.fr/hal-03141908
Submitted on 15 Feb 2021HAL is a multi-disciplinary open access archive for the deposit and dissemination of sci-entific research documents, whether they are pub-lished or not. The documents may come from teaching and research institutions in France or abroad, or from public or private research centers.
L’archive ouverte pluridisciplinaire HAL, est destinée au dépôt et à la diffusion de documents scientifiques de niveau recherche, publiés ou non, émanant des établissements d’enseignement et de recherche français ou étrangers, des laboratoires publics ou privés.
rather than on pit structure
Cedric Lemaire, Nicole Brunel-Michac, Jérémie Santini, Liliane Berti, Julien
Cartailler, Pierre Conchon, Eric Badel, Stéphane Herbette
To cite this version:
Cedric Lemaire, Nicole Brunel-Michac, Jérémie Santini, Liliane Berti, Julien Cartailler, et al.. Plastic-ity of the xylem vulnerabilPlastic-ity to embolism in Populus tremula x alba relies on pit quantPlastic-ity properties rather than on pit structure. Tree Physiology, Oxford University Press (OUP): Policy B - Oxford Open Option B, 2021, 42 p. �hal-03141908�
1 Research Paper
2 Plasticity of the xylem vulnerability to embolism in Populus tremula x alba relies on pit
3 quantity properties rather than on pit structure.
4 Cédric Lemaire 1, Yann Quilichini 2, Nicole Brunel-Michac 1, Jérémie Santini 2, Liliane Berti 2,
5 Julien Cartailler 1, Pierre Conchon 1, Éric Badel 1 and Stéphane Herbette 1.
6 1 Université Clermont Auvergne, INRAE, PIAF, F-63000 Clermont-Ferrand, France.
7 2 UMR 6134 SPE, CNRS-Università di Corsica, 20250 Corti, France
8
9 Keywords
10 Acclimation, anatomy, cavitation, hydraulic, phenotypic plasticity, Poplar, shade, water stress,
11 X-ray microCT.
12
13 Running head
14 Structural determinants of plasticity of embolism resistance
15
16 Full address of the corresponding author
17 Stéphane Herbette
18 UMR INRAE/UCA 547 PIAF
19 Université Clermont Auvergne, Campus Universitaire des Cézeaux,
20 1 Impasse Amélie Murat,
21 TSA 60026, 63178 AUBIERE Cedex
22 FRANCE
24 Abstract
25 Knowledge on variations of drought resistance traits are needed to predict the potential of trees
26 to acclimate to coming severe drought events. Xylem vulnerability to embolism is a key
27 parameter related to such droughts, and its phenotypic variability relies mainly on
28 environmental plasticity. We investigated the structural determinants controlling the plasticity
29 of vulnerability to embolism, focusing on the key elements involved in the air bubble entry in
30 vessels, especially the inter-vessel pits. Poplar saplings (Populus tremula x alba) grown in
31 contrasted water availability or light exposure exhibited differences in vulnerability to
32 embolism (P50) in a range of 0.76 MPa. We then characterized the structural changes in features
33 related to pit quantity and pit structure, from the pit ultrastructure to the organization of xylem
34 vessels, using different microscopy techniques (TEM, SEM, LM). A multispectral combination
35 of X-ray microtomography and light microscopy analysis allowed measuring the vulnerability
36 of each single vessel and testing some of the relationships between structural traits and
37 vulnerability to embolism inside the xylem. The pit ultrastructure did not change, whereas the
38 vessel dimensions increased with vulnerability to embolism and the grouping index and fraction
39 of inter-vessel cell wall both decreased with vulnerability to embolism. These findings hold
40 when comparing between trees, or between the vessels inside the xylem of an individual tree.
41 These results evidenced that plasticity of vulnerability to embolism in hybrid poplar occurs
42 through changes in the pit quantity properties such as pit area and vessel grouping rather than
43 on the pit structure.
44 Keywords
45 Acclimation, anatomy, cavitation, hydraulic, phenotypic plasticity, Poplar, shade, water stress,
46 X-ray microCT.
48 Introduction
49 According to the cohesion-tension theory (Steudle 2001), the water columns in the xylem are
50 under tension, a metastable state. When this tension increases during droughts, the water
51 columns are more prone to break, because of cavitation: vapour bubbles invade the impacted
52 vessels and spread, impeding function and leading to a loss of xylem conductance. When the
53 loss of conductance reaches a threshold (around 90%), the distal organs are not supplied with
54 water anymore leading to death (Barigah et al. 2013). For woody species, drought-induced
55 death is more likely due to xylem hydraulic failure (Anderegg et al. 2015, 2016, Adams et al.
56 2017) caused by embolism in the xylem conduits, even if other processes can also contribute to
57 this death (Hammond et al. 2019) such as the carbon starvation (Hartmann et al. 2015).
58 A global analysis pointed out the narrow hydraulic safety margin at which woody species
59 usually operate (Choat et al. 2012); inferring that research is needed on the variability of
60 vulnerability to embolism. Within-species variability for vulnerability to embolism was shown
61 for many tree species (e.g. Martínez-Vilalta et al. 2009, Herbette et al. 2010). The genetic
62 variability for this trait is rather limited in both natural populations (Lamy et al. 2011,
63 Wortemann et al. 2011) and cultivated species (Jinagool et al. 2015, 2018). This trait would be
64 genetically canalized (Lamy et al. 2012) and varies mainly via plasticity due to environmental
65 factors (Herbette et al. 2010). Plasticity of vulnerability to embolism was reported mainly under
66 water stress, with wood formed under drier conditions being less vulnerable (Awad et al. 2010,
67 Fichot et al. 2010, Plavcová and Hacke 2012). Other conditions such as shade or fertilization
68 were associated to an increase in vulnerability to embolism (Cooke et al. 2005, Barigah et al.
69 2006, Plavcová and Hacke 2012). However, information is scarce on the determinants of
70 plasticity of vulnerability to embolism. The structural determinants need to be deciphered first,
71 before searching for their genetic control, as it can be complex to decipher the role of candidate
73 In angiosperms, water flows between xylem vessels through bordered pits. These pits are
74 openings in the secondary cell wall that allow water to flow between vessels while they prevent
75 air seeding from neighbouring air-filled vessels. Pits have been identified as the key structures
76 for vulnerability to embolism (Lens et al. 2013; Jansen et al. 2018, Kaack et al. 2019). Thus,
77 we assume that the acclimation of vulnerability to embolism to environmental conditions would
78 involve changes in the pit quantity and/or structure, i.e. at pit and/or vessel scales (Lens et al.
79 2013). The key role of the pit ultrastructure in vulnerability to embolism has been evidenced in
80 several studies (e.g. Choat et al. 2008, Lens et al. 2011, Tixier et al. 2014), especially the pit
81 membrane (Jansen et al. 2009, Li et al. 2016, Kaack et al. 2019). There is a well-established
82 correlation between pit membrane thickness and vessel resistance to embolism in angiosperms
83 (Lens et al. 2011, Plavcová and Hacke 2012, Scholz et al. 2013a, Schuldt et al. 2016). A
84 mechanistic explanation has been provided through the recent discoveries on the
three-85 dimensional structure of the pit membrane (Kaack et al. 2019, 2020). Pit membrane is a porous
86 medium with series of various pore constrictions influencing the air seeding, and constriction
87 sizes decreased with increasing pit membrane thickness. Vulnerability to embolism is also
88 dependent on pit quantity parameters such as the pit area or the vessel connectivity and thus on
89 vessel dimensions and three dimensional organization (Lens et al. 2013). Zimmermann and Jeje
90 (1981) already pointed out that the hydraulic vulnerability could be related to the vessel volume
91 that varies depending on both their diameter (Tyree et al. 1994) and their length (Scholz et al.
92 2013a). Several studies demonstrated a relationship between vulnerability to embolism and
93 vessel diameter (Wheeler et al. 2005, Hacke et al. 2006, Maherali et al., 2006; Awad et al. 2010,
94 Hajek et al., 2014). However, other studies failed to detect such a relationship (Lens et al., 2011,
95 Scholtz et al. 2013 a, Schuldt et al. 2016). Such discrepancy between findings can be explained
96 by uncertainties about the relationship between vessel diameter and pit area. More, one has to
98 parameters or pit structure (Choat and Pittermann 2009). The three-dimensional organization
99 of the xylem network would also influence the vulnerability to embolism, as shown in
100 theoretical and empirical analyses (Loepfe et al. 2007, Mrad et al. 2018). The relationship
101 between vulnerability to embolism and pit properties has been intensively studied at the
inter-102 specific level, whereas the determinants of plasticity of vulnerability to embolism remain poorly
103 investigated at the intraspecific level (Schuldt et al. 2016). For example, in poplar, Plavcová et
104 al. (2011) showed that shading caused an increase in vulnerability to embolism associated with
105 a decrease in both pit membrane thickness and vessel diameter, whereas Awad et al. 2010
106 showed that a reduced watering induced a decrease in vulnerability to embolism linked with a
107 decrease in vessel diameter.
108 In this work, we investigated the relationship between the plasticity of vulnerability to
109 embolism and changes in structures related to pit properties at different anatomical levels on
110 young poplars (Populus tremula x alba). We grew saplings of a poplar clone under three
111 contrasted environmental conditions for two factors (water and light availability) known to
112 induce variation of vulnerability to embolism. Then, their xylem anatomy was analysed in
113 relation to the changes in vulnerability to embolism using different approaches. Transmission
114 Electron Microscopy (TEM) allowed investigations on the pit ultrastructure. Parameters related
115 to the pit-field were measured using Scanning Electron Microscopy (SEM). We also measured
116 pit quantity parameters related to vessel dimensions and vessel connectivity using light
117 microscopy and silicon injections. Then, an approach using direct observation of embolism
118 spreading inside the xylem by X-ray microtomography allowed to analyse the relationships
119 between structural traits and vulnerability to embolism at the vessel level.
120
121 Materials and Methods
123 Plant Material. Saplings of hybrid poplar (Populus tremula x alba clone INRA 717-1B4) were 124 propagated clonally in vitro on Murashige and Skoog medium on December 2016. Plantlets
125 were transferred in hydroponic solution on February 2017 and grown in a controlled
126 environment room: 16 h daylight at 21-22 °C, 40 µmol.m-2.s-1 and 18-19 °C night, at 70 ± 10 %
127 relative humidity. On March 2017, plants were transferred in 1 Litre pots filled with potting
128 soil (Humustar Terreaux, Champeix, France) with a composition of 25 % brown peat, 40 %
129 blond peat and 35 % pine bark dust. The pots were placed in a greenhouse at the INRAE
130 research station of Clermont-Ferrand, France (site of Crouël; N 45°77′, E 3°14′; 300 m a.s.l.).
131 After 20 days, plants were transferred in 10 L pots filled with potting soil. They were regularly
132 watered at soil field capacity. Each pot weighted 6.4 ± 0.4 kg. Ten days later, the specific
133 experimental growth conditions were applied (see next). After one month of growth, stems were
134 cut at 50 cm height. The growth of a new apical bud occurred in May 2017, and any additional
135 bud was removed. Thus, a single stem completely grew under the new environmental
136 conditions.
137 Experimental setup. Plants were split in three groups submitted to different growth conditions: 138 (i) “control” plants grew under full sunlight and watered at soil field capacity; (ii) ”droughted”
139 plants grew under full sunlight and watered at 25-30 % of soil field capacity; (iii) ”shaded”
140 plants shaded by a shadehouse that intercepted 30 % of incident light and watered at soil field
141 capacity. For the nine droughted plants, an irrigation at 25-30 % of soil field capacity was kept
142 constant in each pot individually using balances and automatic valves for irrigation as described
143 in Niez et al. (2019). We measured the light interception by the shadehouse by comparing for
144 two months the light intensities recorded with two sensors (PAR/CBE 80, Solems, Palaiseau,
145 France) placed inside the shadehouse and two sensors placed outside. The level of water stress
146 was set to be the most restrictive while allowing growth to produce acclimatized xylem and
148 a LVDT sensor (Linear Variable Differential Transformer) on three droughted, two control and
149 three shaded plants. Plant height was measured using a measuring tape.
150 One month before and the day before the tree sampling, predawn water potential (Ψpd) was
151 measured on every plant 1 hour before the sunrise using a pressure chamber (1505D, PMS
152 Instrument, Albany, OR, USA, Scholender et al. 1965). The same day, midday water potential
153 (Ψmid) was measured at the solar noon, between 12:00 and 2:00 PM.
154 Sampling protocol. The sampling was performed on 28 August 2017. Plants were cut at 20 cm 155 height. The plant shoot was immerged underwater and the 30 cm of the top were removed as it
156 lacks significant secondary xylem. Then, the following stem segments were sampled, from
157 basal to apical direction:
158 i) the 30 cm long basal part of the stem was removed because it was not fully grown under
159 acclimation conditions;
160 ii) the first 50 cm long of the newly developed stem under the acclimation conditions was
161 wrapped in wet paper, put in a plastic bag and stored at 4 °C until measurements of vulnerability
162 to embolism and vessel length;
163 iii) the above segment of 6 cm long was devoted to microscopy analyses. It was split into three
164 subsamples using a razor blade: two segments of 1 cm long were prepared for light microscopy
165 and TEM observations. A third segment of 4 cm long was prepared for SEM observations;
166 iv) if the stem was long enough, an additional segment of 50 cm long was wrapped in wet paper
167 in a plastic bag, and stored at 4 °C for measurements of specific conductivity (KS) and for
168 additional measurements of vulnerability to embolism;
169 v) the last 10 cm long was kept wrapped in humid paper for a native embolism measurement
170 performed on the sampling day.
171 Leaves were sampled under water and the total leaf area (LA) per plant was measured in the
173 After the sampling, plants were kept in the greenhouse, during the winter 2017. On March 2018,
174 they started growing, still under the same environmental conditions as described above, and on
175 July 2018 we performed a second sample collection: plants were cut at 25 cm height. Then the
176 30 cm long basal part of the stem was cut underwater. A 50 cm long sample was wrapped in
177 wet paper and stored in a plastic bag at 4 °C for measurements of specific conductivity (KS).
178 Hydraulic traits measurements:
179 Vulnerability to embolism. The 50 cm long stem segment was shortened underwater at 43 cm 180 long using a razor blade. Then, the vulnerability to embolism was assessed using the Cavitron
181 technique (Cochard 2002, Cochard et al. 2005). A centrifugal force increases water tension in
182 branch segment while a specific optical device allows the continuous measurement of the loss
183 of conductance (Cochard et al. 2009). A vulnerability curve was built by plotting the percentage
184 loss xylem conductance (PLC) vs. xylem water pressure (P). A sigmoidal function was used to
185 fit each curve using the equation 1 (Pammenter and Willigen 1998).
186 PLC = 100 (1)
1 + 𝑒
𝑆 (𝑃 ― 𝑃50) 25
187 Where P50 is the pressure causing 50 % loss of conductance, and S is the slope of the curve at
188 this point.
189 Specific conductivity. Stem segments of 50 cm long were shortened underwater at a length 190 (Lstem) of 40 cm long using a razor blade for droughted (n = 8), control (n = 9) and shaded (n =
191 9) plants. The apical end of the sample was sealed to a tubing system (polytetrafluoroethylene
192 film) and plugged to an embolism meter (Xyl’em, Bronkhorst, Montigny les Cormeilles,
193 France). The initial conductance (Ki) was then measured under low pressure (2 to 7 kPa) using
194 a solution of 10 mM KCl and 1 mM CaCl2. The xylem area AX of the distal end of the sample
195 was measured on a cross section using a scanner (V800, Epson, Nagano, Japan). The
197 v.1.52c) (Schneider et al. 2012). The Specific Conductivity KS was defined according to
198 equation 2.
199 𝐾𝑆= (2)
𝐾𝑖× 𝐿𝑠𝑡𝑒𝑚
𝐴𝑥
200 Native Embolism. The native embolism of the stem segments of 10 cm long were measured on 201 the sampling day for droughted (n = 9), control (n = 5) and shaded (n = 6) plants. Each sample
202 was shortened underwater using a razor blade to a length of 8 cm. Then, the initial conductance
203 (Ki)was measured under low pressure (2 to 7 kPa) with the same method and the same solution
204 as for specific conductivity. Then, the sample was flushed with the same solution twice for
205 5 min under high pressure (0.1 to 0.2 MPa) in order to remove the air embolism. A new
206 measurement of conductance without embolism indicated the maximum conductance (Kmax) of
207 the sample. The native embolism was calculated according to the equation 3.
208 Native Embolism = (1 ―𝐾𝐾𝑖 (3)
𝑚𝑎𝑥) × 100 209 Light microscopy
210 Samples of 1 cm long were cut into 3 x 3 mm2 blocks then they were immersed in Karnvosky's
211 fixative solution under vacuum for 30 min, then stored at 4 °C in the fixative solution up to the
212 next step. Then, they were dehydrated in an ethanol series (50, 70, 80, and 95 %) and embedded
213 in LR White resin. Transverse slices of 2 to 3 µm thick were cut using an ultramicrotome (Om
214 U2, Reichert, Vienna, Austria). Sections were stained with 1 % (w/v) toluidine blue, washed 4
215 times with water and mounted in Eukitt (Sigma-Alrich, St-Louis, MO, USA). Images were
216 processed using a microscope (Zeiss Axio Observer Z1), a digital camera (AxioCam MRc) and
217 Zen imaging software system (Zeiss, Jena, Germany).
218 Image analyses were performed using ImageJ software with a home-made semi-automated
219 procedure. The vessel diameter (Dv) was estimated to be the diameter of the circle having the
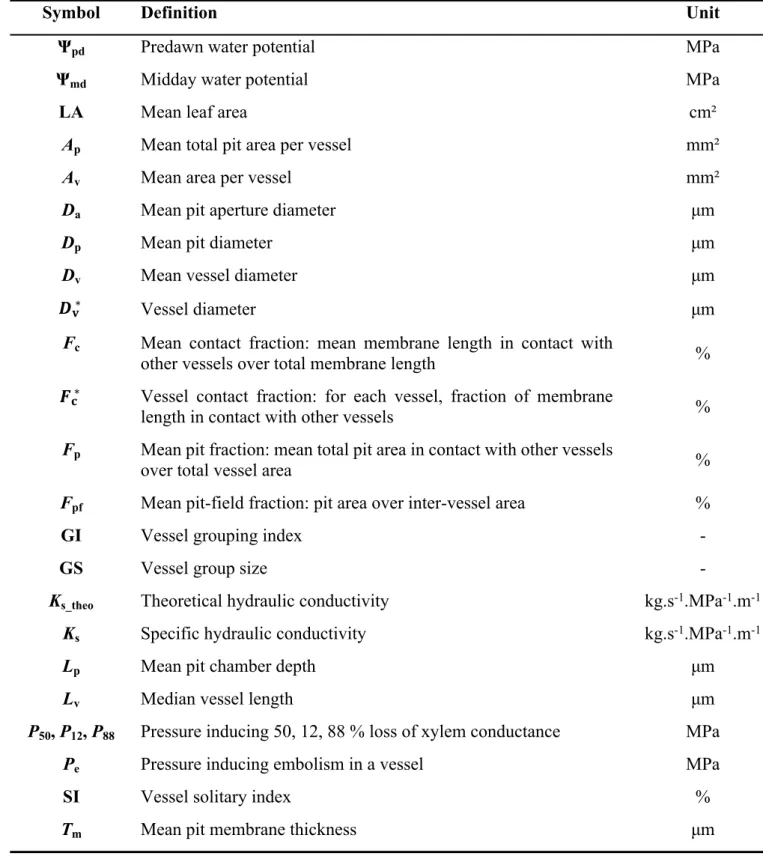
220 same area as the vessel lumen (for the symbols, see Table 1). The total vessel wall perimeter in
222 increased by five pixels using dilate function and if dilated vessels overlapped, they were
223 considered to be in contact. The maximum Feret diameter of the overlapping area was
224 considered to be their length of wall in contact. From there, the contact fraction (Fc) was
225 measured for each vessel as the ratio of length of wall in contact with other vessels over the
226 perimeter of the vessel. Vessels that shared wall were assigned to the same group. As a result,
227 the two-dimensional grouping index (GI) was the mean number of vessels per group and the
228 solitary index (SI) as the ratio of the number of solitary vessels to the total number of vessels.
229 These parameters were measured for each individual slice containing a mean of 850 vessels,
230 for droughted (n = 9), control (n = 5) and shaded (n = 6) plants.
231 Vessel length
232 The vessel length was measured by the silicon injection method (Sperry et al. 2005, Scholz et
233 al. 2013b) on the samples already used for Cavitron technique, after five months of drying at
234 room temperature. A fluorescent optical brightener (CAS number: 7128-64-5, Sigma-Aldrich,
235 St-Louis, MO, USA) was mixed in chloroform (1 % w/w) and added to a volume of silicon
236 (BLUESIL RTV-141 A, Bluestar Silicones, Lyon, France) with a proportion of one drop of
237 solution per gram of silicon. A Silicone hardener (BLUESIL RTV-141 B, Bluestar Silicones)
238 was added to the mixture in 1:10 proportion. The mixture was then injected under pressure (300
239 to 400 kPa) basipetally in the stem sample using a pressure chamber during at least 8 hours.
240 After silicone hardening (3 days at room temperature), the samples were cut 5 mm far from the
241 injection point; then every 20 mm. For each segment, a 25 µm thick slice was cut using a rotary
242 microtome (RM2165, Leica Microsystems, Wetzlar, Germany). Cross sections were dyed with
243 Astra Blue and mounted with a glycerol medium.
244 Images were obtained using a fluorescence microscope (Axio Observer Z1) equipped with a
245 300 to 400 nm band pass excitation filter, a digital camera (AxioCam 506), Zen imaging
247 vessels highlighted the open vessels, while white light allowed counting the total number of
248 vessels. The decrease of the ratio of open vessels (Nx) (i.e. fluorescent vessels) to the total
249 number of vessels (N0) over the distance (x) from the end of the sample followed an exponential
250 decay function (equation 4) where k is the best-fit extinction coefficient (Cohen et al. 2003).
251 𝑁𝑥= 𝑁0 × 𝑒―𝑘𝑥 (4)
252 The fraction of conduits of length x (P(x)) is obtained by multiplying x/N0 to the second
253 derivative of equation 4 (Wheeler et al. 2005):
254 𝑃(𝑥) = 𝑥 × 𝑘2× 𝑒―𝑘𝑥 (5)
255 The continuous cumulative function of vessel length (Lv) probability is a function given in the
256 equation 6.
257 𝑓(𝑥) = ∫𝐿v (6)
0𝑥𝑘
2.𝑒―𝑘𝑥d𝑥
258 When this cumulative function is equal to 0.5, this gives the median value of vessel length
259 (Lv) (equation 7).
260 𝑓(𝐿𝑣)= ―(𝑘𝐿𝑣+ 1).𝑒―𝑘𝐿𝑣+1 = 0.5 (7)
261 The solution of the equation 7 gives the median vessel length 𝐿𝑣 = 1.678/𝑘. This vessel
262 length was estimated for 7 droughted, 5 control and 5 shaded stem samples.
263 Transmission Electron Microscopy
264 Fresh samples of 1 cm long were cut into 2 to 4 mm3 blocks, immersed in Karnvosky's fixative
265 solution under vacuum for 30 min, then stored at 4 °C in the fixative solution for 3 weeks.
266 Blocks were recut into 1 to 2 mm3 pieces, then they were fixed secondarily for 4 hours at
267 ambient temperature in a 0.1M phosphate-buffered osmium tetroxide solution (1 %), pH 7.4.
268 Then, they were dehydrated in an ethanol series (25, 50, 70, 100, and 100 %) and embedded in
269 Epoxy resin using Epoxy medium kit (Sigma-Aldrich, St-Louis, MO, USA). Then, ultra-thin
270 sections (60-90 nm) were cut using an ultramicrotome (PowerTome PC, RMC Boeckeler,
272 with contrast solutions: UranyLess (Delta Microscopies, Mauressac, France) and lead citrate.
273 Sections were observed using a transmission electron microscope (H-7650, Hitachi
High-274 Technologies Corporation, Tokyo, Japan) at a voltage of 80 kV. Measurements of pit features
275 were performed on images with pits showing two apertures. Pits were characterized for their
276 diameter (Dp), their aperture diameter (Da), their chamber depth (Lp) and their membrane
277 thickness (Tm). For each pit, Da was the mean of two measurements while Lp and Tm were the
278 mean of four measurements. Pit features were measured for five individual trees for each
279 growth condition, with at least 10 pits measured per individual tree.
280 Scanning Electron Microscopy
281 Fresh samples were fixed in 3 % glutaraldehyde and stored at 4 °C for at least 1 month. Samples
282 of 4 cm long were cut longitudinally and then dehydrated in an ethanol series (30, 50, 75, and
283 100 %). After dehydration, samples were immerged in a 1:1 solution hexamethyldisilazane
284 (HMDS) + ethanol 100 % for 30 min and immerged in pure HDMS for 30 min. After air drying
285 overnight under a hood, the samples were mounted on aluminium stubs with carbon
double-286 sided adhesive disks, coated with gold/palladium in a sputter coater (SC7640, Quorum
287 Technologies Ltd, Newhaven, U.K.), and finally observed using a scanning electron
288 microscope (S-3400N, Hitachi High-Technologies Corporation, Tokyo, Japan) at a voltage of
289 5 kV. The portion of area covered by bordered pits in each inter-vessel pit-field (Fpf) was then
290 measured by image analysis using the ImageJ software. Five samples were measured per growth
291 condition, and seven pit-fields were characterized per sample.
292 Estimation of supplementary hydraulic and structural traits
293 Theoretical conductivities (Ks_theo) of all samples characterized by light microscopy were
294 calculated according to Scholz et al. (2013b) and converted into g.s-1.MPa-1.m-1 (equation 8).
295 𝐾s_theo= (8)
∑128 𝜂𝜋𝐷4v 𝐴x × 𝜌
296 Where η is the viscosity index of water (1.002 × 10⁻⁹ m4.MPa-1.s-1 at 20 °C), ρ is the density of
297 water (9.982 × 10⁵ g.m-3) and A
x is the xylem cross-section area.
298 The pit fraction (Fp) was defined as the product of the pit-field fraction (Fpf) and the contact
299 fraction (Fc) (equation 9).
300 𝐹𝑝= 𝐹𝑝𝑓× 𝐹𝑐 (9)
301 The pit fraction was measured on five individual trees for each growth condition.
302 The vessel area (Av) was estimated as the area of a cylinder according to the equation 10.
303 𝐴𝑣= 𝐷𝑣× 𝐿𝑣× 𝜋 + 2𝜋
(
(10)𝐷𝑣
2
)
2304 It was measured for 7 droughted, 5 control and 5 shaded trees.
305 The pit area per vessel (Ap) was calculated as the product of the vessel area Av by pit fraction
306 Fp (equation 11).
307 𝐴𝑝= 𝐴𝑣× 𝐹𝑝 (11)
308 It was measured for 4 droughted, 5 control and 4 shaded individuals.
309 Xylem water potentials at the onset of xylem embolism (P12) and at full embolism (P88) were
310 calculated using equation 12 and 13 respectively (Domec and Gartner 2001), using the
311 experimental values of P50 and S resulting from equation 1.
312 𝑃12= 𝑃50+ (12) 50 𝑆 313 𝑃88= 𝑃50― (13) 50 𝑆 314
315 Measurement of individual vessel vulnerability to embolism using multispectral approach
316 combining X-ray microtomography and light microscopy
317 Two stem segments from droughted plants and two from control plants were sampled and
318 prepared in the same condition as for vulnerability to embolism measurements. We used the
320 long using a razor blade, sealed in liquid paraffin wax in order to prevent dehydration during
321 the microtomography scans. A first 21 min scan was acquired using a X-ray microtomography
322 system (Phoenix Nanotom, General Electric, Boston, MA, USA) at the centre of the segment
323 as described below to reveal the native state of embolism in each shoot. The field-of view was
324 7.8 × 7.8 × 7.8 mm3 and covered each full cross section of the samples. X-ray source settings
325 were 60 kV and 240 µA. 1000 images were recorded during the 360 ° rotation of the sample
326 and the final spatial resolution was 3.9 µm.
327 Then, the paraffin was broken at the ends in order to allow the water flow and the sample was
328 set in a Cavitron during 5 min at 0.8 MPa, immerged in paraffin and scanned again with the
X-329 ray microtomograph at the same location than previously in order to observe the new embolism
330 status. The same procedure was repeated for increasing pressure steps, until - 4 MPa (Fig. 1).
331 Then, the stem sample was cut in the air at 5 mm above the scanned section in order to generate
332 100 % of embolism of the functional vessels and a last microtomographic scan was performed
333 in order to visualize this complete vessel network.
334 The sample was then dried several days in room conditions and a transverse section of 25 µm
335 thick was cut with a rotary microtome (RM2165, Leica Microsystems). Sections were dyed
336 with series of baths as following: bleach (about 15 sec), acetic acid, Astra blue (1 min), acetic
337 acid, safranin (1 min), acetic acid with a water bath between each solution, then an ethanol
338 series (50, 70, 100 and 100 %). The sections were mounted in Eukitt. Images were processed
339 using a microscope (Zeiss Axio Observer Z1), a digital camera (AxioCam MRc) and Zen
340 imaging software system (Zeiss, Jena, Germany). Image analyses were performed using Fiji
341 software (under ImageJ version 2.0.0-rc-68/1.52h) (Schindelin et al. 2012, Schneider et al.
342 2012), using the same method described in the section for light microscopy. The diameter of
343 each vessel (𝐷𝑣∗) was estimated as the diameter of the circle that provided the same area as the
345 fraction of membrane in contact with other vessels (𝐹𝑐∗) were also estimated on the
cross-346 section plane. Finally, the relative distance from the pith was measured for each vessel as the
347 ratio of the distance from the pith to the vessel over the distance from the pith to the cambium.
348 The microtomography scans were reconstructed in three-dimension (3D) using Phoenix datosx
349 2 software (General Electric, Boston, MA, USA) with spatial resolution of 6.8 × 6.8 × 6.8 µm3
350 per voxel. Then, for each 3D-reconstruction, a cross section was extracted at the exact same
351 location as with the microscopy section. For each vessel in the cross sections, its embolism
352 pressure (Pe) is defined as being the centrifugation-induced pressure from which the vessel
353 appeared to be air-filled on microtomographic images (Fig. 1, A-D).
354 For each sample, images from x-ray microtomography observation (virtual cross sections built
355 by 3D reconstruction) were aligned on the light microscopy image (stem cross section observed
356 by light microscopy) using the “Align image by line ROI” tool (Schindelin et al. 2012) of Fiji
357 software. A unique identification number was given to each vessel observed in images from
358 both techniques, in order to link the embolism pressure with anatomical parameters (Fig. 1, E).
359 A total of 2570 vessels were identified. Vessels were grouped per 𝐷𝑣∗, per 𝐹𝑐∗ and per GS
360 classes. Classes were sized to be as uniform as possible, counting from 183 up to 748 vessels.
361 A total of 1100 solitary vessels were grouped in the same class when required. Cumulative
362 number of embolized vessels was plotted according to their Pe and, for each class, a Weibull
363 function was fit (equation 1).
364 Statistical analysis
365 The statistical analysis was performed using the RStudio software (version 1.1.456; running
366 under R core version 3.5.1, R Development Core Team 2008). One way ANOVA was used for
367 comparing the means between the three growth conditions. When we found a significant
369 between growth conditions. The correlations between the structural traits and the P50 and Pe
370 were calculated using linear regressions.
371
372 Results
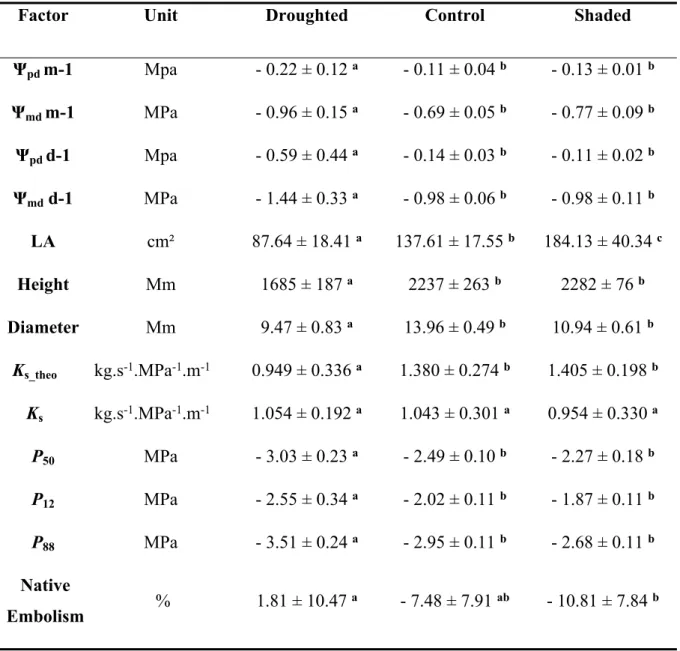
373 Continuous recordings of the radial growth showed a significant lower growth for the droughted
374 plants throughout the experiment (Fig. S2, Table 2). These plants also showed a lower height,
375 lower leaf area, lower Ψpd and lower Ψmd, demonstrating the significant effect of our drought
376 treatment. The higher leaf area for shaded plants compared to control plants is an evidence that
377 the shading conditions affected the plant development.
378 Growing plants under different environmental conditions aimed to induce wide variations in
379 xylem vulnerability to embolism. The three growth conditions spread the measured P50 over
380 range from - 2.00 to - 3.47 MPa (Table S1), with a difference of 1.04 MPa between the most
381 resistant droughted plant and the most vulnerable control plant and a difference of 1.47 MPa
382 between the most resistant droughted plant and the most vulnerable shaded plant. A
383 significantly lower P50 was found on droughted plants when compared to control and shaded
384 plants (p < 0.001, Table 2), while the slopes of the vulnerability curves were not different
385 between the growth conditions (Fig. 2, A). Despite a slightly higher native embolism for
386 droughted plants compared to shaded plants, Ψmid was higher than the inflexion point of the
387 vulnerability curve (P12) for every growth conditions. This allows excluding any effect of these
388 quite low native embolism on measured P50. We observed no difference for mean KS between
389 the growth conditions (Fig. 2, B), suggesting no plasticity for this trait in our experimental
390 conditions. When considering the vessel diameter, a reduced Ks_theo was measured in the
392 The analyses combining different methods (light microscopy, TEM, SEM), allowed measuring
393 a large set of anatomical traits from tissue to pit levels. The correlation between these traits and
394 the P50 was assessed (Fig. 3, 4).
395 The traits measured at tissue level (GI, SI and Fp) showed a strong linear correlation with P50
396 (R2 > 0.70; p < 0.001; Fig. 3, 4), except F
c that exhibited a weaker correlation (R2 = 0.38; p =
397 0.004). These results put in light a relationship between vessel connectivity, vessel grouping
398 and vulnerability to embolism (negative relationship for Fc, GI and Fp; positive relationship for
399 SI). However, we found no correlation between pit-field fraction (Fpf) and P50, with no variation
400 among the growth conditions (Table 3). We observed a strong positive relationship (p < 0.001)
401 between P50 and the vessel dimensions (Lv, Dv and Av) showing that larger vessels with larger
402 pit area tend to be associated with an increase in vulnerability to embolism (R2 > 0.75;
403 p < 0.001). The positive correlation between P50 and Ap (R2 = 0.78; p < 0.001, Fig. 4)
404 highlighted the link between the area of vessels covered by bordered pits and the xylem
405 vulnerability to embolism.
406 No linear correlation appeared between the pit structure parameters (Da, Dp, Lp and Tm) and the
407 P50: we observed no variation for Da, Dp and Tm among growth conditions.
408 Using x-ray microtomograph, the direct visualization of embolism inside the xylem (Fig. 1)
409 allowed evaluating the vulnerability to embolism (Pe) of individual vessels. The multispectral
410 analysis combining x-ray tomographic observations and the measurements made on light
411 microscopy images allowed establishing the link between Pe and the structural parameters of
412 each vessel (Fig. 5). The correlation between 𝐷𝑣∗ and Pe (Fig. 5, A) was clear: wider vessels
413 appeared more vulnerable than the narrower ones. 𝐹𝑐∗ showed a smaller influence on Pe (Fig.
414 5, B): solitary vessels (𝐹𝑐∗ ≤ 1 %) and weakly connected vessels (1 < 𝐹𝑐∗ ≤ 20 %) were more
415 vulnerable than the highly connected vessels (𝐹𝑐∗> 20 %). The link between GS and Pe (Fig. 5,
417 grouped vessels (GS ≥ 2) were less vulnerable. Despite a significant correlation between Pe
418 and 𝐷∗, and GS (p < 0.001; Fig. 6), the strength of the correlation was poor (R2 < 0.25). 𝑣 𝐹𝑐∗
419 We also noticed that the position of the vessel in the cross section is linked to its vulnerability
420 (Fig 1): the more the vessels were far from the pith, the more they were more resistant to
421 embolism. (R2 = 0.49; p < 0.001; Fig. 5, D; Fig. 6).
422
423 Discussion
424 The range for P50 plasticity induced by the growth conditions was large: 0.76 MPa between the
425 mean P50 of droughted and shaded plants (Table 2; Fig. 2, A) and up to 1.47 MPa between two
426 individuals. This is consistent with previous studies: Awad et al. (2010) reported a difference
427 of 0.63 MPa between droughted and well-watered plants; Plavcová and Hacke (2012) reported
428 a difference of 1.08 MPa between droughted and shaded Populus trichocarpa x deltoides plants.
429 Therefore, the plasticity induced by our experimental setup was probably close to the maximum
430 we could expect according to the literature.
431 The absence of difference in specific hydraulic conductivity (Ks) between droughted and control
432 plants (Table 2; Fig. 2, B) was consistent with the results of Gleason et al. (2016): who reported
433 a poor correlation between vulnerability to embolism and Ks in their meta-analysis.
434 Furthermore, the lack of trade-off between hydraulic efficiency and safety was also observed
435 within species (Awad et al. 2010, Plavcová and Hacke 2012, Schuldt et al. 2016). A significant
436 decrease of the theoretical conductivities (Ks_theo) was found for droughted plants compared to
437 other plants (Table 2), relying on a decrease in vessel diameter (Dv) (Table 3); whereas the pit
438 structure was not modified (Table 3). However, This theoretical decrease in lumen conductance
439 in droughted plants is only based on the Poiseuille’s law and could be offset by other changes
440 we did not investigate, such as three-dimensional xylem organization, vessel wall sculpturing,
442 P50 was correlated with anatomical traits related to pit quantity characteristics measured at the
443 xylem and vessel levels (significant correlations with R2 > 0.7 for 7 out of the 9 traits; Fig. 3,
444 4). These pit quantity parameters were correlated between them, which is not very surprising
445 since they all measure slightly different features of vessel connectivity (Table S2; Fig. S3).
446 Indeed, such correlations were also found when comparing Acer species (Lens et al. 2011). By
447 contrast, no correlation was found with the traits related to the pit dimensions (Da, Dp, Lp and
448 Tm; Fig. 3). Thus, the pit ultrastructure does not appear as a driver of the plasticity of
449 vulnerability to embolism in Populus tremula x alba (Fig. S1). Despite a key role of Tm in
450 determining vulnerability to embolism, the air-seeding pressures for thin pit membrane such as
451 those of poplar xylem would not be influenced by slight changes in its thickness (Li et al. 2016,
452 Kaack et al. 2019). So, the role of pit structure in plasticity of vulnerability to embolism remains
453 to be tested in species having much thicker intervessel pit membranes. The observation of a
454 variation in vessel diameter not associated with a variation in pit membrane thickness is not
455 surprising, since this has already been reported when comparing the anatomy between organs
456 along the flow path in several species of angiosperm (Klepsch et al. 2018). Other relevant pit
457 parameters could also be considered, but suitable methods for investigating their variability are
458 lacking. For example, the pit membrane porosity contributes to the differences in vulnerability
459 to embolism (Jansen et al. 2009, Li et al. 2016, Kaack et al. 2019); but this parameter is difficult
460 to measure accurately because pores include a series of various pore constrictions, and the
461 narrowest constriction should be the main bottleneck (Kaack et al. 2019, Kaack et al. 2020,
462 Zhang et al. 2020). The role of the biochemical composition of the pit membrane in the
463 plasticity of vulnerability to embolism cannot be excluded too. Besides, there have been recent
464 advances in the understanding of the pit membrane biochemistry, including a role for lipids
465 (Herbette et al. 2015, Klepsch et al. 2016, Schenk et al. 2017, Pereira et al. 2018, Schenk et al.
467 determinant of between-species differences in vulnerability to embolism, but it was not
468 involved in the plasticity of vulnerability to embolism (Herbette and Cochard 2010).
469 At the interspecific level, pit ultrastructure parameters, especially the pit membrane thickness,
470 was identified as the major traits involved in variation in vulnerability to embolism (Jansen et
471 al. 2009; Tixier et al. 2014, Li et al. 2016, Kaack et al. 2019). In addition, between species
472 differences in vulnerability to embolism also depend on pit mechanical behaviour (Tixier et al.
473 2014). The probability for air seeding through large pores is expected to be higher when more
474 pits are present (rare pit hypothesis proposed by Christman et al. 2009). The pit area can thus
475 explain differences in vulnerability to embolism for some angiosperm groups but not for others
476 (Lens et al. 2013). Thus, when explaining the variability in vulnerability to embolism between
477 species, this trait, which depends on the vessel dimensions and xylem organization, does not
478 appear very relevant (Lens et al. 2013). Lens et al. (2011) tested the relationship between several
479 pit quantity and pit structure properties and vulnerability to embolism for 11 acer species. They
480 found that vulnerability to embolism strongly correlated with depth of bordered pit chamber
481 (Lp) and pit membrane thickness (Tm) whereas no relationship was found between vulnerability
482 to embolism and vessel diameter (Dv) and total pit area per vessel (Ap). By contrast, our results
483 suggest that the plasticity of vulnerability to embolism in poplar is controlled by the xylem
484 organization and vessel dimensions, and not by changes in pit structure. Thus, the mechanisms
485 controlling the inter-specific variability in vulnerability to embolism seem to be different from
486 the drivers of the within species plasticity in poplar. Complementary works on plasticity need
487 to be carried out on other species, particularly on species with much thicker pit membranes, in
488 order to test the genericity of the findings of this study. It would not be surprising if the
489 mechanisms of plasticity could be different depending on the species. A recent modelling
490 analysis of the relationships between the functional and structural pit properties provides some
492 (Kaack et al. 2020). According to this analysis considering the internal structure of the pit
493 membrane, three functional types of pit can be distinguished based on their Tm : (1) a pit with a
494 thin Tm (< 150 nm) would have large pores causing a low embolism resistance not very sensitive
495 to the pit area, (2) a pit with a thick Tm (>400 nm) with narrow pores allowing high embolism
496 resistance insensitive to the pit area and (3) an intermediate pit membrane type, with embolism
497 resistance strongly affected by the pit area. This latter type includes the case we studied and
498 thus it agrees well with our results. Indeed, the model predicts that the vulnerability to embolism
499 is strongly affected by the pit area for vessels with a pit membrane thickness of 250 nm.
500 The multispectral analysis combining X-ray microtomography analysis with light microscopy
501 revealed that Pe shows the strongest correlation with the position of the vessel relative to the
502 pith (Fig. 6). However, significant correlations were also found between the others xylem traits
503 (Dv, Fc and GS) and this radial position (p < 0.001), so no clear conclusion can be drawn about
504 an effect of vessel age or position on its vulnerability to embolism. The stem fully developed
505 in 3 months, and much less for the secondary xylem of the stem part investigated by X-ray
506 microtomography. We thus assume that the age difference is too weak to explain such
507 difference in vulnerability to embolism. Indeed, in diffuse-porous species, an age effect in
508 vulnerability to embolism has been reported between vessels formed in different years but not
509 between vessels of the same year (Melcher et al. 2003). Moreover, investigations of the
510 embolism spread in current-year stem of vine or walnut tree using the same approach did not
511 conclude to an age effect in the secondary xylem (Brodersen et al. 2013, Knipfer et al. 2015).
512 These two previous studies showed that embolisms formed first in vessels surrounding the pith,
513 then they spreaded overwhelmingly radially while the water potential was decreasing. The
514 sequence of embolism formation and spreading in our study could therefore be related to the
515 mechanism explained by Brodersen et al. (2013). More, we also hypothesize that vulnerability
517 Although the soil moisture content was kept constant, the midday water potential of the plant
518 decreased as the plant grew (Table 2). The pressure inducing embolism being correlated with
519 the midday water potential experienced by plants (Awad et al. 2010), the acclimation of
520 vulnerability to embolism would occur during the development of plants.
521 Vulnerability curves are commonly established by measuring the impact of embolism on the
522 conductance, but not the embolism rates. Thus, “hydraulic vulnerability” is a more suitable term
523 when comparing xylems for P50 using these methods. Conversely, X-ray microtomography
524 methods really allow assessing the local vulnerability to embolism.
525 Our results showing a strong relationship between P50 and some vessel and xylem tissue
526 parameters provide three non-exclusive explanations for the acclimation of hydraulic
527 vulnerability. This latter relies on changes in vulnerability to embolism of the vessels or on
528 changes in the effect of the embolism on conductance. First, our study shows that vulnerable
529 individuals exhibited larger vessels (both longer (Lv) and wider (Dv); Fig. 3). When a large
530 vessel embolizes, it generates a greater impact on the hydraulic conductivity compared to a
531 smaller vessel. Thus, a xylem having a high proportion of large vessels undergoes an important
532 drop of conductivity after each vessel embolism. Second, we found that vulnerable xylems had
533 a greater SI and a lower GI and Fc. Redundancy in the xylem has already been linked with a
534 lower hydraulic vulnerability using a modelling approach (Ewers et al. 2007, Mrad et al. 2018).
535 High connectivity and grouping is an efficient way to maintain the hydraulic conductance
536 despite embolized vessels in the xylem by providing alternative pathways to the water flow
537 (Carlquist 1966, Schuldt et al. 2016). Third, larger vessels have a larger pit area per vessel (Ap)
538 and would thus be more prone to embolism, according to the pit area hypothesis (Christman et
539 al. 2009). Multispectral analysis combining X-ray microtomography and light microscopy
540 allowed monitoring the dynamics of xylem embolism and in particular determining the
542 since larger vessels (𝐷𝑣∗) showed a higher vulnerability to embolism– as noticed by Cai and
543 Tyree (2010) using a statistical, indirect and destructive technique and by Jacobsen et al. (2019)
544 using a similar approach. Nevertheless, the poor correlations (low R² values) between the
545 embolism pressure of each vessel (Pe) and 𝐷𝑣∗, 𝐹𝑐∗ or GS suggest that the rare pit hypothesis is
546 far from being sufficient for explaining the hydraulic vulnerability inside a stem sample.
547 According to Kaack et al. (2019), the rare pit hypothesis is not compatible with the three
548 dimensional structure of the pit. Other additional mechanisms could be involved to explain the
549 plasticity of hydraulic vulnerability observed among growth conditions: they would include the
550 effect of redundancy and of vessel embolized volume on the loss of conductance, or change in
551 pore constrictions in pit membranes. That is why we assume that the different mechanisms we
552 described here act together to design the hydraulic vulnerability during acclimation. The lowest
553 correlations found between Pe and 𝐹𝑐∗ or GS point to the limitations of a bi-dimensional
554 approach to analyse vessel connectivity. Some studies reported analyses of the
three-555 dimensional xylem network (Brodersen et al. 2011), that allowed investigating events of
556 embolism formation and spreading (Brodersen et al. 2013, Knipfer et al. 2015, 2016, Torres et
557 al. 2016). Rather short segments (2-6 mm long) were examined what was enough for their study.
558 The vessels having an average length of about ten cm (up to 30 cm), would require analysis of
559 the vessel organization over a longer sample length for a full quantification of their
560 connectivity. This was impossible with the x-ray microtomograph device we used. Moreover,
561 such a large volume of wood could not be scanned without a very high temperature increase to
562 maintain sufficient resolution.
563 In conclusion, we found that the acclimation of vulnerability to embolism to contrasted growth
564 conditions in hybrid poplar did not rely on a change in pit ultrastructure, contrary to what was
565 reported when comparing species. Thus, within-species plasticity in hybrid poplar and
567 showed that an increase in resistance to embolism in poplar is related to an increase in vessels
568 connectivity and grouping and a decrease in vessel dimensions, leading to reduce the likelihood
569 of air seeding through a pit and the effect the resulting embolism events on hydraulic
570 conductance. This study will allow focusing on the relevant candidate genes controlling
571 vulnerability to embolism such as those involved in vessels grouping and connectivity or vessel
572 dimensions. These genes include the aquaporins involved in cell expansion during xylogenesis
573 (Plavcová et al. 2013), the genes controlling the cell wall metabolism in xylem such as VND6,
574 VND7 and MYB46, which expression levels changed in response to an abiotic stress (Plavcová 575 et al. 2013, Taylor-Teeples et al. 2016) or CLE genes (CLE41 and CLE44) that repress the
576 xylem differentiation (De Rybel et al. 2016).
577
578 Funding
579 This work was supported by European Union within the context of European Regional
580 Development Fund (ERDF).
581 Acknowledgements
582 The authors thank Christelle Boisselet and Brigitte Girard for the plant production, Christophe
583 Serre for the LDVT preparation, Romain Souchal for the balances and LVDT set up, Patrice
584 Chaleil, Aline Faure and Stephane Ploquin for growing the plants in the greenhouse, André
585 Marquier for the PAR measurements and Felix Hartmann for his help in calculating the vessel
586 length. The authors also thank the PhenoBois plateform for the X-ray microtomography facility.
587 Authors' contributions
588 C.L. and S.H. designed the study and wrote the manuscript with contributions from all authors.
589 C.L., S.H., P.C. and J.C. performed field work and hydraulic measurements; C.L., N.B-M.,
591 microscopy; C.L., P.C. and E.B. performed X-ray microCT; C.L., P.C. and E.B. performed
593 References
594 Adams HD, Zeppel MJB, Anderegg WRL, Hartmann H, Landhäusser SM, Tissue DT, Huxman
595 TE, Hudson PJ, Franz TE, Allen CD, Anderegg LDL, Barron-Gafford GA, Beerling DJ,
596 Breshears DD, Brodribb TJ, Bugmann H, Cobb RC, Collins AD, Dickman LT, Duan H,
597 Ewers BE, Galiano L, Galvez DA, Garcia-Forner N, Gaylord ML, Germino MJ, Gessler
598 A, Hacke UG, Hakamada R, Hector A, Jenkins MW, Kane JM, Kolb TE, Law DJ, Lewis
599 JD, Limousin J-M, Love DM, Macalady AK, Martínez-Vilalta J, Mencuccini M,
600 Mitchell PJ, Muss JD, O’Brien MJ, O’Grady AP, Pangle RE, Pinkard EA, Piper FI,
601 Plaut JA, Pockman WT, Quirk J, Reinhardt K, Ripullone F, Ryan MG, Sala A, Sevanto
602 S, Sperry JS, Vargas R, Vennetier M, Way DA, Xu C, Yepez EA, McDowell NG (2017)
603 A multi-species synthesis of physiological mechanisms in drought-induced tree
604 mortality. Nat Ecol Evol 1:1285–1291.
605 Allario T, Tixier A, Awad H, Lemaire C, Brunel N, Badel É, Barigah TS, Julien J-L, Peyret P,
606 Mellerowicz EJ, Cochard H, Herbette S (2018) PtxtPME1 and homogalacturonans
607 influence xylem hydraulic properties in poplar. Physiol Plant 163:502–515.
608 Anderegg WRL, Flint A, Huang C, Flint L, Berry JA, Davis FW, Sperry JS, Field CB (2015)
609 Tree mortality predicted from drought-induced vascular damage. Nature Geosci 8:367–
610 371.
611 Anderegg WRL, Klein T, Bartlett M, Sack L, Pellegrini AFA, Choat B, Jansen S (2016)
Meta-612 analysis reveals that hydraulic traits explain cross-species patterns of drought-induced
613 tree mortality across the globe. PNAS 113:5024–5029.
614 Awad H, Barigah T, Badel É, Cochard H, Herbette S (2010) Poplar vulnerability to xylem
615 cavitation acclimates to drier soil conditions. Physiol Plant 139:280–288.
616 Barigah TS, Charrier O, Douris M, Bonhomme M, Herbette S, Améglio T, Fichot R, Brignolas
617 F, Cochard H (2013) Water stress-induced xylem hydraulic failure is a causal factor of
618 tree mortality in beech and poplar. Ann Bot 112:1431–1437.
619 Barigah TS, Ibrahim T, Bogard A, Faivre-Vuillin B, Lagneau LA, Montpied P, Dreyer E (2006)
620 Irradiance-induced plasticity in the hydraulic properties of saplings of different
621 temperate broad-leaved forest tree species. Tree Physiol 26:1505–1516.
622 Brodersen CR, Lee EF, Choat B, Jansen S, Phillips RJ, Shackel KA, McElrone AJ, Matthews
623 MA (2011) Automated analysis of three-dimensional xylem networks using
high-624 resolution computed tomography. New Phytol 191(4), 1168-1179.
625 Brodersen CR, McElrone AJ, Choat B, Lee EF, Shackel KA, Matthews MA (2013) In vivo
626 visualizations of drought-induced embolism spread in Vitis vinifera. Plant Physiol
627 161(4): 1820-1829.
628 Cai J, Tyree MT (2010) The impact of vessel size on vulnerability curves: data and models for
629 within-species variability in saplings of aspen, Populus tremuloides Michx. Plant Cell
630 Env 33:1059–1069.
631 Carlquist S (1966) Wood Anatomy of Compositae: A Summary, With Comments on Factors
634 Choat B, Cobb AR, Jansen S (2008) Structure and function of bordered pits: new discoveries
635 and impacts on whole-plant hydraulic function. New Phytol 177: 608−626.
636 Choat B, Jansen S, Brodribb TJ, Cochard H, Delzon S, Bhaskar R, Bucci SJ, Feild TS, Gleason
637 SM, Hacke UG, Jacobsen AL, Lens F, Maherali H, Martínez-Vilalta J, Mayr S,
638 Mencuccini M, Mitchell PJ, Nardini A, Pittermann J, Pratt RB, Sperry JS, Westoby M,
639 Wright IJ, Zanne AE (2012) Global convergence in the vulnerability of forests to
640 drought. Nature 491:752–755.
641 Choat B, Pittermann J (2009) New insights into bordered pit structure and cavitation resistance
642 in angiosperms and conifers. New Phytol 182: 557-560.
643 Christman MA, Sperry JS, Adler FR (2009) Testing the ‘rare pit’ hypothesis for xylem
644 cavitation resistance in three species of Acer. New Phytol 182:664–674.
645 Cochard H (2002) A technique for measuring xylem hydraulic conductance under high negative
646 pressures. Plant Cell Env 25:815–819.
647 Cochard H, Badel E, Herbette S, Delzon S, Choat B, Jansen S (2013) Methods for measuring
648 plant vulnerability to cavitation: a critical review. J Exp Bot 64:4779–4791.
649 Cochard H, Damour G, Bodet C, Tharwat I, Poirier M, Améglio T (2005) Evaluation of a new
650 centrifuge technique for rapid generation of xylem vulnerability curves. Physiol Plant
651 124:410–418.
652 Cochard H, Delzon S, Badel É (2015) X-ray microtomography (micro-CT): a reference
653 technology for high-resolution quantification of xylem embolism in trees. Plant Cell
654 Env 38:201–206.
655 Cochard H, Hölttä T, Herbette S, Delzon S, Mencuccini M (2009) New insights into the
656 mechanisms of water-stress-induced cavitation in conifers. Plant Physiol 151:949–954.
657 Cohen S, Bennink J, Tyree M (2003) Air method measurements of apple vessel length
658 distributions with improved apparatus and theory. J Exp Bot 54:1889–1897.
659 Cooke JEK, Martin TA, Davis JM (2005) Short-term physiological and developmental
660 responses to nitrogen availability in hybrid poplar. New Phytol 167:41–52.
661 De Rybel B, Mähönen AP, Helariutta Y, Weijers D (2016) Plant vascular development: from
662 early specification to differentiation. Nat Rev Mol Cell Biol 17:30–40.
663 Domec J-C, Gartner BL (2001) Cavitation and water storage capacity in bole xylem segments
664 of mature and young Douglas-fir trees. Trees 15:204–214.
665 Ewers FW, Ewers JM, Jacobsen AL, López-Portillo J (2007) Vessel redundancy: Modeling
666 safety in numbers. IAWA J 28:373–388.
667 Fichot R, Barigah TS, Chamaillard S, Le Thiec D, Laurans F, Cochard H, Brignolas F (2010)
668 Common trade-offs between xylem resistance to cavitation and other physiological
669 traits do not hold among unrelated Populus deltoides ×Populus nigra hybrids. Plant Cell
671 Gleason SM, Westoby M, Jansen S, Choat B, Hacke UG, Pratt RB, Bhaskar R, Brodribb TJ,
672 Bucci SJ, Cao K-F, Cochard H, Delzon S, Domec J-C, Fan Z-X, Feild TS, Jacobsen AL,
673 Johnson DM, Lens F, Maherali H, Martínez‐Vilalta J, Mayr S, McCulloh KA,
674 Mencuccini M, Mitchell PJ, Morris H, Nardini A, Pittermann J, Plavcová L, Schreiber
675 SG, Sperry JS, Wright IJ, Zanne AE (2016) Weak tradeoff between xylem safety and
676 xylem-specific hydraulic efficiency across the world’s woody plant species. New Phytol
677 209:123–136.
678 Hacke UG, Sperry JS, Wheeler JK, Castro L (2006) Scaling of angiosperm xylem structure
679 with safety and efficiency. Tree Physiol 26: 689–701.
680 Hajek P, Leuschner C, Hertel D, Delzon S, Schuldt B (2014) Trade-offs between xylem
681 hydraulic properties, wood anatomy and yield in Populus. Tree Physiol 34:744–756.
682 Hammond WM, Yu K, Wilson LA, Will RE, Anderegg WRL, Adams HD (2019) Dead or
683 dying? Quantifying the point of no return from hydraulic failure in drought-induced tree
684 mortality. New Phytol 223:1834–1843.
685 Hartmann H, McDowell NG, Trumbore S (2015) Allocation to carbon storage pools in Norway
686 spruce saplings under drought and low CO2. Tree Physiol 35:243–252.
687 Herbette S, Bouchet B, Brunel N, Bonnin E, Cochard H, Guillon F (2015) Immunolabelling of
688 intervessel pits for polysaccharides and lignin helps in understanding their hydraulic
689 properties in Populus tremula × alba. Ann Bot 115:187–199.
690 Herbette S, Cochard H (2010) Calcium Is a Major Determinant of Xylem Vulnerability to
691 Cavitation. Plant Physiol 153:1932–1939.
692 Herbette S, Wortemann R, Awad H, Huc R, Cochard H, Barigah TS (2010) Insights into xylem
693 vulnerability to cavitation in Fagus sylvatica L.: phenotypic and environmental sources
694 of variability. Tree Physiol 30:1448–1455.
695 Jacobsen AL, Pratt RB, Venturas MD, Hacke UG (2019) Large volume vessels are vulnerable
696 to water-stress-induced embolism in stems of poplar. IAWA J 40: 4-22.
697 Jansen S, Klepsch M, Li S, Kotowska M, Schiele S, Zhang Y, Schenk H (2018) Challenges in
698 understanding air-seeding in angiosperm xylem. Acta Hort 1222: 13-20.
699 Jansen S, Choat B, Pletsers A (2009) Morphological variation of intervessel pit membranes and
700 implications to xylem function in angiosperms. Am J Bot 96:409–419.
701 Jinagool W, Lamacque L, Delmas M, Delzon S, Cochard H, Herbette S (2018) Is there
702 variability for xylem vulnerability to cavitation in walnut tree cultivars and species
703 (Juglans spp.)? HortSci 53:132–137.
704 Jinagool W, Rattanawong R, Sangsing K, Barigah TS, Gay F, Cochard H, Kasemsap P,
705 Herbette S (2015) Clonal variability for vulnerability to cavitation and other
drought-706 related traits in Hevea brasiliensis Müll. Arg. J Plant Hydraul 2:e001.
707 Kaack L, Altaner CM, Carmesin C, Diaz A, Holler M, Kranz C, Neusser G, Odstrcil M, Schenk
708 HJ, Schmidt V, Weber M, Zhang Y, Jansen S (2019) Function and three-dimensional
710 Kaack L, Weber M, Isasa E, Karimi Z, Li S, Pereira L, Trabi CL, Zhang Y, Schenk HJ, Schuldt
711 B, Schmidt V, Jansen S (2020) Pore constrictions in intervessel pit membranes reduce
712 the risk of embolism spreading in angiosperm xylem. bioRxiv:345413.
713 Klepsch MM, Schmitt M, Paul Knox J, Jansen S (2016) The chemical identity of intervessel pit
714 membranes in Acer challenges hydrogel control of xylem hydraulic conductivity. AoB
715 PLANTS 8: plw052.
716 Klepsch M, Zhang Y, Kotowska MM, Lamarque LJ, Nolf M, Schuldt B, Torres-Ruiz JM, Qin
717 D-W, Choat B, Delzon S, Scoffoni C, Cao K-F, Jansen S (2018) Is xylem of angiosperm
718 leaves less resistant to embolism than branches? Insights from microCT, hydraulics, and
719 anatomy. J Exp Bot 69:5611–5623.
720 Knipfer T, Brodersen CR, Zedan A, Kluepfel DA, McElrone AJ (2015) Patterns of
drought-721 induced embolism formation and spread in living walnut saplings visualized using
X-722 ray microtomography. Tree Physiol 35: 744-755.
723 Knipfer T, Cuneo IF, Brodersen CR, McElrone AJ (2016) In situ visualization of the dynamics
724 in xylem embolism formation and removal in the absence of root pressure: a study on
725 excised grapevine stems. Plant Physiol 171(2), 1024-1036.
726 Lamy J-B, Bouffier L, Burlett R, Plomion C, Cochard H, Delzon S (2011) Uniform selection
727 as a primary force reducing population genetic differentiation of cavitation resistance
728 across a species range. PLOS ONE 6:e23476.
729 Lamy J-B, Plomion C, Kremer A, Delzon S (2012) QST < FST As a signature of canalization.
730 Mol Ecol 21:5646–5655.
731 Lens F, Sperry JS, Christman MA, Choat B, Rabaey D, Jansen S (2011) Testing hypotheses
732 that link wood anatomy to cavitation resistance and hydraulic conductivity in the genus
733 Acer. New Phytol 190:709–723.
734 Lens F, Tixier A, Cochard H, Sperry JS, Jansen S, Herbette S (2013) Embolism resistance as a
735 key mechanism to understand adaptive plant strategies. Cur Op Plant Biol 16:287–292.
736 Li S, Lens F, Espino S, Karimi Z, Klepsch M, Schenk HJ, Schmitt M, Schuldt B, Jansen S
737 (2016) Intervessel pit membrane thickness as a key determinant of embolism resistance
738 in angiosperm xylem. IAWA J 37:152–171.
739 Loepfe L, Martinez-Vilalta J, Pinol J, Mencuccini M (2017) The relevance of the xylem
740 network structure for plant hydraulic efficiency and safety. J Th Biol 247: 788-803.
741 Maherali H, Moura CF, Caldeira MC, Willson CJ, Jackson RB (2006) Functional coordination
742 between leaf gas exchange and vulnerability to xylem cavitation in temperate forest
743 trees. Plant Cell Env 29:571–583.
744 Martínez‐Vilalta J, Cochard H, Mencuccini M, Sterck F, Herrero A, Korhonen JFJ, Llorens P,
745 Nikinmaa E, Nolè A, Poyatos R, Ripullone F, Sass‐Klaassen U, Zweifel R (2009)
746 Hydraulic adjustment of Scots pine across Europe. New Phytol 184:353–364.
747 Melcher PJ, Zwieniecki MA, Holbrook NM (2003) Vulnerability of xylem vessels to cavitation
749 1775-1780.
750 Mrad A, Domec JC, Huang CW, Lens F, Katul G (2018) A network model links wood anatomy
751 to xylem tissue hydraulic behaviour and vulnerability to cavitation. Plant Cell Env
752 41:2718-2730.
753 Niez B, Dlouha J, Moulia B, Badel É (2019) Water-stressed or not, the mechanical acclimation
754 is a priority requirement for trees. Trees 33:279–291.
755 Pammenter NW, Van der Willigen C (1998) A mathematical and statistical analysis of the
756 curves illustrating vulnerability of xylem to cavitation. Tree Physiol 18:589–593.
757 Pereira L, Flores-Borges DNA, Bittencourt PRL, Mayer JLS, Kiyota E, Araújo P, Jansen S,
758 Freitas RO, Oliveira RS, Mazzafera P (2018) Infrared nanospectroscopy reveals the
759 chemical nature of pit membranes in water-conducting cells of the plant xylem. Plant
760 Physiol 177:1629–1638.
761 Plavcová L, Hacke UG (2012) Phenotypic and developmental plasticity of xylem in hybrid
762 poplar saplings subjected to experimental drought, nitrogen fertilization, and shading. J
763 Exp Bot 63:6481–6491.
764 Plavcová L, Hacke UG, Sperry JS (2011) Linking irradiance‐induced changes in pit membrane
765 ultrastructure with xylem vulnerability to cavitation. Plant Cell Env 34:501–513.
766 Plavcová L, Jansen S, Klepsch M, Hacke UG (2013) Nobody’s perfect: can irregularities in pit
767 structure influence vulnerability to cavitation? Front Plant Sci 4: 453.
768 Schenk HJ, Espino S, Romo DM, Nima N, Do AYT, Michaud JM, Papahadjopoulos-Sternberg
769 B, Yang J, Zuo YY, Steppe K, Jansen S (2017) Xylem surfactants introduce a new
770 element to the cohesion-tension theory. Plant Physiol 173:1177–1196.
771 Schenk, H. J., Espino, S., Rich-Cavazos, S. M., & Jansen, S. (2018). From the sap’s perspective:
772 the nature of vessel surfaces in angiosperm xylem. Am J Bot 105:174-187.
773 Schindelin J, Arganda-Carreras I, Frise E, Kaynig V, Longair M, Pietzsch T, Preibisch S,
774 Rueden C, Saalfeld S, Schmid B, Tinevez J-Y, White DJ, Hartenstein V, Eliceiri K,
775 Tomancak P, Cardona A (2012) Fiji: an open-source platform for biological-image
776 analysis. Nature Methods 9:676–682.
777 Schneider CA, Rasband WS, Eliceiri KW (2012) NIH Image to ImageJ: 25 years of image
778 analysis. Nature Methods 9:671–675.
779 Scholander PF, Bradstreet ED, Hemmingsen EA, Hammel HT (1965) Sap pressure in vascular
780 plants: Negative hydrostatic pressure can be measured in plants. Sci 148:339–346.
781 Scholz A, Klepsch M, Karimi Z, Jansen S (2013b) How to quantify conduits in wood? Front
782 Plant Sci 4:56.
783 Scholz A, Rabaey D, Stein A, Cochard H, Smets E, Jansen S (2013a) The evolution and function
784 of vessel and pit characters with respect to cavitation resistance across 10 Prunus