HAL Id: inserm-02272394
https://www.hal.inserm.fr/inserm-02272394
Submitted on 27 Aug 2019
HAL is a multi-disciplinary open access
archive for the deposit and dissemination of sci-entific research documents, whether they are pub-lished or not. The documents may come from teaching and research institutions in France or abroad, or from public or private research centers.
L’archive ouverte pluridisciplinaire HAL, est destinée au dépôt et à la diffusion de documents scientifiques de niveau recherche, publiés ou non, émanant des établissements d’enseignement et de recherche français ou étrangers, des laboratoires publics ou privés.
Distributed under a Creative Commons Attribution - NonCommercial| 4.0 International License
Monotherapy Versus Standard Combination
Antiretroviral Therapy in HIV‑1 Infected Patients with
Viral Suppression in France (ANRS 140 DREAM)
Osvaldo Garay, Marie Nishimwe, Marwân-Al-Qays Bousmah, Asmaa Janah,
Pierre-Marie Girard, Geneviève Chene, Laetitia Moinot, Luis Sagaon-Teyssier,
Jean-Luc Meynard, Bruno Spire, et al.
To cite this version:
Osvaldo Garay, Marie Nishimwe, Marwân-Al-Qays Bousmah, Asmaa Janah, Pierre-Marie Girard, et al.. Cost‑Effectiveness Analysis of Lopinavir/Ritonavir Monotherapy Versus Standard Combina-tion Antiretroviral Therapy in HIV‑1 Infected Patients with Viral Suppression in France (ANRS 140 DREAM). PharmacoEconomics - open / Pharmacoecon Open, [Cham, Switzerland] : Springer Inter-national Publishing AG, [2017]-, 2019, Epub ahead of print. �10.1007/s41669-019-0130-7�. �inserm-02272394�
Vol.:(0123456789)
https://doi.org/10.1007/s41669-019-0130-7
ORIGINAL RESEARCH ARTICLE
Cost‑Effectiveness Analysis of Lopinavir/Ritonavir Monotherapy
Versus Standard Combination Antiretroviral Therapy in HIV‑1 Infected
Patients with Viral Suppression in France (ANRS 140 DREAM)
Osvaldo Ulises Garay1 · Marie Libérée Nishimwe1 · Marwân‑al‑Qays Bousmah1,2 · Asmaa Janah1 ·
Pierre‑Marie Girard3 · Geneviève Chêne4,5 · Laetitia Moinot4 · Luis Sagaon‑Teyssier1,2 · Jean‑Luc Meynard3 ·
Bruno Spire1 · Sylvie Boyer1
© The Author(s) 2019
Abstract
Background Protease inhibitor monotherapy is a simplified treatment strategy for virally suppressed HIV-positive patients that has the potential for cost savings, as fewer drugs are used than with combination therapy. However, evidence for its economic value is limited.
Objectives We assessed the cost-effectiveness of lopinavir/ritonavir monotherapy followed by treatment intensification in case of viral load rebound versus combination antiretroviral therapy (cART) with efavirenz/emtricitabine/tenofovir in HIV-1 infected patients with viral suppression in the ANRS 140 DREAM trial.
Methods DREAM was conducted in 36 French Hospitals between 2009 and 2013. For each treatment strategy, we estimated the unadjusted and multivariate-adjusted mean costs (in €, year 2010 values) and quality-adjusted life-years (QALYs) per patient, as well as incremental costs and QALYs per patient. We then assessed uncertainty using the cost-effectiveness acceptability curve, scenario analyses and cost-effectiveness price-threshold (CEPT) analysis.
Results In the base-case analysis considering 2009–2013 antiretroviral drug (ARV) prices, adjusted incremental costs and QALYs were − €3296 (95% confidence interval [CI] − 5202 to − 1391) and 0.006 (95% CI − 0.021 to 0.033), respectively, over 2 years, suggesting that monotherapy was cost-effective with a probability of 100% at various cost-effectiveness thresh-olds. In scenario analyses considering 2018 ARV prices, monotherapy remained cost-effective but with a lower probability (94% vs. 100% in the base-case analysis). The current price of cART would have to decrease by 34% to be cost-effective with a probability of 95%.
Conclusion Monotherapy appears to be cost-effective compared with cART for virologically suppressed HIV-positive patients in France. CEPT analysis is a useful tool to identify the preferred strategy to adopt given that ARV prices change rapidly.
Trial registration Clinicaltrials.gov identifier: NCT00946595.
Osvaldo Ulises Garay and Marie Libérée Nishimwe contributed equally.
Electronic supplementary material The online version of this article (https ://doi.org/10.1007/s4166 9-019-0130-7) contains supplementary material, which is available to authorized users. * Sylvie Boyer
sylvie.boyer@inserm.fr
Key Points for Decision Makers
A monotherapy strategy using lopinavir/ritonavir, with prompt re-initiation of combination antiretroviral therapy (cART) in the event of viral load rebound, appears to be cost-effective when compared with cART using efa-virenz/emtricitabine/tenofovir in HIV-1-infected patients with viral suppression in France.
Monotherapy was estimated to save − €3296 (95% con-fidence interval [CI] − 5202 to − 1391) per patient over 2 years when considering antiretroviral drug prices over the study period (2009–2013) and − €1456 (95% CI – 3300 to 388) when considering antiretroviral drug prices in 2018, whereas health benefits were not signifi-cantly different between the two strategies in terms of quality-adjusted life-years.
The current monthly price of cART would have to decrease by 34% (from €573.3 to − 378.4) to become the preferred strategy with a probability of 95%.
As the cost-effectiveness of monotherapy versus cART is highly dependent on antiretroviral drug prices, it is essential to provide information for policy making on the economic value of this strategy for a large range of price combinations of both treatments using cost-effectiveness price-threshold analysis.
1 Introduction
The current standard of care for the treatment of people living with HIV (PLWHIV) is combination antiretroviral therapy (cART), which includes two nucleoside reverse transcriptase inhibitors (NRTIs) and a third drug (either a ritonavir-boosted protease inhibitor [PI/r], a non-nucle-oside reverse transcriptase inhibitor [NNRTI] or an inte-grase inhibitor) [1, 2]. Since the introduction of cART in the mid-1990s, the survival and quality of life of PLWHIV have increased substantially and HIV infection has become a chronic manageable infection [3]. As a consequence of the longer life expectancy and a greater number of PLWHIV benefiting from antiretroviral therapy (ART), public health-care expenditures dedicated to treating HIV infection have increased significantly over the past two decades [4, 5].
The yearly cost of HIV care per patient in France was estimated at €14,821 in 2010 in a systematic review [6]. This represents a global financial burden on the national healthcare system of more than €1.1 billion per year. Approximately 70% of this cost is related to antiretroviral drugs (ARVs). In addition, over the last 10 years, the average
yearly cost of HIV drugs has increased significantly because of the higher prices of new drugs with better tolerability and genetic barriers to resistance [7]. This trend is expected to continue because of national and international guidelines that recommend initiating ART irrespective of CD4 count [1, 2].
In this context, treatment strategies that optimise the use of ART with potential benefits in terms of lower toxicity for patients and cost savings for health systems are of particu-lar interest. To limit exposure to ARV and potential toxic-ity, several alternatives to cART-based standard care have been evaluated, including PI/r monotherapy [8, 9]. A recent meta-analysis showed that PI/r monotherapy had a higher risk of viral load (VL) elevation than cART but that VL suppression rates after treatment intensification using NRTIs were similar for both treatments, with no increased risk of treatment-emergent drug resistance [10].
The ANRS 140 DREAM trial was conducted in France to compare the effectiveness of PI/r monotherapy using lopi-navir/ritonavir (LPV/r) with fixed-dose cART comprising two NRTIs and one NNRTI (efavirenz/emtricitabine/teno-fovir [EFV/FTC/TDF]) in patients with HIV-1 who were virally suppressed [11]. LPV/r was chosen because of its good tolerance profile and high genetic barriers, and EFV/ FTC/TDF was chosen because the two NRTIs have favour-able tolerance profiles and are combined with EFV in a sin-gle pill [12–14]. Using the proportion of patients without treatment failure at week 96 as a primary endpoint (with failure defined as a VL ≥ 50 copies/mL, treatment discon-tinuation including re-intensification in the LPV/r arm, or a new AIDS-defining illness or death), the trial failed to demonstrated the non-inferiority of PI/r monotherapy (dif-ference between arms − 6.8%; 95% confidence interval [CI] − 19.9 to 6.2) [11]. When re-intensification in the LPV/r arm was not considered to represent failure, the proportions of participants without treatment failure were similar in the two arms (difference between arms − 0.7%; 95% CI − 13.5 to 12.0). Tolerability was good, with stable neurocognitive functions from week 0 to 96 in both arms and a similar pro-portion of patients with drug-related grade 3 or 4 clinical events in both arms (5% in each arm). In addition, emergent resistance was low in both arms, with no reduced opportu-nity to benefit from future PI-treatment options if needed, including darunavir-based options.
Although PI/r monotherapy also potentially reduces ARV costs [15, 16], the literature on its economic value is scarce. Two previous studies investigating the costs of PI/r monotherapy compared with those of cART in the UK found significant cost savings, estimated at €3382–4561 per year [15, 17]. However, only one previous study assessed the cost-effectiveness of PI/r monotherapy versus cART [16]. It was conducted using the UK’s PIVOT trial where HIV-positive adults with suppressed VL were randomised either
to cART or to PI/r-based monotherapy with prompt return to combination therapy upon VL rebound. The authors of that study concluded that PI/r monotherapy was an acceptable and cost-effective alternative for long-term management of HIV infection.
Despite being considered in national guidelines as a sim-plified treatment option under certain conditions [18], the economic value of PI/r monotherapy in the French context had not been previously investigated. The availability of the ANRS 140 DREAM trial data provided us the opportunity to do so. More specifically, this study aimed to evaluate the cost-effectiveness of LPV/r monotherapy with treatment intensification in case of VL rebound versus cART with EFV/FTC/TDF using individual data from the ANRS 140 DREAM trial. In addition, as the cost-effectiveness of mono-therapy is heavily dependent on the evolution of ARV prices, we used an original method—the cost-effectiveness price-threshold (CEPT) analysis—to provide additional informa-tion on the strategy that would have the best economic value for a large range of ARV price combinations.
2 Methods
2.1 Trial Design and Study Population
ANRS 140 DREAM was a multicentre, phase II/III, non-inferiority, randomised controlled trial conducted between November 2009 and July 2013 in 36 French hospitals. Its design and results are described in detail elsewhere [14]. Briefly, the trial enrolled 197 HIV-positive adults receiv-ing ART over the previous 6 months with an undetectable VL (< 50 copies/mL) for at least 12 months, and who had CD4 count > 200/mm3 and nadir > 100/mm3 at screening
without prior documented virological failure or mutation conferring resistance to ART. Participants were randomised (1:1) to receive either a co-formulation (one pill a day) of EFV/FTC/TDF (cART arm) or PI/r monotherapy using LPV (monotherapy arm) over a period of 98 weeks, with treatment intensification using FTC and TDF in case of VL failure (i.e. two successive VL ≥ 400 copies/mL within a 2-week interval). Clinical examinations and laboratory tests were performed at screening (week [W] − 4), baseline (W0), W4 and every 12 weeks until W98. The base-case analysis was conducted using a modified intention-to-treat analysis, which included 189 participants (95 in the monotherapy arm and 94 in the cART arm) who received at least one dose of the assigned treatment, and excluded two patients with major protocol violations. The median age of patients was 44 years (interquartile range [IQR] 38.9–52.9), 71.4% were male, and median follow-up duration was 1.89 years (IQR 1.88–1.92). Retention rates were high: only 9% withdrew during the trial or were lost to follow-up.
2.2 Outcomes Measures
Outcomes considered in the analysis included costs assessed from the perspective of the French National Health Insur-ance (NHI) and quality-adjusted life-years (QALYs), which is the preferred outcome measure in economic evaluation as it captures treatment effects on both life expectancy and health-related quality of life (HRQoL) [19]. The time hori-zon of the analysis was 2 years, corresponding to the trial duration. Costs and QALYs were discounted at an annual rate of 4%, as recommended by the French National Health Authority (HAS) [20].
Costs were measured for the complete study period, i.e. from enrolment to the last visit observed during that period. We considered the following cost items: inpatient care, ARV, concomitant drugs, laboratory tests, outpatient consultations (including non-routine visits, e.g. for acci-dent and emergency events) and work stoppage. Total costs were estimated for each strategy as the sum of all individual healthcare resources used by participants multiplied by the unit cost of these resources (except for the costs of work stoppage, assessed as number of days on sick leave multi-plied by the daily compensation paid by the French NHI). Data on healthcare resources consumed by participants over the study period (2009–2013) were obtained through stand-ardised case report forms. Respective unit costs for each resource over that period were obtained from routinely pub-lished national sources (Appendix 1 in the Electronic Sup-plementary Material): the French NHI database of drugs [21], the national reference costs for medical procedures [22], the national reference costs for biological and non-biological procedures [23], the French technical agency for information on hospitalisation and the National Institute of Statistics and Economics Studies. All costs were converted to €, year 2010 values, using the French consumer price index [24]. In the base-case analysis, the monthly prices of EFV/FTC/TDF and LPV/r were €742.83 and €476.54, respectively. For each resource category, we calculated the mean healthcare use, the mean related costs and the mean cost per patient for each strategy.
For each strategy, we also estimated total QALYs gained and QALYs gained per patient over the 2-year study period. Total QALYs gained per arm were calculated as the sum of QALYs gained by each participant, assessed as the time spent in a specific health state weighted by the utility score corresponding to that health state. Participants’ HRQoL was measured at baseline and over follow-up using the most recent version of the Medical Outcomes Study 12-item Short-Form survey (SF-12, second version) [25]. Partici-pants who completed this questionnaire were uniquely clas-sified according to the six-dimensional health state short form (SF-6D), which describes 18,000 health states. We used the set of preference weights associated with each
SF-6D health state developed by the University of Shef-field [26]. These preference weights (or utility scores) were obtained from a sample of the general population using the recognised standard gamble valuation technique and allowed us to obtain QALYs from the SF-12 for use in cost-utility analysis.
2.3 Analysis
The methods employed to conduct the economic analysis are consistent with those recommended by the HAS [20] and follow international standards for economic evaluation alongside randomised controlled trials [27, 28]. In particular, we decided to conduct a cost-effectiveness analysis, as, in the field of economic evaluation, our interest lies in assess-ing the joint distribution of costs and effects to estimate the incremental cost-effectiveness ratio (ICER) and in rep-resenting uncertainty surrounding that estimate [29]. This approach is also appropriate in situations where costs and/ or health benefits are not significantly different between the two strategies assessed.
We compared adjusted incremental mean costs and QALYs between the two strategies and their respective 95% CIs. Results were represented in the incremental cost-effectiveness plane (CEP). Accordingly, if the point estimate of incremental cost and effect fell in the south-east quad-rant, monotherapy would be considered dominant because it would be less costly and more effective than cART [29]. If it fell in the north-west quadrant, it would be considered dominated (as it would be more costly and less effective). In the north-east and south-west quadrants, a trade-off between costs and effects must be considered. In both situations, an ICER would be computed as the incremental mean cost divided by the incremental health benefit and compared with the value of λ, the latter corresponding to the max-imum amount the decision maker is willing to pay for 1 unit of health (i.e. the cost-effectiveness threshold). In the north-east quadrant (corresponding to both higher incremen-tal costs and health benefits), monotherapy is considered cost-effective when its ICER is lower than λ, while in the south-west quadrant (corresponding to both lower incremen-tal costs and health benefits), monotherapy is considered cost-effective when its ICER is higher than λ (in the latter case, the ICER indicates the savings gained per 1 unit loss of health and accordingly, strategies with higher ICERs are preferable to those with lower ICERs). As the French HAS does not recommend any specific cost-effectiveness thresh-old, we considered a threshold of one times the French per capita gross domestic product (GDP) in 2013 (i.e. €32,000), as recommended by the World Health Organisation [30]. We used the cost-effectiveness acceptability curve (CEAC) to vary λ from 0 to €200,000/QALY [31].
Generalised linear models were used to obtain an esti-mation of the costs and QALYs adjusted for the treatment effect. In addition, the models were adjusted for sex, age, CD4 count, HIV RNA level and utilities at baseline (age squared was also included in the estimation of QALYs).
For both cost and QALY estimations, we performed a modified Park test on the raw-scale residuals to select the appropriate variance structure [32].
Uncertainty in cost-effectiveness was addressed in a probabilistic sensitivity analysis (PSA), based on Monte Carlo simulations and considering the correlation between costs and outcomes variables. More specifically, we per-formed a Cholesky decomposition on the variance–covari-ance matrix extracted from the cost and QALY regres-sions. This enabled us to define a multivariate normal distribution that we used to estimate incremental costs and QALYs from 1000 simulations [33]. These simulated pairs of incremental costs and QALYs were represented in the CEP. Based on the simulations, we calculated the 95% CI for both incremental costs and QALYs as well as the probability of PI/r monotherapy being cost-effective at different thresholds. This probability is simply the pro-portion of the incremental cost-effect pairs that fall below the cost-effectiveness threshold represented in the CEP by the line with slope λ drawn through the origin [34]. The CEAC plots these probabilities on the y-axis versus λ on the x-axis.
Furthermore, we addressed other types of uncertainty by conducting four scenario analyses. The first two sce-narios were performed considering a discount rate of 0% and 6%, respectively. The third excluded the costs of work stoppage, and the fourth considered the most recent prices (year 2018) for EFV/FTC/TDF and LPV/r (i.e. €573.28 and €418.00 per month in constant year 2010 values, respectively) [21].
Finally, for a range of price combinations of EFV/ FTC/TDF and LPV/r, we calculated the price thresholds that made cART or monotherapy cost-effective (prob-ability of 95%). We also computed the price thresholds at which both strategies were equally cost-effective: P(MT:CE) = P(cART:CE) = 0.50, where MT is mono-therapy and CE is cost-effective. This CEPT analysis was performed iteratively and considered a cost-effectiveness threshold of 1 times the French per capita GDP in 2013 (€32,000/QALY).
All statistical analyses were conducted using Stata ver-sion 14.2 (StataCorp, College Station, TX, USA).
3 Results
3.1 Resource Use, Costs and Quality‑Adjusted Life‑Years
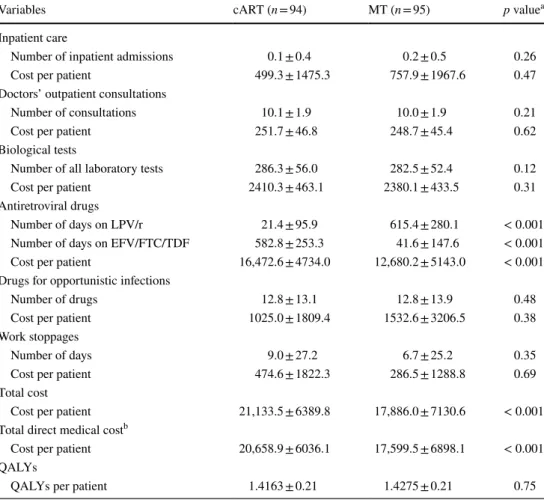
Table 1 describes healthcare use and corresponding unad-justed mean costs per patient accrued over the 2 years of follow-up. At W98, 63.2% of patients in the PI/r mono-therapy arm were still receiving monomono-therapy, and 9.5% needed treatment intensification and were switched to cART. Resource use was broadly similar across both arms, except for ARV. The mean total cost per patient was €21,133.5 ± standard deviation (SD) 6389.8 and €17,886.0 ± 7130.6, respectively, for the cART and mon-otherapy strategies, i.e. monmon-otherapy cost 18.2% less than cART. In both arms, ARV was the main cost item (77.9% [cART] and 70.9% [monotherapy] of the total costs). However, this cost item was significantly lower
in the monotherapy strategy (€12,680.2 ± 5143.0 vs. €16,472.6 ± 4734.0; p < 0.001). The second largest cost item was biological tests, which represented 11.4% and 13.3% of the total costs in the cART and monotherapy strategies, respectively. This cost item was similar in both strategies (€2410.3 ± 463.1 vs. €2380.1 ± 433.5; p = 0.31). Other cost items represented < 10% of the total costs in the two strategies and were broadly similar for both.
Unadjusted mean ± SD QALYs per patient were 1.4163 ± 0.21 in the cART group and 1.4275 ± 0.21 in the monotherapy group (i.e. a positive but non-significant differ-ence of 0.011 QALYs in favour of monotherapy; p = 0.75). 3.2 Base‑Case Cost‑Effectiveness
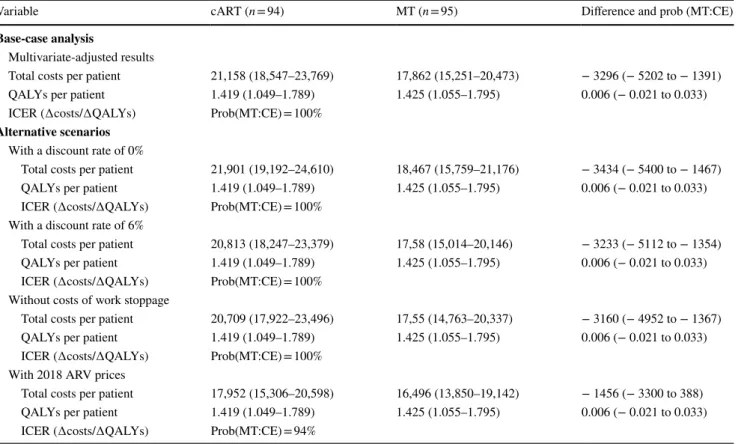
Cost-effectiveness results are presented in Table 2. In the case analysis where outcomes were adjusted for base-line individual covariates, the incremental total mean cost per patient in the monotherapy strategy (vs. cART) was
Table 1 Healthcare use, unadjusted costs (€, year 2010 values) and quality-adjusted life-years accrued over 2 years in the study population (ANRS 140 DREAM trial, n = 189)
Data are presented as mean ± standard deviation unless otherwise indicated
cART combination antiretroviral therapy, EFV/FTC/TDF efavirenz/emtricitabine/tenofovir, LPV/r lopina-vir/ritonavir, MT monotherapy, QALY quality-adjusted life-years
a Chi squared test for categorical variables; Wilcoxon rank-sum test for continuous variables b Total direct medical costs correspond to all costs excluding costs related to work stoppage
Variables cART (n = 94) MT (n = 95) p valuea
Inpatient care
Number of inpatient admissions 0.1 ± 0.4 0.2 ± 0.5 0.26
Cost per patient 499.3 ± 1475.3 757.9 ± 1967.6 0.47
Doctors’ outpatient consultations
Number of consultations 10.1 ± 1.9 10.0 ± 1.9 0.21
Cost per patient 251.7 ± 46.8 248.7 ± 45.4 0.62
Biological tests
Number of all laboratory tests 286.3 ± 56.0 282.5 ± 52.4 0.12
Cost per patient 2410.3 ± 463.1 2380.1 ± 433.5 0.31
Antiretroviral drugs
Number of days on LPV/r 21.4 ± 95.9 615.4 ± 280.1 < 0.001
Number of days on EFV/FTC/TDF 582.8 ± 253.3 41.6 ± 147.6 < 0.001
Cost per patient 16,472.6 ± 4734.0 12,680.2 ± 5143.0 < 0.001
Drugs for opportunistic infections
Number of drugs 12.8 ± 13.1 12.8 ± 13.9 0.48
Cost per patient 1025.0 ± 1809.4 1532.6 ± 3206.5 0.38
Work stoppages
Number of days 9.0 ± 27.2 6.7 ± 25.2 0.35
Cost per patient 474.6 ± 1822.3 286.5 ± 1288.8 0.69
Total cost
Cost per patient 21,133.5 ± 6389.8 17,886.0 ± 7130.6 < 0.001
Total direct medical costb
Cost per patient 20,658.9 ± 6036.1 17,599.5 ± 6898.1 < 0.001
QALYs
− €3296 (95% CI − 5202 to − 1391) over a 2-year period, while incremental QALYs per patient were 0.006 (95% CI − 0.021 to 0.033).
The 1000 joint estimations of costs and effects obtained in the PSA are represented in the CEP (Fig. 1a), with the cost-effectiveness thresholds of one and three times the 2013 French per capita GDP (i.e. €32,000/QALY and €96,000/ QALY). Incremental cost-effect pairs were all located in the south-east quadrant (i.e. less costly and more effective) and in the south-west quadrant (i.e. less costly and less effective). Figure 1a shows that all incremental cost-effect pairs were located on the cost-effective side of the cost-effectiveness threshold of 1 times the French per capita GDP (repre-sented by the red dashed line), corresponding to a 100% probability of monotherapy being cost-effective. When the cost-effectiveness threshold increased to 3 times the French per capita GDP, i.e. €96,000/QALY (represented by the red dashed-dotted line), a few of the incremental cost-effect pairs are located above the cost-effectiveness threshold, cor-responding to a 97.5% probability of monotherapy being
cost-effective. As illustrated by the CEAC, the probability of monotherapy being cost-effective was ≥ 95% for a large range of cost-effectiveness thresholds (€0–190,000/QALY) (Fig. 1b).
3.3 Results of the Analysis of Different Scenarios The analysis of different scenarios showed robust results, but, as expected, these were very sensitive to the cost of ARV. Decreasing (or increasing) the discount rate to 0% (6%) had little impact on incremental costs (range − €3434 to − 3233) and none on the incremental QALYs. Accord-ingly, the monotherapy strategy remained cost-effective: P(MT:CE) = 100%. When excluding the cost of work stop-page, cost savings obtained by monotherapy were slightly lower, yet the probability of monotherapy being cost-effec-tive remained 100%. When using 2018 ARV prices, incre-mental costs dropped to − €1456 (95% CI – 3300 to 388), resulting in a lower probability of monotherapy being cost-effective (94 vs. 100% in the base-case scenario).
Table 2 Multivariate-adjusted costs (€, year 2010 values) and quality-adjusted life-years for combination antiretroviral therapy and monotherapy (ANRS 140 DREAM trial, n = 189)
Data are presented as mean (95% confidence interval)
Covariates for the multivariate-adjusted models were sex, age, CD4 count, HIV RNA level and baseline utilities (‘age squared’ is also included in the QALY estimation)
∆ difference, ARV antiretroviral drug, cART combination antiretroviral therapy, CE cost-effective, GDP gross domestic product, ICER incremen-tal cost-effectiveness ratio, MT monotherapy, Prob (MT:CE) probability of MT being cost-effective at 1 times the French per capita GDP, QALY quality-adjusted life-year
Variable cART (n = 94) MT (n = 95) Difference and prob (MT:CE)
Base-case analysis
Multivariate-adjusted results
Total costs per patient 21,158 (18,547–23,769) 17,862 (15,251–20,473) − 3296 (− 5202 to − 1391)
QALYs per patient 1.419 (1.049–1.789) 1.425 (1.055–1.795) 0.006 (− 0.021 to 0.033)
ICER (∆costs/∆QALYs) Prob(MT:CE) = 100%
Alternative scenarios
With a discount rate of 0%
Total costs per patient 21,901 (19,192–24,610) 18,467 (15,759–21,176) − 3434 (− 5400 to − 1467)
QALYs per patient 1.419 (1.049–1.789) 1.425 (1.055–1.795) 0.006 (− 0.021 to 0.033)
ICER (∆costs/∆QALYs) Prob(MT:CE) = 100% With a discount rate of 6%
Total costs per patient 20,813 (18,247–23,379) 17,58 (15,014–20,146) − 3233 (− 5112 to − 1354)
QALYs per patient 1.419 (1.049–1.789) 1.425 (1.055–1.795) 0.006 (− 0.021 to 0.033)
ICER (∆costs/∆QALYs) Prob(MT:CE) = 100% Without costs of work stoppage
Total costs per patient 20,709 (17,922–23,496) 17,55 (14,763–20,337) − 3160 (− 4952 to − 1367)
QALYs per patient 1.419 (1.049–1.789) 1.425 (1.055–1.795) 0.006 (− 0.021 to 0.033)
ICER (∆costs/∆QALYs) Prob(MT:CE) = 100% With 2018 ARV prices
Total costs per patient 17,952 (15,306–20,598) 16,496 (13,850–19,142) − 1456 (− 3300 to 388)
QALYs per patient 1.419 (1.049–1.789) 1.425 (1.055–1.795) 0.006 (− 0.021 to 0.033)
3.4 Cost‑Effectiveness Price Thresholds
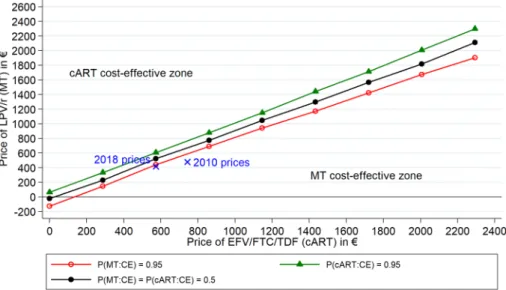
Figure 2 displays the results of the CEPT analysis, indi-cating, for any price combination of EFV/FTC/TDF and LPV/r, which strategy would be preferred based on its
probability of being cost-effective at a threshold of 1 times the French per capita GDP in 2013. The solid circle line represents the price combinations for which both strate-gies have the same probability of being cost-effective: P(MT:CE) = P(cART:CE) = 0.50. The probability of being
Fig. 1 a Scatter plot of estimated joint density of incremental costs
and incremental effects of MT versus cART obtained by Monte Carlo simulation in the ANRS 140 DREAM trial and b correspond-ing cost-effectiveness acceptability curve. The dashed line indicates the cost-effectiveness threshold of 1 times the French GDP/capita in 2013 (€32,000/QALY), whereas the dashed-dotted line indicates the cost-effectiveness threshold of 3 times the French GDP/capita in 2013 (€96,000/QALY). The light grey diamond represents the
base-case estimate in the cost-effectiveness plane: ∆cost = − €3296 and ∆QALYs = 0.006. The cost-effectiveness acceptability curve shows the probability that MT is cost-effective compared with cART over a range of values for the cost-effectiveness threshold (i.e. the maximum amount the decision maker is willing to pay for 1 unit of health). ∆ difference, cART combination antiretroviral therapy, GDP gross domestic product, MT monotherapy, QALY quality-adjusted life-years
Fig. 2 Cost-effective price thresholds for EFV/FTC/TDF and LPV/r that make combina-tion antiretroviral therapy and monotherapy cost-effective with a probability of 95% and 50%. cART combination antiretroviral therapy, GDP gross domes-tic product, LPV/r lopinavir/ ritonavir, MT monotherapy, Prob (cART:CE) probability of cART being cost-effective at 1 times the French per capita GDP, Prob (MT:CE) probability of MT being cost-effective at 1 times the French per capita GDP
cost-effective at 95% is represented by the price combina-tions of the solid triangle line for cART and of the hollow circle line for monotherapy. The area between these two latter lines corresponds to a zone of relative uncertainty, where—for all price combinations—the probability of being cost-effective is < 95% for both strategies.
The price combinations of EFV/FTC/TDF and LPV/r used in the base-case analysis (€742.83 and €476.54 per month, respectively) and in the scenario with year 2018 prices (€573.28 and €418.00 in year 2010 values, respectively) are also displayed in Fig. 2. Although the price combination of the base-case analysis is located in the area where the monotherapy strategy is dominant [Prob(MT:CE) = 1], we see that the 2018 price combina-tion is located slightly above the price thresholds that make monotherapy cost-effective with a 95% probability. Mono-therapy is nevertheless cost-effective at 94%. We also evalu-ated the prices of EFV/FTC/TDF that would make cART cost-effective at 50% and 95% while keeping the price of LPV/r at its 2018 level (€418.00 per month). A 17% price reduction in EFV/FTC/TDF costs (from €573.28 to 475.82) would make cART as cost-effective as the monotherapy: P(MT:CE) = P(cART:CE) = 0.50. For the cART to be cost-effective at 95%, its price would have to decrease by 34% (from €573.28 to 378.37).
4 Discussion
Our findings showed that, in the base-case analysis and in most scenarios, monotherapy was cost-effective compared with cART based on EFV/FTC/TDF with a probabil-ity ≥ 95% for a large range of cost-effectiveness thresholds (€0–190,000/QALY). For ARV prices observed during the study period (i.e. €742.83 for EFV/FTC/TDF and €476.54 for LPV/r), monotherapy was estimated to save − €3296 (95% CI − 5202 to − 1391) per patient over 2 years, and health benefits were not significantly different in terms of QALYs within the economic analysis. However, when considering an alternative scenario of ARV prices in 2018, the cost difference between the two strategies dropped to − €1456 (95% CI – 3300 to 388), resulting in a slightly lower probability of monotherapy being cost-effective (94% vs. 100% in the base-case scenario). Cost savings were driven by monotherapy-related lower costs, as fewer ARVs are used, while other cost items were quite similar in both arms. The probability of monotherapy being cost-effective is therefore heavily dependent on the evolution of ARV prices. Over the previous 5 years, while LPV/r prices have remained quite stable, the price of EFV/FTC/TDF has decreased by approximately 22% because the patent has expired and generic drugs have been developed. This situation explains
the lower cost savings for monotherapy when considering 2018 ARV prices.
Monotherapy provides quite similar health outcomes to cART in the short term, as VL rebound is followed by prompt return to cART. The clinical trial results also showed that the risk of developing resistance in the monotherapy group was no higher than that in the cART group, suggesting that monotherapy did not compromise long-term treatment effectiveness in patients with VL rebound [14]. Other clini-cal studies have also reported this finding, which is essential for future therapeutic success [8]. However, in a pooled-analysis of the data of three trials, including DREAM, the proportion of patients with ultrasensitive VL (USVL; < 1 copy/mL) or persistent residual viremia (RV) was signifi-cantly lower with PI/r monotherapy than with cART (65% vs. 74%; p = 0.04) [35]. Although the long-term conse-quences of RV are unknown, they may include virological rebound, the emergence of resistance mutations, and the per-sistence of immune activation and inflammation. In addition, baseline USVL was a predictive factor for virological failure in patients receiving PI/r monotherapy treatment, suggest-ing it could be a good virological marker to identify strong candidates for monotherapy.
While the focus of introducing new health tions is primarily to reap greater health benefits, interven-tions that are cost saving are relevant for policy making as their adoption may allow scarce resources to be released. Using a budget analysis on a French hospital-based cohort, Papot et al. [36] estimated that 9% of the 4238 HIV-positive patients receiving cART in the hospital’s HIV clinic would meet criteria for monotherapy and that switching those patients would reduce the overall cost of ART for the French NHI by 2.5% per year.
As the cost-effectiveness of monotherapy depends heavily upon ARV prices, our study also provides useful information for policy makers on the cost-effectiveness of monotherapy for a large range of ARV price combinations for both strat-egies. More specifically, we conducted a price-threshold analysis that identified, for all possible price combinations for both strategies, whether monotherapy or cART was pre-ferred (using a probability of 95%) or whether they were equivalent in terms of cost-effectiveness. For example, we showed that, if the current price of EFV/FTC/TDF decreased by 17% (from €573.28 to 475.82 per month, in year 2010 values), the cART strategy would be as cost-effective as the monotherapy strategy (considering that the price of LPV/r remained unchanged), and if the price of EFV/FTC/ TDF decreased by 34% (i.e. to €378.37 in year 2010 val-ues), the cART strategy would become cost-effective with a 95% probability. This analysis may also be applied to cART or monotherapy strategies other than those assessed in this study (i.e. EFV/FTC/TDF vs. LPV/r) but with simi-lar health benefits to inform policy on the best options to
implement, given changes observed in ARV prices, and/or to help national health agencies negotiate drug prices with pharmaceutical firms.
Our findings are consistent with those from what is, to our knowledge, the only other study to date examining the cost-effectiveness of monotherapy [16]. In that study, using data from the PIVOT trial conducted in the UK, the authors showed that PI/r monotherapy dominated cART, with sig-nificantly lower costs and similar health benefits. In their base-case analysis conducted over 3 years, monotherapy saved £6424.11 per patient (i.e. approximately €7300 per patient over 3 years compared with €3296 per patient over 2 years in our study) and provided 0.0051 (95% CI − 0.0479 to 0.0582) QALYs per patient over 3 years versus 0.006 (95% CI − 0.021 to 0.033) QALYs per patient over 2 years in our study.
Some limitations of the study should be recognised. First, the study period of 2 years is relatively short, so the cost-effectiveness of the monotherapy strategy may have been overestimated. Indeed, given that patients with VL rebound are switched to cART without loss of future PI/r options [11], the two strategies are expected to have similar long-term health benefits. However, as outlined previously, we cannot completely exclude the risk of lower long-term health benefits due to long-term consequences of residual viral replication [35]. On the other hand, as a consequence of switching to cART in case of VL rebound, cost savings related to the fewer ARVs used in monotherapy will be lower over the long term. Despite this shortcoming, Oddershede et al. [16] showed that, when considering a long-term tem-poral horizon where all patients in the monotherapy group are assumed to return to cART, the cost-effectiveness of monotherapy is likely to be preserved. A second limitation relates to HRQoL assessment in trial participants, which relied on the SF-12 instrument, even though the EuroQoL-Five Dimensions (EQ-5D) scale is the most widely used to derive QALYs in economic evaluations [29]. However, the SF-12 scale may be used as an alternative tool to compute QALYs, as any patient who completes this questionnaire can be uniquely classified according to the SF-6D. The latter instrument provides generic preference-based measures of health that have been adopted by agencies such as the UK National Institute for Health and Care Excellence [26]. In addition, the SF-12 has been shown to discriminate HRQoL very well between groups of HIV-infected patients stratified according to disease severity [37]. Third, our study was con-ducted in a trial setting, which may limit the generalisability of our results. However, relatively non-restrictive eligibility criteria were used to enrol trial participants from the popu-lation of HIV-positive patients receiving ART attending a large number of HIV clinics in France. Accordingly, they can be assumed to be representative of the country’s entire population of PLWHIV in care. This would suggest therefore
that the trial population likely reflects patients selected for monotherapy in real life. In addition, the impact of trial procedures on cost-effectiveness results is expected to be minor in our analysis for two main reasons. First, the trial’s defined procedures were based on national and international guidelines and therefore were close to those of routine care practice (especially in terms of clinical visits, identification of treatment failure, resistance and routine examinations). Second, ARVs were the main drivers of cost differences between the two arms. The final limitation is intrinsic to the study design, which was restricted to the assessment of an LPV/r-based monotherapy compared with cART based on EFV/FTC/TDF. Other ARVs and/or treatment strate-gies merit analysis, particularly highly potent drugs such as darunavir, which would be a good candidate for mono-therapy. A recent budget analysis conducted in the setting of a French HIV clinic showed that treatment-simplification strategies, including monotherapy and dual therapy as well as fixed-dose combinations such as rilpivirine/TDF/FTC, are the most attractive options in terms of cost, pill burden and toxicity, both in the short and the long term [36]. In addition, as shown in the economic evaluation conducted in parallel with the PIVOT trial, PI/r monotherapy based on drugs other than LPV/r provide similar health benefits and are also likely to be cost-effective because of large cost savings on ARV [16]. However, additional research is needed on more recent drugs to optimise the use of ART according to patient needs.
Although PI/r monotherapy is not widely recommended, it continues to be an alternative option for virologically suppressed HIV-infected subjects in France. Our economic study showed that monotherapy followed by treatment inten-sification in case of VL rebound could be a cost-effective option compared with cART in France. However, as long-term consequences of residual viral replication have not yet been determined, a case-by-case approach using USVL is required to identify strong candidates for a simplification strategy. Furthermore, given that ARV price evolution has important implications on the cost-effectiveness results, this study brings additional information on the strategy with the best economic value for a large range of ARV price combi-nations, thereby helping decision makers identify optimal treatment strategies and negotiate cost-effective ARV prices with pharmaceutical companies.
Data availability statement The datasets generated during and/or analysed during the current study are available from the corresponding author on reasonable request.
Acknowledgements The authors thank the ANRS 140 DREAM study participants and their partners, families and caregivers, as well as the staff of all the participating sites. Our thanks also to Jude Sweeney for the English revision and editing of the manuscript. Members of the ANRS 140 DREAM Trial Study Group: members of the Scientific
Committee (Isabelle Cohen-Codar, Sandrine Couffin-Cadiergues, Dr Jean-Marie Poirier, Dr Isabelle Poizot-Martin, Cécile Rabian, Anne-Marie Taburet and Pr Yazdan Yazdanpanah), the Data Safety Monitor-ing Board (Pr Eric Bellissant, Dr Isabelle Pellegrin, Jonas Le Bail and Pr Stéphane De Wit), the event review committee (Dr Olivier Patey, Pr Elisabeth Rouveix and Pr Yazdan Yazdanpanah), the IMEA (Karine Amat, Aïda Benalycherif, Roland Landman and Babacar Sylla), the INSERM U1219 (Valérie Boilet, Vincent Bouteloup, Françoise Cou-turier, Adélaïde Perrier, Dr Caroline Roussillon, Monique Termote, Patrick Mercié), the AP-HP (Sami Kolta, Laurence Morand-Joubert), the INSERM UMR1252 (Bruno Spire) and ANRS (Soizic Le Mestre and Fanny Cardon).
Author contributions GC and P-MG designed and implemented the
ANRS 140 DREAM trial. SB designed the health economic study. AJ, OUG and MLN performed the health economics analysis with the support and supervision of SB and LST. The manuscript was drafted by OUG, SB and MQB. All authors contributed to the interpretation and presentation of the findings, revised the article critically for important intellectual content, and approved the final version of the manuscript for submission.
Compliance with Ethical Standards
Funding This study was sponsored and funded by the French National Institute for Health and Medical Research–France Recherche Nord&Sud Sida-HIV Hepatites (Inserm-ANRS), Paris, France. ANRS 140 DREAM trial was conducted with the support of AbbVie, Bristol-Myers Squibb and Gilead Science.
Conflict of interest BS received fees from Merck Sharp and Dohme, Gilead and Jansen-Cilag for seminars and participation in scientific boards of observational studies. OUG, MLN, MQB, AJ, P-MG, GC, LM, LST, J-LM and SB have no conflicts of interest that are directly relevant to the content of this article.
Ethics approval The protocol was approved by the ethics committee “Comité de Protection des Personnes Ile de France V, Paris, France” and the French competent health authority (Agence nationale de sécu-rité du médicament et produits de santé).
Informed consent All study participants provided written informed consent. The trial was conducted in accordance with the Declaration of Helsinki.
Open Access This article is distributed under the terms of the
Crea-tive Commons Attribution-NonCommercial 4.0 International License (http://creativecommons.org/licenses/by-nc/4.0/), which permits any noncommercial use, distribution, and reproduction in any medium, provided you give appropriate credit to the original author(s) and the source, provide a link to the Creative Commons license, and indicate if changes were made.
References
1. CNS Conseil National du SIDA et des hépatites virales. Prise en charge médicale des personnes vivant avec le VIH—recom-mandations du groupe d’experts, Sous la Direction du Professeur Philippe Morlat et sous l’égide du CNS et de l’ANRS. Actualisa-tion 2018 du rapport 2013 (Internet). https ://cns.sante .fr/actua lites
/prise -en-charg e-du-vih-recom manda tions -du-group e-dexpe rts/. Accessed 28 May 2018.
2. Friedrich MJ. WHO updates HIV treatment and prevention guide-line. JAMA. 2015;314:2014.
3. Lewden C, Bouteloup V, De Wit S, Sabin C, Mocroft A, Wasmuth JC, et al. All-cause mortality in treated HIV-infected adults with CD4 ≥ 500/mm3 compared with the general population: evidence
from a large European observational cohort collaboration. Int J Epidemiol. 2012;41:433–45.
4. Krentz HB, Gill MJ. The impact of non-antiretroviral polyphar-macy on the continuity of antiretroviral therapy (ART) among HIV patients. AIDS Patient Care STDs. 2016;30:11–7. 5. Supervie V, Ekouevi D. Overview of the HIV epidemics in
France and worldwide. Rev Prat. 2014;64:1060–6.
6. Trapero-Bertran M, Oliva-Moreno J. Economic impact of HIV/ AIDS: a systematic review in five European countries. Health Econ Rev (Internet). 2014;4. http://dx.doi.org/10.1186/s1356 1-014-0015-5.
7. Sloan CE, Champenois K, Choisy P, Losina E, Walensky RP, Schackmanj B, et al. Newer drugs and earlier treatment: impact on lifetime cost of care for HIV-infected adults. AIDS Lond Engl. 2012;26:45.
8. Paton NI, Stöhr W, Arenas-Pinto A, Fisher M, Williams I, John-son M, et al. Protease inhibitor monotherapy for long-term man-agement of HIV infection: a randomised, controlled, open-label, non-inferiority trial. Lancet HIV. 2015;2:e417–26.
9. Meynard J-L, Bouteloup V, Landman R, Bonnard P, Baillat V, Cabie A, et al. Lopinavir/ritonavir monotherapy versus cur-rent treatment continuation for maintenance therapy of HIV-1 infection: the KALESOLO trial. J Antimicrob Chemother. 2010;65:2436–44.
10. Arribas J, Girard P-M, Paton N, Winston A, Marcelin A-G, Elbirt D, et al. Efficacy of protease inhibitor monotherapy vs. triple therapy: meta-analysis of data from 2303 patients in 13 randomised trials. HIV Med. 2015;17:358–67.
11. Meynard J-L, Moinot L, Landman R, Morand-Joubert L, Besseghir A, Kolta S, et al. Week 96 efficacy of lopinavir/rito-navir monotherapy in virologically suppressed patients with HIV: a randomised non-inferiority trial (ANRS 140 DREAM). J Antimicrob Chemother. 2018;73:1672–6.
12. Hermes A, Squires K, Fredrick L, Martinez M, Pasley M, Trinh R, et al. Meta-analysis of the safety, tolerability, and efficacy of lopinavir/ritonavir-containing antiretroviral therapy in HIV-1-infected women. HIV Clin Trials. 2012;13:308–23.
13. Cahn P, Montaner J, Junod P, Patterson P, Krolewiecki A, Andrade-Villanueva J, et al. Pilot, randomized study assessing safety, tolerability and efficacy of simplified LPV/r maintenance therapy in HIV patients on the 1st PI-based regimen. PLoS ONE (Internet). 2011;6:e23726.
14. Gathe J, da Silva BA, Cohen DE, Loutfy MR, Podzamczer D, Rubio R, et al. A once-daily lopinavir/ritonavir-based regi-men is noninferior to twice-daily dosing and results in similar safety and tolerability in antiretroviral-naive subjects through 48 weeks. J Acquir Immune Defic Syndr. 1999;2009(50):474–81. 15. Restelli U, Croce D, Porazzi E, Scolari F, Bonfanti M, Galli M,
et al. Health technology assessment in the HIV setting: the case of monotherapy. New Microbiol. 2014;37:247–61.
16. Oddershede L, Walker S, Stöhr W, Dunn DT, Arenas-Pinto A, Paton NI, et al. Cost effectiveness of protease inhibitor mono-therapy versus standard triple mono-therapy in the long-term manage-ment of HIV patients: analysis using evidence from the PIVOT trial. PharmacoEconomics. 2016;34:795–804.
17. Gazzard B, Hill A, Anceau A. Cost-efficacy analysis of the MONET trial using UK antiretroviral drug prices. Appl Health Econ Health Policy. 2011;9:217–23.
18. CNS Conseil National du SIDA et des hépatites virales. Prise en charge médicale des personnes vivant avec le VIH—recom-mandations du groupe d’experts, Sous la Direction du Profes-seur Philippe Morlat et sous l’égide du CNS et de l’ANRS. Optimisation d’un traitement antirétroviral en situation de suc-cès virologique (Internet). 2017. https ://cns.sante .fr/wp-conte nt/uploa ds/2017/01/exper ts-vih_optim isati on.pdf.
19. Drummond MF, Sculpher MJ, Claxton K, Stoddart GL, Torrance GW. Methods for the economic evaluation of health care pro-grammes. Oxford: Oxford University Press; 2015.
20. Haute Autorité de Santé (HAS). A methodological guide: choices in methods for economic evaluation (Internet). 2012. https ://www. has-sante .fr/porta il/uploa d/docs/appli catio n/pdf/2012-10/choic es_in_metho ds_for_econo mic_evalu ation .pdf.
21. Ministère des Affaires sociales et de la Santé. Base de données publique des médicaments. http://base-donne es-publi que.medic ament s.gouv.fr/.
22. Sécurité Sociale l’Assurance Maladie. Statistiques et publications (Internet). 2015. http://www.ameli .fr/l-assur ance-malad ie/stati stiqu es-et-publi catio ns/index .php.
23. Caisse nationale de l’assurance maladie. Document de travail “ Biologie médicale nomenclature des actes”, 2014 (Internet).
http://www.codag e.ext.cnamt s.fr/codif /nabm/.
24. International Monetary Fund: World Economic Outlook Database. 2016. https ://www.imf.org/exter nal/pubs/ft/weo/2016/01/weoda ta/ index .aspx.
25. Ware J, Kosinski M, Turner-Bowker D, Sundaram M, Gandek B, Maruish M. User’s manual for the SF-12v2 health survey. 2nd ed. New York: U S Qual Inc; 2009.
26. The University of Sheffield. Measuring and valuing health (Inter-net). https ://www.sheffi eld.ac.uk/schar r/secti ons/heds/mvh/index .
27. Petrou S, Gray A. Economic evaluation alongside randomised controlled trials: design, conduct, analysis, and reporting. BMJ. 2011;342:d1548.
28. Glick HA, Doshi JA, Sonnad SS, Polsky D. Economic evaluation in clinical trials. 2nd ed. Oxford: Oxford University Press; 2014. 29. Gray AM, Clarke PM, Wolstenholme JL, Wordsworth S. Applied
methods of cost-effectiveness analysis in healthcare. Oxford: Oxford University Press; 2011.
30. Sachs JD. Macroeconomics and health: investing in health for eco-nomic development. Rev Panam Salud Pública. 2002;12:143–4. 31. Lothgren M, Zethraeus N. Definition, interpretation and
calcu-lation of cost-effectiveness acceptability curves. Health Econ. 2000;9:623–30.
32. Manning WG, Mullahy J. Estimating log models: to transform or not to transform? J Health Econ. 2001;20:461–94.
33. Briggs A, Sculpher M, Claxton K. Decision modelling for health economic evaluation. Oxford: OUP; 2006.
34. Fenwick E, Marshall DA, Levy AR, Nichol G. Using and inter-preting cost-effectiveness acceptability curves: an example using data from a trial of management strategies for atrial fibrillation. BMC Health Serv Res. 2006;6:52.
35. Lambert-Niclot S, Grude M, Meynard J-L, Marcelin A-G, Valan-tin M-A, Flandre P, et al. Ultrasensitive human immunodeficiency virus type 1 viral load as a marker of treatment choice for simpli-fication strategies. Clin Infect Dis. 2018;67:1883–9.
36. Papot E, Landman R, Louni F, Charpentier C, Peytavin G, Certain A, et al. Budget impact of antiretroviral therapy in a French clinic cohort. AIDS. 2017;31:1271–9.
37. Delate T, Coons SJ. The discriminative ability of the 12-Item short form health survey (SF-12) in a sample of persons infected with HIV. Clin Ther. 2000;22:1112–20.
Affiliations
Osvaldo Ulises Garay1 · Marie Libérée Nishimwe1 · Marwân‑al‑Qays Bousmah1,2 · Asmaa Janah1 ·
Pierre‑Marie Girard3 · Geneviève Chêne4,5 · Laetitia Moinot4 · Luis Sagaon‑Teyssier1,2 · Jean‑Luc Meynard3 ·
Bruno Spire1 · Sylvie Boyer1
1 INSERM, IRD, SESSTIM, Sciences Economiques &
Sociales de La Santé & Traitement de l’Information Médicale, Aix Marseille University, Marseille, France
2 ORS PACA, Observatoire Régional de la Santé
Provence-Alpes-Côte d’Azur, Marseille, France
3 AP-HP, Hôpital Saint-Antoine, Paris, France
4 INSERM Bordeaux Population Health Research Center,
UMR 1219, CIC1401-EC, University of Bordeaux, ISPED, 33000 Bordeaux, France
5 CHU Bordeaux, Division of Public Health, 33000 Bordeaux,