HAL Id: cea-01323552
https://hal-cea.archives-ouvertes.fr/cea-01323552
Submitted on 30 May 2016
HAL is a multi-disciplinary open access
archive for the deposit and dissemination of
sci-entific research documents, whether they are
pub-lished or not. The documents may come from
teaching and research institutions in France or
abroad, or from public or private research centers.
L’archive ouverte pluridisciplinaire HAL, est
destinée au dépôt et à la diffusion de documents
scientifiques de niveau recherche, publiés ou non,
émanant des établissements d’enseignement et de
recherche français ou étrangers, des laboratoires
publics ou privés.
Hydrodynamic predictions for 5.02 TeV Pb-Pb collisions
Jacquelyn Noronha-Hostler, Matthew Luzum, Jean-Yves Ollitrault
To cite this version:
Jacquelyn Noronha-Hostler, Matthew Luzum, Jean-Yves Ollitrault. Hydrodynamic predictions for
5.02 TeV Pb-Pb collisions. Physical Review C, American Physical Society, 2016, 93 (03), pp.4912.
�10.1103/PhysRevC.93.034912�. �cea-01323552�
arXiv:1511.06289v2 [nucl-th] 9 Mar 2016
Jacquelyn Noronha-Hostler,1 Matthew Luzum,2, 3 and Jean-Yves Ollitrault4
1
Department of Physics, Columbia University, New York, 10027, USA
2
Instituto de F´ısica, Universidade de S˜ao Paulo, C.P. 66318, 05315-970 S˜ao Paulo, SP, Brazil
3
Departamento de F´ısica de Part´ıculas and IGFAE,
Universidade de Santiago de Compostela, E-15706 Santiago de Compostela, Galicia-Spain
4
Institut de physique th´eorique, Universit´e Paris Saclay, CNRS, CEA, F-91191 Gif-sur-Yvette, France We make predictions for momentum-integrated elliptic and triangular flow as well as mean trans-verse momentum for 5.02 TeV Pb-Pb collisions, as planned at the Large Hadron Collider. We use hydrodynamic calculations to predict the change of these observables as the center-of-mass collision energy evolves from 2.76 TeV to 5.02 TeV per nucleon pair. By using previously measured values as a baseline, we are able to make a robust prediction without relying on a particular model for initial conditions and without precise knowledge of medium properties such as viscosity. Thus, though the predicted changes are small, they can provide a significant test of the current hydrodynamic picture of heavy-ion collisions.
PACS numbers: 25.75.Ld, 24.10.Nz
I. INTRODUCTION
The heavy ion program of Run 2 of the Large Hadron Collider (LHC) is scheduled to commence in late 2015 with collisions of lead ions at an energy of 5.02 TeV per nucleon pair. This follows lower energy collisions of 2.76 TeV in Run 1, as well as collisions of various ions at the Relativistic Heavy-Ion collider up to 200 GeV per nu-cleon pair. During this time, a consensus picture has emerged of the collision system evolving according to the equations of relativistic viscous fluid dynamics [1]. Many hydrodynamic calculations have been performed, showing remarkable agreement with a wide variety of ob-servables [2–6], including a number of predictions [7–13] made before the measurements were performed [14–20]. The new heavy-ion run presents an opportunity to fur-ther test this picture in a new energy regime.
Despite this success of hydrodynamic models, there re-mains significant uncertainties. In particular, the initial, non-equilibrium stages of the collision are not well un-derstood, and similarly for temperature-dependent trans-port coefficients. Generically, a minimum in η/s(T ) is expected near the cross-over temperature [21, 22] both from the hadron gas phase [23, 24] and the QGP phase [25–30], but the exact location, magnitude, and slope of that minimum is unknown. Multiple models for ini-tial conditions [31, 32] and multiple parameterizations of shear viscosity [5, 33], for example, are able to give a good description of data.
In addition to uncertainties in the theory, there are systematic uncertainties in the measurements. Even if a calculation fits all the data within the experimental error bars, which is rarely the case, one clearly cannot trust any particular calculation to be correct with a precision better than these error bars. Due to these various uncer-tainties, there is a limit to the precision with which one can trust a prediction for a new collision system, made using a particular model of initial conditions and a single choice for medium properties and freeze-out prescription.
However, we argue that one can actually make precise and reliable predictions without assuming a particular model for initial conditions or values for medium prop-erties. Instead of choosing a particular model (with pa-rameters chosen to give a reasonable fit to existing data) and doing a single calculation of the new collision system, the idea is to directly use previously measured values as a baseline and focus on the change in observables of a Pb-Pb collision system as the energy is increased from 2.76 TeV to 5.02 TeV per nucleon pair.
By doing this, the uncertainties are significantly re-duced — not only theoretical uncertainties, but also ex-perimental systematic uncertainties, which will partially cancel for pairs of measurements done at the two collision energies using the same detector and with the same anal-ysis. As a result, we can do multiple calculations with many initial conditions and model parameters, to obtain a prediction that is more precise and robust.
In the same vein, to make a prediction that is as reli-able as possible, we focus on bulk, momentum-integrated observables for unidentified charged hadrons, which have significantly smaller uncertainties than more differential observables or more rare particles. Specifically, we focus on mean transverse momentum hpti along with integrated elliptic flow v2{2} and triangular flow v3{2}.
II. CALCULATIONS AND RESULTS
We aim to have a prediction that is as model-independent as possible. One input that is needed is the charged hadron multiplicity at the increased collision energy. In the following, we use the parameterization of the scaling of multiplicity [34, 35] with collision energy dN/dη ∼ s0.155, where the exponent uses the recent mea-surement at 5.02 TeV [36].
In hydrodynamic calculations, the momentum inte-grated v2 and v3 can be accurately predicted in any given collision event by measures of the initial spatial
2
anisotropy known as eccentricity ε2and triangularity ε3, respectively. That is,
vn= κnεn (1) with
εn =|R d
2r rneinφρ(~r)|
R d2r rnρ(~r) . (2) Here ρ(~r) is usually taken to be either energy density or entropy density, with each having roughly equivalent predictive power [37]. In this work we calculate both and verify that the result has a negligible difference.
κn= vn/εn represents the hydrodynamic response. It depends on aspects such as medium properties and the freeze-out prescription, but is considered to be indepen-dent of the initial conditions and is therefore the same in every event (within a given centrality class). Therefore, the change in elliptic and triangular flow can be sepa-rately studied as a change in the initial εn, compounded by a change in the hydrodynamic response vn/εn.
We address the former by gathering a set of models for initial conditions and calculating the change in ε2 and ε3. Since vn{2} ∼ phv2
ni, we are interested in the change in the root mean square. Here we investigate the following models — MC-Glauber [38–40], MC-KLN [41], MCrcBK [42], and Trento [43].
Each of these models uses the measured nucleon-nucleon inelastic cross section σinelas input. This quan-tity is not measured directly at 2.76 or 5.02 TeV. At 2.76 TeV, we use the standard value [35, 44] σinel = 64 mb. For the extrapolation to 5.02 TeV, we use the pa-rameterization of the total pp cross section by the Particle Data Group Collaboration [45] and the parameterization of the ratio of elastic to total cross section from Ref. [46]
and choose σinel= 70 mb.
For the Glauber model, we use the PHOBOS Monte Carlo Glauber [39] v1.0 to calculate eccentricities. We use the binary collision fraction from [44]. The only change with collision energy is the inelastic cross section, as described above.
Trento [43] is a phenomenological model with parame-ters that allow one to smoothly interpolate between var-ious types of initial conditions. For example, one limit corresponds to a Glauber model with participant scal-ing. Here, we choose the set of parameters that best reproduce multiplicity distributions in Pb+Pb, p+Pb, and p+p collisions at the LHC, and which approximately correspond to eccentricities from the IP-Glasma model: p = 0, k = 1.4 [43].
1
This parameterization gives σinel = 63.4, 69.2 and 72.5 mb at
√s
= 2.76, 5.02 and 7 TeV, respectively. The latter value is in agreement with the measurement 72.9 ± 1.5 mb by the TOTEM collaboration [47]. We round up 63.4 and 69.2 to 64 and 70, respectively. -2 -1 0 1 2 % change in ε2 (a) rcBK Trento KLN Glauber -4 -3 -2 -1 0 1 2 0 10 20 30 40 50 60 70 80 % change in ε3 centrality percentile (b)
FIG. 1. Percent change in rms eccentricity ε2 (a) and
tri-angularity ε3 (b) when the collision energy is increased from
2.76 TeV to 5.02 TeV, for several models of initial conditions for heavy-ion collisions — Glauber [39], Trento [43], MC-KLN [41], and MCrcBK [42].
MC-KLN [41] is a model based on saturation physics that calculates gluon production using the kt factoriza-tion formula and an ansatz for the unintegrated gluon distribution. We calculate using default parameters from the latest version mckln-3.52.
Lastly, we use the MCrcBK model [48], calculated with default parameters from mckt-v1.32. It is similar to MC-KLN in that it uses the kt factorization formula as a starting point. However, instead of the KLN ansatz for the unintegrated gluon distributions, they are calculated from the running coupling BK equation.
The results from all models are shown in Figure 1. Over all centralities and every model, the change from 2.76 TeV to 5.02 TeV is between -2% and 2% for rms ε2 and between -3% and 1% for ε3.
To investigate the change in the hydrodynamic re-sponse, we perform viscous hydrodynamic calculations using the 2+1 relativistic viscous hydrodynamical code, v-USPhydro [49, 50]. v-USPhydro uses Smoothed Par-ticle Hydrodynamics, a Lagrangian method to solve the equations of motion on an event-by-event basis, where the smoothing parameter is set to λ = 0.3 fm for all calculations [51].
We start by generating events from a Monte Carlo Glauber model, with a scale factor chosen for each set of parameters to match the charged hadron multiplicity
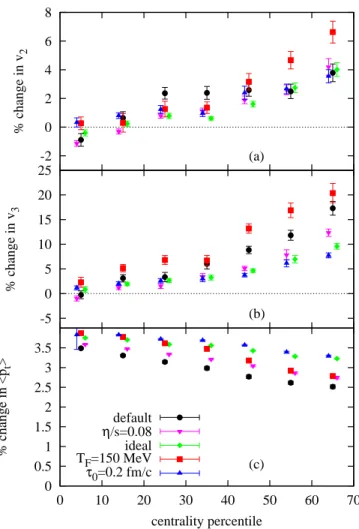
-2 0 2 4 6 8 % change in v 2 (a) -5 0 5 10 15 20 25 % change in v 3 (b) 0 0.5 1 1.5 2 2.5 3 3.5 0 10 20 30 40 50 60 70 % change in <p t > centrality percentile (c) default η/s=0.08 ideal TF=150 MeV τ0=0.2 fm/c
FIG. 2. Percent change in the hydrodynamic response v2/ε2
(a) and v3/ε3 (b), as well as mean transverse momentum hpti
(c) when the collision energy is increased from 2.76 TeV to 5.02 TeV, for several sets of hydrodynamic parameters. Error bars represent statistical uncertainty from the finite number of generated events. See text for details.
at 2.76 TeV. Then we scale each initial condition by a constant factor to calculate the hydrodynamic response at 5.02 TeV. In this way, the geometry of each event is fixed, and we can isolate the change in the hydrodynamic response vn/εn and in hpti. The actual eccentricity dis-tribution of the Glauber model used, is therefore irrel-evant. We use the lattice-based equation of state EOS S95n-v1 from [52], and calculate the change of observ-ables using all charged hadrons including all resonance decays [53, 54]. The following pt-integrated results cor-respond to the range pt > 0.2 GeV, but predictions for other relevant ranges are presented in A.
We choose for a default set of parameters τ0 = 0.6 fm/c, TF O= 130 MeV, and a temperature-dependent sheer viscosity η/s(T ) as labelled ‘param1’ in [33] (con-verted to a chemical equilibrium Equation of State as in Fig. 23 from that reference). The change in v2{2}, v3{2}, and hpti for Run 2 relative to Run 1 are shown in Fig. 2. In general, the predicted changes are at the
sev-eral percent level, with the mean transverse momentum increasing by approximately 3% across all centralities. Recall that a non-trivial prediction from hydrodynamics is that hpti depends little on centrality [55], and so it is unsurprising that the change also depends little on cen-trality. The mean transverse momentum is driven by by the equation of state both in ideal [56] and viscous [55] hydrodynamics. More precisely, it scales like the energy per particle at the time when transverse flow builds up. The multiplicity near midrapidity Nchis proportional to the entropy, therefore hpti scales like ǫ/s, where ǫ and s denote the energy and entropy density respectively [57]. Hence the relative increase of hpti is
dhpti hpti = dǫ ǫ − ds s = P ǫ dNch Nch , (3) where P is the pressure, and we have used the thermody-namic relations dǫ = T ds, ǫ + P = T s, ds/s = dNch/Nch. The temperature when transverse flow builds up at the LHC is in the range 200 − 250 MeV [58]. In this tempera-ture range, P ≃ ǫ/6 [52], and Eq. (3) explains why a 20% increase in multiplicity corresponds to a 3% increase in hpti. Our prediction, if confirmed by experimental data, thus provides a direct experimental verification of the QCD equation of state.
While the predicted increase in hpti depends little on centrality, elliptic and triangular flow have the largest increase in peripheral collisions. This is also expected generically. Note that anisotropic flow is generated as a response to a spatial anisotropy. In a given collision event, this spatial anisotropy decreases with time, and the generation of anisotropic flow therefore slows. Pe-ripheral events, with the shortest lifetime, are still rapidly generating vn when they freeze out, and therefore gen-erate significantly more when the lifetime is increased. On the other hand, central collisions already have a long lifetime at 2.76 TeV, and have therefore essentially satu-rated the anisotropic flow. In fact, the spatial anisotropy can eventually go through zero and change sign, result-ing in a slight decrease in vn with extra lifetime. From Fig. 2, one can see that this is indeed our prediction for v2in the most central collisions.
While this set of hydrodynamic parameters can give a reasonable fit to existing data given a judicious choice of initial conditions, there is uncertainty in their values. Because of this, we vary each parameter, in order to get an idea of the robustness of our prediction. In each case, we rescale the initial conditions in order to keep the final multiplicity fixed.
Fig. 2 shows the result when we separately change the shear viscosity from our fairly strong default tempera-ture dependence, to constant values of η/s = 0.08 [59] and η/s = 0. The latter choice is motivated by the ob-servation that there is no lower bound on η/s from exper-imental data alone [4]. In addition, we vary the freeze-out temperature to TF O = 150 which was found to be the highest value able to fit ptspectra at the LHC [60]. We vary the initial time to τ0 = 0.2 fm/c to mimic the
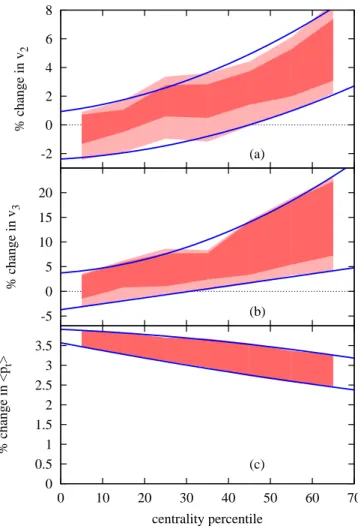
4 -2 0 2 4 6 8 % change in v 2 (a) -5 0 5 10 15 20 % change in v 3 (b) 0 0.5 1 1.5 2 2.5 3 3.5 0 10 20 30 40 50 60 70 % change in <p t > centrality percentile (c)
FIG. 3. Predicted percent change in v2{2} (a), v3{2} (b), and
hpti (c) when the collision energy is increased from 2.76 TeV
to 5.02 TeV. The dark band indicates the predicted change only from the hydrodynamic response, which is the dominant contribution to the error band, while the light band in the upper two plots includes the effect from a change in initial eccentricity. The solid lines represent a polynomial fit to the limits of the error band, which can be used to interpolate our prediction to any particular centrality.
effect of initial transverse flow [61–63].
Note that, while these parameters can have a very sig-nificant affect on the absolute values of v2{2}, v3{2}, and hpti, the affect of changing the parameters tends to be similar at each collision energy, and therefore there is a much smaller affect on the difference. In fact, it’s pos-sible that not all of these parameter sets would be able to fit data even at 2.76 TeV, but these results should give a conservative idea of the size of uncertainty in our prediction.
We can see that the uncertainty in our prediction for hpti is largely due to the uncertainty in η/s, while for v2 and v3it is more sensitive to freeze out. The uncertainty in the change in initial eccentricity appears to be much smaller than in the hydro response.
In Fig. 3 we combine the changes in initial spatial
anisotropy and the hydrodynamic response, using the range of results as an estimate of systematic uncertainty, to show our overall predictions for the change in each measured quantity.
We note that we have not investigated the effect of bulk viscosity, which could potentially increase our error band. However, since bulk viscosity is expected to de-crease quickly at high temperature, we expect that its effect should decrease with collision energy.
In a recent preprint [64], predictions were given using the EKRT model of initial conditions and several choices of η/s(T ). For the parameterizations of η/s(T ) that work best across various energies, they fall within our band of theoretical uncertainties. However, the two parameter-izations that fail to fit RHIC data and correlations of event-plane angles [33] would predict a larger anisotropic flow in central collisions than our result.
Finally, we take the results from existing measure-ments, and scale up by our predicted change, to give an absolute prediction for the values of v2{2} and v3{2} for various analyses from ALICE, CMS, and ATLAS. The results are shown in A.
III. CONCLUSIONS
We have presented predictions for the upcoming heavy-ion run at the LHC. By using previous measurements at lower energy as a baseline, we are able to make precise predictions for the evolution of observables as the colli-sion energy is increased from 2.76 TeV to 5.02 TeV, and which can be tested with significant precision by per-forming the same experimental analyses at both collision energies, resulting in a reduced systematic uncertainty on the change with energy.
Further, we make our predictions as model-independent as possible by focussing on specific observ-ables and doing numerous calculations for various models and parameters to make a robust prediction. Specifi-cally, we choose hpti because it is insensitive to model details, and momentum-integrated v2{2} and v3{2}, be-cause they have much smaller uncertainty than differen-tial measurements, and because these particular harmon-ics allow for a linear response analysis.
Compared to the lower energy LHC measurement, we predict that hpti will increase between 2.5%-3.5% with the largest increase in central collisions, but little cen-trality dependence overall. v2{2} and v3{2} will see the largest increases in peripheral collisions, of at least sev-eral percent, while in central collisions v3{2} and v2{2} will see little change.
These predictions provide an opportunity to precisely test the hydrodynamic paradigm of heavy-ion collisions. Any deviation of measurements from these predictions would highlight possible gaps in our current understand-ing, while the exact measured value within the predicted range could determine features such as the tempera-ture dependence of viscosity, bulk viscous effects, and
ALICE (pt≥ 0.2 GeV) Cent. v2{2} v3{2} 0–5% 0.0264 – 0.0273 0.0198 – 0.0213 5–10% 0.0433 – 0.0448 0.0230 – 0.0247 10–20% 0.0627 – 0.0651 0.0259 – 0.0279 20–30% 0.0819 – 0.0852 0.0291 – 0.0316 30–40% 0.0939 – 0.0982 0.0307 – 0.0339 40–50% 0.0993 – 0.1043 0.0306 – 0.0346 50–60% 0.0972 – 0.1027 60–70% 0.0889 – 0.0944 70–80% 0.0729 – 0.0780
TABLE I. Prediction for integrated v2{2} and v3{2},
inte-grated over pt≥ 0.2 GeV, using the measurements in [15] as
a baseline.
hadronic physics at freeze out.
ACKNOWLEDGMENTS
We thank the Institute for Nuclear Theory at the Uni-versity of Washington for its hospitality and the Depart-ment of Energy for partial support during the initiation of this work. ML was supported by Marie Curie Intra-European Fellowship for Career Development grant FP7-PEOPLE-2013-IEF-626212. JNH acknowledges support from the US-DOE Nuclear Science Grant No. DE-FG02-93ER40764. JYO thanks the departamento de f´ısica of Universidad de Buenos Aires for hospitality.
Appendix A: Prediction Tables
We present tables of predictions corresponding to the transverse momentum range of measurements at 2.76 TeV from ALICE (Table I), CMS (Table II) and ATLAS (Table III), obtained by taking our prediction for the fractional change in each observable from 2.76 to 5.02 TeV and multiplying by the respective measured value from LHC Run 1. The ptranges and corresponding mea-surements are pt≥ 0.2 GeV for ALICE [15], pt≥ 0.3 for CMS [65] and pt≥ 0.5 for ATLAS [66].
[1] U. Heinz and R. Snellings, Ann. Rev. Nucl. Part. Sci. 63, 123 (2013)
[2] W. Broniowski, M. Chojnacki, W. Florkowski and A. Kisiel, Phys. Rev. Lett. 101, 022301 (2008)
[3] H. Song, S. A. Bass, U. Heinz, T. Hirano and C. Shen, Phys. Rev. C 83, 054910 (2011) [Phys. Rev. C 86, 059903 (2012)]
[4] F. G. Gardim, F. Grassi, M. Luzum and J. Y. Ollitrault, Phys. Rev. Lett. 109, 202302 (2012)
[5] C. Gale, S. Jeon, B. Schenke, P. Tribedy and R. Venu-gopalan, Phys. Rev. Lett. 110, no. 1, 012302 (2013) [6] Z. Qiu and U. Heinz, Phys. Lett. B 717, 261 (2012) [7] M. Luzum and P. Romatschke, Phys. Rev. Lett. 103,
262302 (2009)
[8] B. H. Alver, C. Gombeaud, M. Luzum and J. Y. Olli-trault, Phys. Rev. C 82, 034913 (2010)
[9] R. S. Bhalerao, M. Luzum and J. Y. Ollitrault, J. Phys. G 38, 124055 (2011)
[10] P. Bozek, Phys. Rev. C 85, 014911 (2012)
[11] J. L. Nagle et al., Phys. Rev. Lett. 113, no. 11, 112301 (2014)
[12] L. Yan and J. Y. Ollitrault, Phys. Rev. Lett. 112, 082301 (2014)
[13] I. Kozlov, M. Luzum, G. Denicol, S. Jeon and C. Gale, arXiv:1405.3976 [nucl-th].
[14] K. Aamodt et al. [ALICE Collaboration], Phys. Rev. Lett. 105, 252302 (2010)
[15] K. Aamodt et al. [ALICE Collaboration], Phys. Rev. Lett. 107, 032301 (2011)
[16] S. Chatrchyan et al. [CMS Collaboration], Phys. Rev. C 89, no. 4, 044906 (2014)
[17] S. Chatrchyan et al. [CMS Collaboration], Phys. Lett. B 718, 795 (2013)
CMS (pt≥ 0.3 GeV)
Cent. v2{EP } v3{EP }
0–5% 0.0264 – 0.0272 0.0203 – 0.0217 5–10% 0.0444 – 0.0460 0.0242 – 0.0259 10–15% 0.0595 – 0.0618 0.0268 – 0.0287 15–20% 0.0719 – 0.0748 0.0289 – 0.0311 20–25% 0.0821 – 0.0856 0.0308 – 0.0333 25–30% 0.0905 – 0.0946 0.0321 – 0.0349 30–35% 0.0971 – 0.1018 0.0331 – 0.0364 35–40% 0.1019 – 0.1070 0.0341 – 0.0378 40–50% 0.1062 – 0.1118 0.0342 – 0.0386 50–60% 0.1070 – 0.1130 0.0323 – 0.0376 60–70% 0.1006 – 0.1065 0.0265 – 0.0321
TABLE II. Prediction for integrated v2{EP } and v3{EP },
integrated over pt≥ 0.3 GeV, using the measurements in [65]
as a baseline. Since the value of vn{EP } depends on the
event plane resolution, these predictions assume the analysis is done in a way to ensure the same resolution at both collision energies.
[18] V. Khachatryan et al. [CMS Collaboration], Phys. Rev. Lett. 115, no. 1, 012301 (2015)
[19] A. Adare et al. [PHENIX Collaboration], Phys. Rev. Lett. 115, no. 14, 142301 (2015)
[20] G. Aad et al. [ATLAS Collaboration], Phys. Rev. C 90, no. 4, 044906 (2014)
[21] T. Hirano and M. Gyulassy, Nucl. Phys. A 769, 71 (2006) [nucl-th/0506049].
[22] L. P. Csernai, J. I. Kapusta and L. D. McLerran, Phys. Rev. Lett. 97, 152303 (2006) [nucl-th/0604032].
6 ATLAS (pt≥ 0.5 GeV) Cent. v2{2} v3{2} 0–2% 0.0274 – 0.0280 0.0247 – 0.0261 2–5% 0.0380 – 0.0390 0.0276 – 0.0292 5–10% 0.0549 – 0.0568 0.0308 – 0.0326 10–15% 0.0732 – 0.0764 0.0340 – 0.0362 15–20% 0.0883 – 0.0928 0.0367 – 0.0392 20–25% 0.1007 – 0.1065 0.0389 – 0.0419 25–30% 0.1112 – 0.1180 0.0410 – 0.0445 30–35% 0.1194 – 0.1271 0.0427 – 0.0469 35–40% 0.1258 – 0.1343 0.0440 – 0.0489 40–45% 0.1302 – 0.1390 0.0450 – 0.0506 45–50% 0.1325 – 0.1415 0.0453 – 0.0518 50–55% 0.1329 – 0.1417 0.0453 – 0.0525 55–60% 0.1315 – 0.1397 0.0446 – 0.0527 60–80% 0.1251 – 0.1314 0.0451 – 0.0560
TABLE III. Prediction for integrated v2{2} and v3{2},
inte-grated over pt≥ 0.5 GeV, using the measurements in [66] as
a baseline.
[23] J. Noronha-Hostler, J. Noronha and C. Greiner, Phys. Rev. Lett. 103, 172302 (2009)
[24] J. Noronha-Hostler, J. Noronha and C. Greiner, Phys. Rev. C 86, 024913 (2012)
[25] J. Xu, J. Liao and M. Gyulassy, Chin. Phys. Lett. 32, no. 9, 092501 (2015)
[26] C. Wesp, A. El, F. Reining, Z. Xu, I. Bouras and C. Greiner, Phys. Rev. C 84, 054911 (2011)
[27] Y. Hidaka and R. D. Pisarski, Phys. Rev. D 81, 076002 (2010)
[28] N. Christiansen, M. Haas, J. M. Pawlowski and N. Strodthoff, Phys. Rev. Lett. 115, no. 11, 112002 (2015)
[29] V. Ozvenchuk, O. Linnyk, M. I. Gorenstein, E. L. Bratkovskaya and W. Cassing, Phys. Rev. C 87, no. 6, 064903 (2013)
[30] S. Cremonini, U. Gursoy and P. Szepietowski, JHEP 1208, 167 (2012)
[31] M. Luzum and P. Romatschke, Phys. Rev. C 78, 034915 (2008) [Phys. Rev. C 79, 039903 (2009)]
[32] E. Retinskaya, M. Luzum and J. Y. Ollitrault, Phys. Rev. C 89, no. 1, 014902 (2014)
[33] H. Niemi, K. J. Eskola and R. Paatelainen, Phys. Rev. C 93, no. 2, 024907 (2016)
[34] K. Aamodt et al. [ALICE Collaboration], Phys. Rev. Lett. 105, 252301 (2010)
[35] G. Aad et al. [ATLAS Collaboration], Phys. Lett. B 710, 363 (2012)
[36] J. Adam et al. [ALICE Collaboration], arXiv:1512.06104 [nucl-ex].
[37] F. G. Gardim, F. Grassi, M. Luzum and J. Y. Ollitrault, Phys. Rev. C 85, 024908 (2012)
[38] M. L. Miller, K. Reygers, S. J. Sanders and P. Stein-berg, Ann. Rev. Nucl. Part. Sci. 57, 205 (2007)
[nucl-ex/0701025].
[39] B. Alver, M. Baker, C. Loizides and P. Steinberg, arXiv:0805.4411 [nucl-ex].
[40] M. Rybczynski, G. Stefanek, W. Broniowski and P. Bozek, Comput. Phys. Commun. 185, 1759 (2014) [41] H.-J. Drescher and Y. Nara, Phys. Rev. C 75, 034905
(2007) [nucl-th/0611017].
[42] J. L. ALbacete and A. Dumitru, arXiv:1011.5161 [hep-ph].
[43] J. S. Moreland, J. E. Bernhard and S. A. Bass, Phys. Rev. C 92, no. 1, 011901 (2015)
[44] B. Abelev et al. [ALICE Collaboration], Phys. Rev. C 88, no. 4, 044909 (2013)
[45] K. A. Olive et al. [Particle Data Group Collaboration], Chin. Phys. C 38, 090001 (2014).
[46] D. A. Fagundes and M. J. Menon, Nucl. Phys. A 880, 1 (2012)
[47] G. Antchev et al. [TOTEM Collaboration], Europhys. Lett. 101, 21004 (2013).
[48] A. Dumitru and Y. Nara, Phys. Rev. C 85, 034907 (2012) [49] J. Noronha-Hostler, G. S. Denicol, J. Noronha, R. P. G. Andrade and F. Grassi, Phys. Rev. C 88, 044916 (2013)
[50] J. Noronha-Hostler, J. Noronha and F. Grassi, Phys. Rev. C 90, no. 3, 034907 (2014)
[51] J. Noronha-Hostler, J. Noronha and M. Gyulassy, Phys. Rev. C 93, no. 2, 024909 (2016)
[52] P. Huovinen and P. Petreczky, Nucl. Phys. A 837, 26 (2010)
[53] P. F. Kolb, J. Sollfrank and U. W. Heinz, Phys. Rev. C 62, 054909 (2000) [hep-ph/0006129].
[54] P. F. Kolb and R. Rapp, Phys. Rev. C 67, 044903 (2003) [hep-ph/0210222].
[55] P. Bozek and W. Broniowski, Phys. Rev. C 85, 044910 (2012)
[56] J. P. Blaizot and J. Y. Ollitrault, Phys. Lett. B 191, 21 (1987).
[57] J. Y. Ollitrault, Phys. Lett. B 273, 32 (1991).
[58] C. Shen, U. Heinz, P. Huovinen and H. Song, Phys. Rev. C 84, 044903 (2011)
[59] P. Kovtun, D. T. Son and A. O. Starinets, Phys. Rev. Lett. 94, 111601 (2005) [hep-th/0405231].
[60] P. Bozek and I. Wyskiel-Piekarska, Phys. Rev. C 85, 064915 (2012)
[61] J. Vredevoogd and S. Pratt, Phys. Rev. C 79, 044915 (2009)
[62] J. Liu, C. Shen and U. Heinz, Phys. Rev. C 91, no. 6, 064906 (2015) [Phys. Rev. C 92, no. 4, 049904 (2015)] [63] W. van der Schee, P. Romatschke and S. Pratt, Phys.
Rev. Lett. 111, no. 22, 222302 (2013)
[64] H. Niemi, K. J. Eskola, R. Paatelainen and K. Tuominen, Phys. Rev. C 93, no. 1, 014912 (2016)
[65] S. Chatrchyan et al. [CMS Collaboration], Phys. Rev. C 87, no. 1, 014902 (2013)
[66] G. Aad et al. [ATLAS Collaboration], Phys. Rev. C 86, 014907 (2012)
![FIG. 1. Percent change in rms eccentricity ε 2 (a) and tri- tri-angularity ε 3 (b) when the collision energy is increased from 2.76 TeV to 5.02 TeV, for several models of initial conditions for heavy-ion collisions — Glauber [39], Trento [43], MC-KLN [41]](https://thumb-eu.123doks.com/thumbv2/123doknet/12846401.367558/3.918.480.842.81.498/percent-eccentricity-angularity-collision-increased-conditions-collisions-glauber.webp)
![TABLE I. Prediction for integrated v 2 {2} and v 3 {2}, inte- inte-grated over p t ≥ 0.2 GeV, using the measurements in [15] as a baseline.](https://thumb-eu.123doks.com/thumbv2/123doknet/12846401.367558/6.918.138.391.73.269/table-prediction-integrated-inte-grated-using-measurements-baseline.webp)
![TABLE III. Prediction for integrated v 2 {2} and v 3 {2}, inte- inte-grated over p t ≥ 0.5 GeV, using the measurements in [66] as a baseline.](https://thumb-eu.123doks.com/thumbv2/123doknet/12846401.367558/7.918.141.392.76.349/table-iii-prediction-integrated-grated-using-measurements-baseline.webp)
