HAL Id: cirad-02982765
http://hal.cirad.fr/cirad-02982765
Submitted on 28 Oct 2020HAL is a multi-disciplinary open access archive for the deposit and dissemination of sci-entific research documents, whether they are pub-lished or not. The documents may come from teaching and research institutions in France or
L’archive ouverte pluridisciplinaire HAL, est destinée au dépôt et à la diffusion de documents scientifiques de niveau recherche, publiés ou non, émanant des établissements d’enseignement et de recherche français ou étrangers, des laboratoires
Zinc speciation in organic waste drives its fate in
amended soils
Nounagnon Richard Hodomihou, Frédéric Feder, Samuel Legros, Thiago
Augusto, Enzo Lombi, Emmanuel Doelsch
To cite this version:
Nounagnon Richard Hodomihou, Frédéric Feder, Samuel Legros, Thiago Augusto, Enzo Lombi, et al.. Zinc speciation in organic waste drives its fate in amended soils. Environmental Science and Technology, American Chemical Society, 2020. �cirad-02982765�
Zinc speciation in organic waste drives its fate in
1
amended soils
2
Nounagnon Richard Hodomihou§, Frédéric Feder§, Samuel Legros§, Thiago Augusto 3
Formentini‡¥, Enzo Lombi, Emmanuel Doelsch†* 4
§ CIRAD, UPR Recyclage et risque, 18524 Dakar, Senegal 5
Recyclage et Risque, Univ. Montpellier, CIRAD, Montpellier, France 6
‡ Laboratory of Environmental Engineering, Federal University of Santa Maria (UFSM), 97105-7
900 Santa Maria, RS, Brazil 8
¥ Department of Soil and Environment, Swedish University of Agricultural Sciences, SE-75007
9
Uppsala, Sweden 10
Future Industries Institute, University of South Australia, Adelaide, SA 5095, Australia 11
† CIRAD, UPR Recyclage et risque, F-34398 Montpellier, France 12
13
*Corresponding author. Emmanuel Doelsch, doelsch@cirad.fr 14
KEYWORDS. Trace element, agriculture, recycling, environmental fate, phosphate, 15
contamination 16
ABSTRACT. 17
Recycling of organic waste (OW) as fertilizer on farmland is a widespread practice that fosters 18
sustainable development via resource reuse. However, the advantages of OW fertilization should 19
be weighed against the potentially negative environmental impacts due to the presence of 20
contaminants such as zinc (Zn). Current knowledge on the parameters controlling the 21
environmental fate of Zn following OW application on cultivated soils is scant. We addressed this 22
shortcoming by combining soil column experiments and Zn speciation characterization in OWs 23
and amended soils. Soil column experiments were first carried out using two contrasted soils 24
(sandy soil and sandy clay loam) that were amended with sewage sludge or poultry manure and 25
cropped with lettuce. The soil columns were irrigated with identical amounts of water twice a week 26
and the leachates collected at the column oulet were monitored and analyzed. This scheme (OW 27
application and lettuce crop cycle) was repeated for each treatment. Lettuce yields and Zn uptake 28
were assessed at the end of each cycle), The soil columns were dismantled and seven soil layers 29
were sampled and analysed at the end of the second cycle (total experiment time: 12 weeks). XAS 30
analyses were then conducted to assess Zn speciation in OW and OW-amended soils. The results 31
of this study highlighted that: (i) Zn fate in water–soil–plant compartments was similar, regardless 32
the type of soil and OW, (ii) >97.6% of the Zn input from OW accumulated in the soil surface 33
layer, (iii) Zn uptake by lettuce increased with repeated OW applications, and (iv) no radical 34
change in Zn speciation was observed at the end of the 12-week experiment and phosphate was 35
found to drive Zn speciation in both OW and amended soils (i.e. amorphous Zn-phosphate and Zn 36
sorbed on hydoxylapatite). These results suggest that Zn speciation in OW is a key determinant 37
controlling the environmental fate of this element in OW-amended soils. 38
ABSTRACT ART
39 40
Introduction
42
The rapid increase in the African population (by 1.3 billion people between 2017 and 20501) 43
combined with the high urbanization rate2 has led to an urban and periurban agriculture boom.3, 4 44
In developing countries, the market garden farming intensification is being achieved via inputs of 45
biodegradable materials such as sewage sludge, livestock manure, green waste compost, etc., as 46
soil fertilizers. These biodegradable materials, referred to as organic wastes (OWs), can supply a 47
part or all of the nutrients needed for crops.4, 5 However, many studies have highlighted negative 48
impacts of agricultural OW recycling as fertilizers due to the presence of contaminants such as 49
trace elements.6, 7 50
A recent assessment of periurban Dakar (Senegal) agrosystems highlighted trace element 51
contamination of OW-amended cropped soils.8 Zinc (Zn) accumulation in soil surface layers has 52
been explained by long-term repeated Zn-rich OW application. 8 Short-term vegetable crop cycles 53
led to sewage sludge (SS) or poultry manure (PM) application up to 9 times per year over a 24 to 54
40 year period. The annual Zn input in periurban Dakar agrosystems ranged from 1369 to 5818 55
g.ha-1year-1, which is alarmingly higher than the 454-539 g.ha-1year-1 range in European countries 56
and China.9-11 Surprisingly, Zn contamination was similar in the two main periurban Dakar 57
agrosystems (Pikine and Rufisque) despite the fact that the properties of the soils in these two 58
regions differ markedly. One is an Arenosol (sandy soil, dune material) and the other a Fluvisol 59
(sandy clay loam and moderately calcareous soil).12 However, an analytical approach8, involving 60
a comparison of Zn contents in long-term cultivated plots versus adjacent uncultivated plots, did 61
not enable (i) accurate monitoring of the Zn fate following OW spreading in the three water–soil– 62
plant system compartments, (ii) determination of the factors that could explain the similar fate of 63
65
X-ray absorption spectroscopy (XAS) is one of the most widely known structural techniques 66
for direct determination of speciation of trace elements present in complex matrices and it has been 67
successfully applied to describe Zn speciation in different OWs13-18 or amended soils19-22. 68
Kirpichtchikova et al.20 and Formentini et al.21 studied Zn speciation in soils affected by long-term 69
application of sewage water and pig slurry, respectively. In both studies, Zn speciation in soils was 70
dominated by its associations with secondary mineral phases (clay minerals and Fe 71
oxyhydroxides). Zn speciation in OW was assessed by Formentini et al.21, revealing that nano-ZnS 72
accounted for 100% of the speciation in the pig slurry. Yamamoto et al.22 recently investigated Zn 73
speciation in pig manure compost and in a soil amended with this compost for 23 years. They 74
showed that oxidized species present in the compost, i.e. Zn-phosphate and Zn bound to OM, had 75
persisted and accumulated in the amended soil. Although these studies agreed on the fact that Zn 76
accumulated in the soil following OW spreading, their results were not consistent with respect to 77
Zn speciation in OWs and in OW-amended soils. 78
The present study combined soil column experiments and Zn speciation analyses to characterize 79
the fate of Zn in periurban Dakar agrosystems. Soil column experiments were first carried out using 80
two contrasted soils that prevail in these agrosystems (i.e. an Arenosol from Pikine and a Fluvisol 81
from Rufisque). Sewage sludge (SS) or poultry manure (PM) were applied at doses consistent with 82
local agricultural practices and the soil columns were cropped with lettuce (Lactuca sativa L.). 83
Laboratory studies were conducted to thoroughly control water and solute fluxes and to obtain an 84
accurate measurement of the mass balance of Zn distribution in the water–soil–plant system. XAS 85
analyses were then used to assess Zn speciation in OW and OW-amended soils from the soil 86
column experiments.13-22 87
This combined approach enabled us to: (i) monitor Zn fate in the three compartments of the 88
water–soil–plant system, and (ii) identify parameters controlling the fate of Zn following OW 89
application on contrasted types of soil. 90
Materials and Methods
91
Organic waste and soil characteristics
92
Arenosol (Pikine; sandy soil, dune material) and Fluvisol (Rufisque; sandy clay loam and 93
moderately calcareous soil)12 were selected for this study as they are the main soils in the periurban 94
Dakar region, under the prevailing Sahelian tropical climatic conditions. The Arenosol texture was 95
dominated by the sand fraction (96.2–97.1%). Silt and clay accounted for 15.3–15.7% and 24.9– 96
28.8% of the Fluvisol content, respectively (Table 1, SI 1). The water holding capacity, total 97
limestone, pH and organic carbon were much lower in the Arenosol than in the Fluvisol. Quartz, 98
critobalite, sanidine and muscovite mainly accounted for the mineralogy of the Arenosol (SI 2). 99
This contrasted with the Fluvisol mineralogy, in which several clay minerals (kaolinite, 100
montmorillonite, palygorskite and kaolinite), calcite and quartz were detected. 101
Sewage sludge (SS) and poultry manure (PM), are widely used as fertilizers in market gardens 102
in periurban Dakar agrosystems. SS was sampled at the Pikine municipal wastewater treatment 103
plant, and PM was sampled in a henhouse at Rufisque (SI 1). Both SS and PM had been stockpiled 104
for long periods prior to being spread on the soil columns (>3 months) which is consistent with of 105
market gardeners’ practices. The ash content of SS (34%) was lower than that for PM (49%), 106
whereas P concentrations were close for SS and PM (17.3 and 16.8 mg.kg-1, respectively). The Zn 107
concentration was higher in SS than in PM (1003 and 320 mg.kg-1, respectively). The Zn 108
concentration in SS was lower than the maximum permissible limits for land application in Europe 109
(2500–4000 mg.kg-1 DM), but higher than the most restrictive threshold values set by national 110
legislation (Sweden: 800 mg.kg-1; Netherlands: 300 mg.kg-1).23 The Zn concentration in PM was 111
in very close agreement with Zn concentrations inventoried in United States, Canada, different 112
European (Switzerland and Austria) and Asian (China and Japan) countries.24 113
115
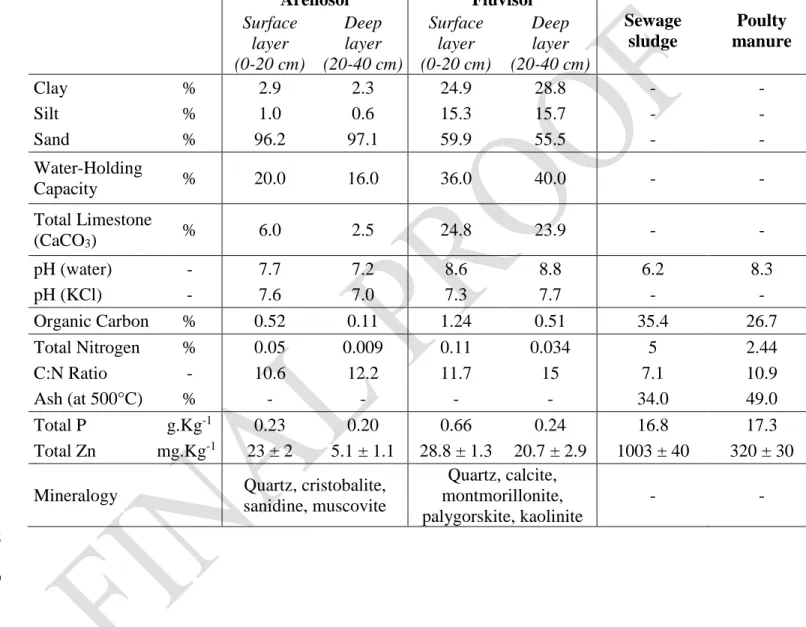
Table 1: Soil and organic waste characteristics. Concentrations are expressed on a dry matter (DM) 116
basis. The analytical methods are described in SI 1 and SI 2. 117 Arenosol Fluvisol Sewage sludge Poulty manure Surface layer (0-20 cm) Deep layer (20-40 cm) Surface layer (0-20 cm) Deep layer (20-40 cm) Clay % 2.9 2.3 24.9 28.8 - - Silt % 1.0 0.6 15.3 15.7 - - Sand % 96.2 97.1 59.9 55.5 - - Water-Holding Capacity % 20.0 16.0 36.0 40.0 - - Total Limestone (CaCO3) % 6.0 2.5 24.8 23.9 - - pH (water) - 7.7 7.2 8.6 8.8 6.2 8.3 pH (KCl) - 7.6 7.0 7.3 7.7 - - Organic Carbon % 0.52 0.11 1.24 0.51 35.4 26.7 Total Nitrogen % 0.05 0.009 0.11 0.034 5 2.44 C:N Ratio - 10.6 12.2 11.7 15 7.1 10.9 Ash (at 500°C) % - - - - 34.0 49.0 Total P g.Kg-1 0.23 0.20 0.66 0.24 16.8 17.3 Total Zn mg.Kg-1 23 ± 2 5.1 ± 1.1 28.8 ± 1.3 20.7 ± 2.9 1003 ± 40 320 ± 30
Mineralogy Quartz, cristobalite,
sanidine, muscovite Quartz, calcite, montmorillonite, palygorskite, kaolinite - - 118 119
Soil column experiment
120
The soil columns consisted of polyethylene cylinders (50 cm h, 33 cm dia.) that were 121
reconstituted to reproduce in situ conditions. Two soil layers (0–20 cm and 20–40 cm) were 122
sampled in the Arenosol and Fluvisol. Soils were air dried, decumpled and then reconstituted while 123
maintaining the soil bulk densities measured in situ (1.65 kg.dm-3 for the Arenosol and 1.4 kg.dm -124
3 for the Fluvisol). The weight of Arenosol was 56 kg.column-1 (47 kg.column-1 for Fluvisol). SS 125
and PM were applied at the surface of the soil columns at 60 T.ha-1 (0.51 kg.column-1). Control 126
soil columns without OW application (0 T.ha-1) were also monitored. Three replicates per 127
treatment (a treatment is defined as a type of soil amended with a type of OW) were performed, 128
representing a total of 18 soil columns. 129
Lettuces (Lactuca sativa L.) were cultivated 1 week after OW application. During the crop cycle 130
(5 weeks), soil columns received 4 L of water twice a week, corresponding to 46.8 mm or 0.3 pore 131
volume (PV) for the Arenosol and 0.25 PV for the Fluvisol. Leached soil solutions were sampled 132
at the bottom of the soil columns weekly and analysed for pH, Zn concentration and dissolved 133
organic carbon (DOC). Lettuce leaves were harvested at the end of the crop cycle. Dry biomass 134
was weighed to determine yields and Zn uptake. 135
This scheme (OW application and lettuce crop cycle) was repeated for each treatment. At the 136
end of the second cycle (total experiment time: 12 weeks), the soil columns were dismantled and 137
seven soil layers were sampled and analysed. 138
The experimental procedure is described in further detail in SI 3. 139
Zinc speciation in organic wastes and soils
141
X-ray absorption spectroscopy (XAS) was applied to assess the speciation of Zn in OW and the 142
surface layer (0-3 cm) of amended soils (amended Fluvisol, PM-amended Fluvisol and SS-143
amended Arenosol). Zn K-edge XAS spectra were recorded at the ESRF synchrotron (Grenoble, 144
France) on the BM30B (FAME) beamline. Dried OW and soil samples were cryo-ground (Retsch 145
MM400) and pressed into pellets before analysis. Spectra were measured at liquid helium 146
temperature, to minimise beam-induced damage of the samples, in fluorescence mode with a 30-147
element solid-state Ge detector. The spectra of each sample were an average of three to seven 148
scans, depending on the Zn concentration and the signal-to-noise ratio. The acquisition of EXAFS 149
spectra for the PM-amended Arenosol was not possible due to the combination of a low Zn 150
concentration and a very high Fe concentration. Each scan was measured on a different spot on 151
the sample pellet to limit beam damage. Energy calibration was performed using metallic Zn 152
reference foil recorded simultaneously with the samples. The absorption edge was defined at 9659 153
eV, as indicated by the zero crossing of the second derivative of the Zn-foil spectrum. A similar 154
procedure was applied to the previously acquired spectra of Zn reference compounds. 155
Normalization and data reduction were performed according to standard methods25 using Athena 156
software.26 A library of spectra from Zn reference compounds was used to identify Zn species in 157
OW and soil (SI 4). These references have been synthesized or purchased and described in previous 158
published studies: Nano-ZnS and Amorphous Zn-Phosphate 13 ; Zn sorbed on Goethite and Zn 159
sorbed on Ferrihydrite 27 ; Zn Cryptomelane 28 ; Zn-Layered Double Hydroxide, Zn sorbed on 160
hydroxy-Al interlayered montmorillonite 29 ; Zn sorbed on Kaolinite 30 ; Zn sorbed on 161
Hydroxylapatite 31 ; Zn-Malate, Zn-Histidine, Zn-Cysteine 27, 32 ; Zn-Methionine 15, 33 ; Zn-Phytate 162
15, 34 ; Zn-Oxalate, Crystalline Zn Phosphate and Sphalerite (reagent grade, Sigma Aldrich). 163
Reference material spectra and sample spectra were measured in the same conditions. Least square 164
linear combination fitting (LCF, SI 5) was performed for each OW or amended soil spectrum over 165
a k-range of 2.5-10.6 Å-1. The residual factor of each LCF was calculated as follows: R = 166
Σ(𝑘3𝜒(𝑘)𝑒𝑥𝑝− 𝑘3𝜒(𝑘)𝑓𝑖𝑡)2/Σ(𝑘3𝜒(𝑘)𝑒𝑥𝑝)2. At each step of the fitting, an additional reference 167
spectrum was added and retained in the result if the following two conditions were true: (i) the 168
residual factor decreased by 20% or more, and (ii) the additional reference had a contribution equal 169
to or higher than 10% among Zn-species used for the fit. The uncertainty of this LCF method was 170 estimated at ±15%.25 171 172 Statistical Analysis 173
Data are presented as means of three independent soil columns and mean values were taken for 174
statistical analyses using one-way ANOVA. Significant differences were further analysed using 175
the Student–Newman–Keuls test to identify differences between modalities. The differences were 176
considered significant if p ≤ 0.05. 177
178
Results and Discussion
179
Accumulation of OW-borne Zn in the soil surface layer
180
The different mass balance terms in the soil column experiments are shown in Table 2. Note that 181
the Zn mass balance ((Initial Zn content in the soil column + Zn input from OW) – (Zn leaching 182
at the soil column outlet + Zn uptake by lettuce)) was not statistically different from the final Zn 183
content in the soil column, indicating that the different mass balance terms had been accurately 184
quantified and no compartments (soil, plant or leaching) were overlooked. Since Zn concentrations 185
in the OWs varied (see Table 1), Zn inputs in the amended soils were different: SS application 186
provided 3.1-fold more Zn than PM (1029 and 328 mg, respectively, for the whole experiment). 187
For the Fluvisol columns, there was no significant difference between the leached Zn 188
concentration at the outlet when comparing the control and the amended columns, indicating that 189
exogenous Zn (i.e. Zn derived from OW) was not leached from the Fluvisol column. In contrast, 190
Arenosol promoted leaching of a minor fraction of the exogenous Zn. The leached Zn at the outlet 191
of the Arenosol columns represented 0.15% of the Zn input in the SS-amended soil and 1.9% of 192
the Zn input in the PM-amended soil. 193
For both soils, OW application enhanced Zn uptake by lettuce as compared to the control soil. 194
Total Zn uptake by lettuce (cumulated for the two cycles) was similar regardless of the treatment 195
(soil+OW), ranging from 0.36% (SS-amended Fluvisol) to 0.68% (PM-amended Fluvisol) of the 196
Zn inputs. 197
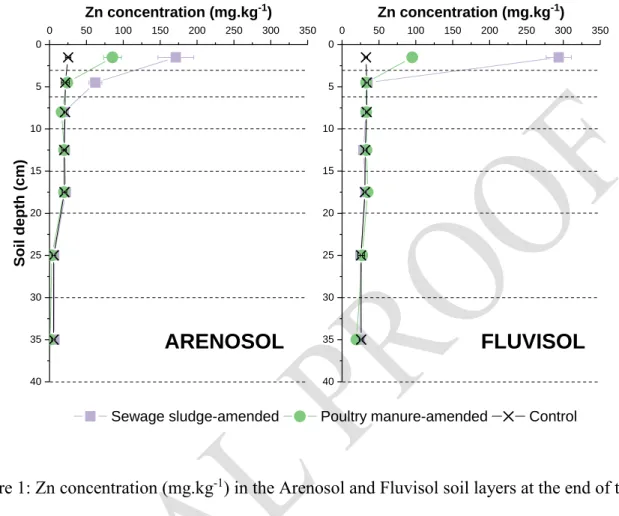
Soil column dismantling and analysis at the end of the two crop cycles highlighted the 198
accumulated Zn distribution through the soil profile (Figure 1). In the Fluvisol, exogeneous Zn 199
remained entirely in the 0–3 cm surface layer for both SS- and PM-amended soils. In the Arenosol, 200
exogenous Zn was distributed in the 0–3 cm and 3–6 cm layers for the SS-amended soil and 0–3 201
cm for the PM-amended soil. Zn derived from OWs was therefore not transferred through the soil 202
profile to deeper layers. 203
Overall, 99.6, 99.3 and 99.4% of OW-borne Zn accumulated in the upper soil layers (0–3 and 204
3–6 cm) for the SS-amended Fluvisol, PM-amended Fluvisol and SS-amended Arenosol, 205
respectively, whereas 97.6% of Zn accumulated in the 0–3 cm soil layer for the PM-amended 206
Arenosol. This exogenous Zn accumulation in the upper soil layers after OW spreading has already 207
been observed. For instance, Formentini et al.6 assessed the impact of 11 years of pig slurry 208
spreading in a clayey Hapludox soil. They concluded that most exogenous Zn accumulated within 209
the topsoil layers, with assimilation by crops and leaching virtually negligible in the overall Zn 210
balance. 211
This study specifically highlighted a soil effect. The Arenosol promoted leaching of a small 212
fraction of Zn in drained water (SI 6) and migration from 0 to 6 cm depth (Figure 1). The sandy 213
texture of the Arenosol associated with its high hydraulic conductivity might have favored 214
particulate or dissolved Zn movement. Conversely, higher clay, carbonate and organic matter 215
contents, basic pH and the higher cation exchange capacity of the Fluvisol might have favored Zn 216
accumulation in the surface layer (Figure 1). 217
An OW effect was also highlighted. We observed a 1 pH unit time-course decrease in the 218
solution collected at the outlet of the SS-amended Arenosol (SI 6). This decrease in pH is common 219
and attributed to the acidic effect of OW mineralization and the ammonium nitrification process27, 220
35, 36. It is well established that pH is the major driver of Zn solubility in soils37 and the observed 221
decrease in pH favoured Zn leaching in the SS-amended Arenosol. However, Zn leaching at the 222
outlet of the PM-amended Arenosol column (1.9% of the Zn input) was surprising as the pH of the 223
soil solution was stable and slightly alkaline (pH=7.3-8) throughout the experiment (SI 6). 224
Nevertheless, Zn leaching was closely correlated with the DOC at the column outlet (SI 7). 225
Complexation with organic ligands could have mobilized a fraction of exogenous Zn.Several 226
studies concluded that colloidal transport can favour trace element transfer in soils following OW 227
spreading. For example, Karathanasis et al.38 studied Cu, Zn and Pb elution in a soil monolith. 228
They demonstrated the elution of significant soluble metal loads in association with water-229
dispersible biosolid colloids. Similarly, Yamamoto et al.22 studied the fate of P, Zn and Cu in soil 230
affected by a long-term application of swine manure compost. They demonstrated that continual 231
compost application enhanced the formation of a soil water dispersible colloid in which Zn, Cu 232
and P were accumulated. 233
235
236
Figure 1: Zn concentration (mg.kg-1) in the Arenosol and Fluvisol soil layers at the end of the soil 237
column experiment. Dashed lines represent the analysed soil layers. 238 40 35 30 25 20 15 10 5 0 0 50 100 150 200 250 300 350 40 35 30 25 20 15 10 5 0 0 50 100 150 200 250 300 350
FLUVISOL
Zn concentration (mg.kg-1)Sewage sludge-amended Poultry manure-amended Control
Soil d ep th ( cm)
ARENOSOL
Zn concentration (mg.kg-1)Table 2: Mass balances in the soil column experiments. The Zn content is expressed in mg. 239
Arenosol Fluvisol
Control SS-amended PM-amended Control SS-amended PM-amended
(1) Initial Zn content in the soil
column 809 ± 67 809 ± 67 809 ± 67 1168 ± 98 1168 ± 98 1168 ± 98
(2) Zn input from OWa - 1029 ± 41 328 ± 31 - 1029 ± 41 328 ± 31
(3) Zn leaching at the soil
column outlet b 3.7 ± 0.3 5.2 ± 0.5 (0.15%±0.08%) 9.9 ± 0.9 (1.9%±0.56%) 12.6 ± 2.2 9.3 ± 3.5 (0%±0.50%) 11.9 ± 1.9 (0%±1.02%) (4) Zn uptake by lettucec 0.2 ± 0.04 4.6 ± 0.7 (0.42%±0.09%) 1.8 ± 0.2 (0.46%±0.12%) 0.7 ± 0.1 4.4 ± 0.7 (0.36%±0.10%) 2.9 ± 0.3 (0.68%±0.18%) (5) Final Zn content in the soil
columnd 768 ± 163 1618 ± 230 912 ± 130 1366 ± 133 2267 ± 132 1567 ± 91 (6) Zn balance: (1) + (2) – ((3) + (4)) 805 ± 67NS e 1828 ± 110NS 1126 ± 99NS 1154 ± 100NS 2183 ± 143NS 1481 ± 131NS a Zn input from OW = 𝑍𝑛
𝑂𝑊 𝐶1+ 𝑍𝑛𝑂𝑊 𝐶2, where 𝑍𝑛𝑂𝑊 𝐶1 is the Zn input from SS or PM for cycle 1 and 𝑍𝑛𝑂𝑊 𝐶2 is the Zn input 240
from SS or PM for cycle 2. 241
b Zn leaching at the soil column outlet = ∑ [𝑍𝑛] 𝑖 𝑛
𝑖=1 × 𝐹𝑖, where [𝑍𝑛]𝑖 is the Zn concentration measured in the leachate at week i, 242
and 𝐹𝑖 is the water flux measured at the bottom of the column at week i. n is the number of weeks (n = 12). Percentage of OW-derived 243
Zn calculated after normalization by Zn leaching measured for the control soil column. 244
c Zn uptake by lettuce = 𝑍𝑛
𝑃 𝐶1+ 𝑍𝑛𝑃 𝐶2, where 𝑍𝑛𝑃 𝐶1 is the mass Zn uptake by lettuce for cycle 1, and 𝑍𝑛𝑃 𝐶1 is the mass Zn 245
uptake by lettuce for cycle 2. Percentage of OW-derived Zn derived calculated after normalization by Zn uptake measured for the control 246
soil column. 247
d Final Zn content in the soil column = ∑ [𝑍𝑛] 𝑗× 𝑚
𝑗=1 𝑀𝑆𝑙𝑗, where [𝑍𝑛]𝑗 is the Zn concentration measured in soil layer j, and 𝑀𝑆𝑙𝑗 248
is the mass of soil layer j. m is the number of soil layers (m=7). 249
e NS= no significant difference between the final Zn content in the soil column (5) and the Zn balance (6) at the 5% level. 250
Zinc uptake by lettuce increases with repeated organic wastes application
251
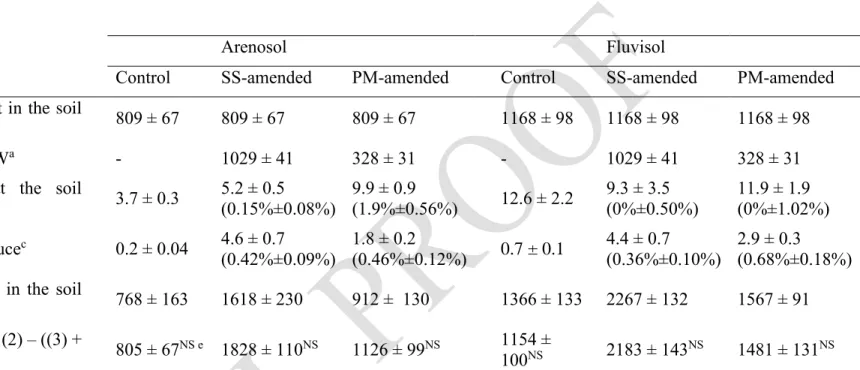
For both soils, PM or SS application significantly increased the lettuce biomass in comparison 252
to the unfertilized control soil (Figure 2a). No significant differences in yields were found between 253
the first and second lettuce crop cycle within a same treatment (except for the Fluvisol control, for 254
which a decrease in dry biomass was observed). This highlights the fertilization value of OW, 255
which represents a potential alternative to inorganic fertilizers for crop production.39 256
Significantly higher Zn uptake by lettuce was measured in the OW-amended soils than in the 257
control soils (Figure 2b). Moreover, we observed a significant increase in Zn uptake by lettuce 258
between the first and second OW application for the SS-amended Arenosol and PM-amended 259
Fluvisol. This was also observed for the other two treatments (PM-amended Arenosol and SS-260
amended Fluvisol), but these findings were not statistically significant. 261
If this trend, i.e. constant crop yield combined with increased Zn uptake, were to be confirmed 262
by long-term experiments with repeated OW application and successive crop cycles, OW 263
fertilization could represent an opportunity to improve the Zn content of staple food crops. Such 264
agronomic biofortification40 could help tackle Zn deficiency in human populations which is a cause 265
of illness and death in developing countries.41 The advantages of using OW to increase the plant 266
Zn concentration should, however, be assessed together with the potential uptake of toxic trace 267
elements such as Cd or Pb. 268
270
Figure 2 (a) Mean harvested lettuce dry biomass per soil column (g) and (b) mean Zn uptake by 271
lettuces per soil column (mg). Different letters represents significant differences between 272
treatments at the 5% level. PM: Poultry manure; SS: Sewage sludge 273
274 275
Phosphate drives Zn speciation in organic wastes and amended soils
276
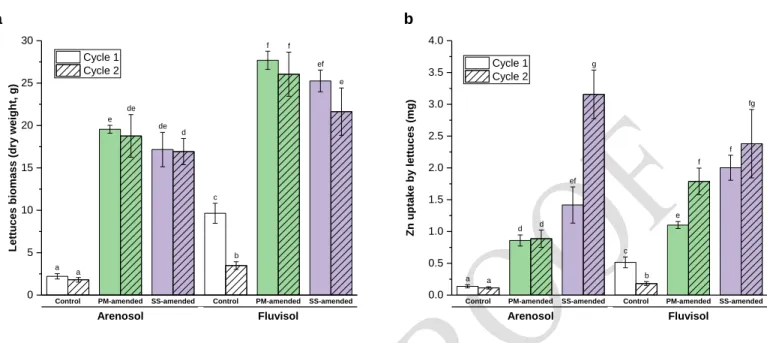
The quantitative LCF results (expressed as a percentage of each Zn species) obtained for both 277
OW and OW-amended soils (0-3 cm soil layer) collected at the end of the experiment are shown 278
in Figure 3. The experimental data were modelled with two Zn references per sample and total 279
contributions ranged from 89 to 111% (SI 5, SI8). Zn species contributions were normalized to 280
100% for easier comparison. The R-factor of the LCFs ranged from 0.029 to 0.063. 281
282
Control PM-amended SS-amended Control PM-amended SS-amended
Arenosol Fluvisol 0 5 10 15 20 25 30 f e de e a b c Lettuce s bi omas s (dry w eigh t, g) Cycle 1 Cycle 2 a d f ef de a
Control PM-amended SS-amended Control PM-amended SS-amended
Arenosol Fluvisol 0.0 0.5 1.0 1.5 2.0 2.5 3.0 3.5 4.0 b d a f f g Zn u ptak e by lettuce s (mg ) Cycle 1 Cycle 2 a d ef c b e fg
283
Figure 3: Zn speciation determined from the linear combination fitting of the Zn K-edge extended 284
X-ray absorption fine-structure spectroscopy data (PM = poultry manure, SS = sewage sludge). 285
286
Zn speciation in OWs 287
Zinc phosphate (organic, amorphous or crystalline) accounted for 100% of Zn speciation in SS 288
and PM, which is in agreement with the high affinity of Zn for phosphate compounds.42 289
Amorphous Zn-phosphate was found to be the main Zn species in SS (85%) and PM (92%). The 290
second Zn species was another form of Zn-phosphate: organic Zn-phosphate (15% in SS) or 291
crystalline Zn-phosphate (8% in PM). Hopeite (crystalline Zn-phosphate) has already been 292
documented in previous studies as a major Zn phase in OWs.15, 16, 18, 22, 43 293
In the present study, the amorphous Zn phosphate reference closely matched the Zn speciation 294 85% 90% 92% 84% 87% 15% 13% 8% 10% 16% PM SS 0 20 40 60 80 100 SS-amended Arenosol SS-amended Fluvisol
Amorphous Zn-phosphate Crystalline Zn-phosphate Zn sorbed on hydroxylapatite Organic Zn-phosphate
Zn sorbed on hydroxy-Al interlayered montmorillonite PM-amended
a large series of OW sampled in full-scale plants13 where it was reported for the first time that the 296
main Zn species in compost or stockpiled OW was amorphous Zn-phosphate (40–100%). In this 297
survey, Le Bars et al.13 also demonstrated that nano-sized Zn sulfide (nano-ZnS, with a crystallite 298
size of 3 ± 0.4 nm) was a major Zn species in liquid agricultural OW and SS. This contrasts with 299
our result as zinc phosphate accounted for 100% of Zn speciation in the studied SS. Nevertheless, 300
these discrepancies could be explained by the chemical instability of nano-ZnS which become a 301
minor species after OW composting or stockpiling.13, 16 As the SS and PM in the present study had 302
been stockpiled for a long period (>3 months), they were exposed to atmospheric conditions, which 303
favors nano-ZnS oxidative-dissolution and could explain why nano-ZnS were no longer observed 304
and were replaced by Zn-phosphate species. 305
306
Zn speciation in amended soils 307
The best LCFs for both SS-amended and PM-amended Fluvisol were achieved by combining 308
the same references at almost the same proportions. Amorphous Zn-phosphate was the main 309
species, i.e. 84% for PM-amended Fluvisol and 90% for SS-amended Fluvisol. Zn sorbed on 310
hydroxy-Al interlayered montmorillonite (HIM) was the secondary Zn species, i.e. 16% for PM-311
amended Fluvisol and 10% for SS-amended Fluvisol. The latter mineral reference was supported 312
by the XRD clay mineral findings in the Fluvisol (SI 2). For SS-amended Fluvisol, the Zn 313
speciation pattern was in very close agreement with the Zn distribution in the 0–3 cm soil layer: 314
the proportion of exogenous Zn derived from SS represented 90% of the total soil Zn concentration 315
while the proportion inherited from the pedo-geochemical background represented 10% (Figure 316
1). This agreement was less satisfactory for PM-amended Fluvisol: Zn speciation was 317
characterized as 84% Amorphous Zn phosphate + 16% Zn sorbed on HIM, whereas the proportion 318
of exogenous Zn derived from PM represented 66% of the total soil Zn concentration while the 319
proportion of endogenous Zn represented 34% (Figure 1). In this case, the poor quality of the 320
EXAFS spectra (SI 5), as well as the uncertainty of the LCF method (±15%), could explain this 321
discrepancy. The SS-amended Arenosol contained 87% of Zn sorbed on hydoxylapatite and 13% 322
of Zn-phytate, an organic Zn-phosphate already detected in the SS. Zn sorbed on hydroxylapatite 323
was not detected in SS, in which amorphous Zn-phosphate was found to be the main Zn species. 324
However, the featureless shape of the Zn sorbed on the hydoxylapatite EXAFS spectrum suggested 325
that this phase was a Zn-sorption surface complex or a poorly crystalline Zn-phosphate 326
precipitate.31 This change of speciation (amorphous Zn-phosphate to Zn sorbed on hydoxylapatite) 327
was not fully understood but could be explained by the acidification of the soil solution (-1 pH 328
unit, SI 6) due to organic matter (OM) mineralization. In brief, no radical change in Zn speciation 329
was observed at the end of the 12-week experiment (two OW applications and two lettuce crop 330
cycles) and phosphate was the main driver of Zn speciation in both OWs and amended soils. 331
332
Previous studies and new findings: the benefits of assessing the source speciation to predict
333
the environmental fate
334
To our knowledge, no previous studies have assessed the fate of OW-borne amorphous Zn-335
phosphate species in the soil after OW spreading. More importantly, our results differed 336
substantially from those of previous studies using XAS techniques.19-22 Mamindy-Pajany et al.19 337
described Zn speciation in a soil mixed with SS and spiked with a Zn nitrate solution. Their results 338
(58% Zn sorbed to Fe oxyhydroxides and 42% Zn bound to OM) highlighted the soil retention 339
mechanism with respect to Zn rather than the fate of exogenous OW-derived Zn. In two studies 340
by Kirpichtchikova et al.20 and Formentini et al.21,Zn speciation in soils affected by long-term 341
phases (clay minerals and Fe oxyhydroxides). Surprisingly, nano-ZnS accounted for 100% of the 343
Zn speciation in the pig slurry21, but nano-ZnS was not detected in the amended soil. The authors 344
assumed that the nano-scale of the ZnS favoured oxidation of this species in the soil, in turn 345
releasing Zn that was subsequently retained by the soil matrix. We think that an identical 346
mechanism could explain the Zn speciation in the soil amended by sewage water20, since the 347
conditions in liquid OW are often reducing hence leading to the formation of nano-ZnS13, which 348
might have oxidized and dissolved after sewage water spreading. 349
Yamamoto et al.22 investigated Zn speciation in pig manure compost and in a soil amended with 350
this compost for 23 years. Their results highlighted that oxidized species present in the compost, 351
i.e. Zn-phosphate and Zn bound to OM, had persisted and accumulated in the amended soil. Our 352
results confirmed that Zn present in OW stockpiled for a long period (>3 months) did not undergo 353
a considerable change in speciation after OW application and was mainly accumulated in the soil 354
surface horizon, despite the highly contrasting properties of both studied soils. 355
After application of fresh OW with a high Zn-sulfide content, the final Zn speciation would be 356
soil dependent as the sulfide would oxidize and release Zn, which in turn would be 357
sorbed/precipitated on the soil matrix.13, 21 Conversely, if the OW had been stockpiled/composted 358
with sufficient phosphate present, then OW-borne Zn-phosphate species accumulate and persist in 359
the amended soil. 360
The results of the present study and the aforementioned studies jointly point towards the same 361
conclusion. Speciation of trace elements in the source, i.e. OW, is the main driver that controls the 362
Zn fate in the soil-plant-water compartments following OW application. Neglecting trace element 363
speciation in the contamination source (OW in this case) hampers gaining further insight into the 364
environmental fate of contaminants in amended soils. 365
Acknowledgements
366
This study was part of the "Negative externalities of land cultivation intensification in periurban 367
areas" project funded by West and Central African Council for Agricultural Research and 368
Development (CORAF/WECARD). The authors wish to thank LMI IESOL for hosting and 369
IMAGO (IRD, Dakar) for laboratory analysis. The authors are grateful to the French Agricultural 370
Research Centre for International Development (CIRAD) for funding the PhD scholarship of 371
Richard Hodomihou. We are grateful to the European Synchrotron Radiation Facility (ESRF) for 372
providing access to the synchrotron radiation facilities. E. Doelsch has received funding from the 373
EU Horizon 2020 Framework Programme for Research and Innovation under the Marie 374
Skodowska-Curie actions agreement N°795614. 375
376
Supporting Information
377Soil, plant, leached water and organic waste sampling procedure, analytical methods and 378
experimental design; X-ray diffraction; Zn K-edge EXAFS spectra and radial distribution function 379
of reference compounds; linear combination fitting results; variations in pH, DOC and Zn in the 380
drained water at the soil column outlets; Comparison of EXAFS spectra and radial distribution 381
function of reference compounds. 382
References
383
1. United Nations, D. o. E. a. S. A., Population Division, World Population Prospects: The 384
2017 Revision. 2017; Vol. Volume I: Comprehensive Tables (ST/ESA/SER.A/399), p 346. 385
2. United Nations, D. o. E. a. S. A., Population Division, World Urbanization Prospects: The 386
2014 Revision. 2014; Vol. Highlights (ST/ESA/SER.A/352), p 27. 387
3. Orsini, F.; Kahane, R.; Nono-Womdim, R.; Gianquinto, G., Urban agriculture in the 388
developing world: a review. Agronomy for Sustainable Development 2013, 33, (4), 695-720. 389
4. De Bon, H.; Parrot, L.; Moustier, P., Sustainable urban agriculture in developing countries. 390
A review. Agronomy for Sustainable Development 2010, 30, (1), 21-32. 391
5. Diallo, F.; Masse, D.; Diarra, K.; Feder, F., Impact of organic fertilisation on lettuce 392
biomass production according to the cultivation duration in tropical soils. Acta Agriculturae 393
Scandinavica, Section B — Soil & Plant Science 2020, 70, (3), 215-223. 394
6. Formentini, T.; Mallmann, F.; Pinheiro, A.; Fernandes, C.; Bender, M.; da, V., M; Dos, S., 395
DR; Doelsch, E., Copper and zinc accumulation and fractionation in a clayey Hapludox soil 396
subjectto long-term pig slurry application. The Science of the total environment 2015, 536, 831-397
839 398
7. Legros, S.; Doelsch, E.; Feder, F.; Moussard, G.; Sansoulet, J.; Gaudet, J. P.; Rigaud, S.; 399
Doelsch, I. B.; Saint Macary, H.; Bottero, J. Y., Fate and behaviour of Cu and Zn from pig slurry 400
spreading in a tropical water-soil-plant system. Agr. Ecosyst. Environ. 2013, 164, 70-79. 401
8. Hodomihou, N. R.; Feder, F.; Masse, D.; Agbossou, K. E.; Amadji, G. L.; Ndour-Badiane, 402
Y.; Doelsch, E., Diagnosis of periurban Dakar (Senegal) agrosystem contamination by trace 403
elements. Biotechnol. Agron. Soc. 2016, 20, (3), 397-407. 404
9. Belon, E.; Boisson, M.; Deportes, I. Z.; Eglin, T. K.; Feix, I.; Bispo, A. O.; Galsomies, L.; 405
Leblond, S.; Guellier, C. R., An inventory of trace elements inputs to French agricultural soils. Sci. 406
Tot. Environ. 2012, 439, 87-95. 407
10. Nicholson, F. A.; Smith, S. R.; Alloway, B. J.; Carlton-Smith, C.; Chambers, B. J., An 408
inventory of heavy metals inputs to agricultural soils in England and Wales. Sci. Tot. Environ. 409
2003, 311, (1-3), 205-219.
410
11. Luo, L.; Ma, Y.; Zhang, S.; Wei, D.; Zhu, Y.-G., An inventory of trace element inputs to 411
agricultural soils in China. J. Environ. Manage. 2009, 90, (8), 2524-2530. 412
12. Working Group Wrb, I., World Reference Base for Soil Resources 2014. International Soil 413
Classification System for Naming Soils and Creating Legends for Soil Maps. 2014. 414
13. Le Bars, M.; Legros, S.; Levard, C.; Chaurand, P.; Tella, M.; Rovezzi, M.; Browne, P.; 415
Rose, J.; Doelsch, E., Drastic Change in Zinc Speciation during Anaerobic Digestion and 416
Composting: Instability of Nanosized Zinc Sulfide. Environ. Sci. Technol. 2018, 52, (22), 12987-417
12996. 418
14. Legros, S.; Doelsch, E.; Masion, A.; Rose, J.; Borshneck, D.; Proux, O.; Hazemann, J. L.; 419
Saint-Macary, H.; Bottero, J. Y., Combining Size Fractionation, Scanning Electron Microscopy, 420
and X-ray Absorption Spectroscopy to Probe Zinc Speciation in Pig Slurry. J. Environ. Qual. 2010, 421
39, (2), 531-540. 422
15. Legros, S.; Levard, C.; Marcato-Romain, C.-E.; Guiresse, M.; Doelsch, E., Anaerobic 423
Digestion Alters Copper and Zinc Speciation. Environ. Sci. Technol. 2017, 51, (18), 10326-10334. 424
16. Donner, E.; Howard, D. L.; de Jonge, M. D.; Paterson, D.; Cheah, M. H.; Naidu, R.; Lombi, 425
E., X-ray Absorption and Micro X-ray Fluorescence Spectroscopy Investigation of Copper and 426
Zinc Speciation in Biosolids. Environ. Sci. Technol. 2011, 45, (17), 7249-7257. 427
17. Donner, E.; Ryan, C. G.; Howard, D. L.; Zarcinas, B.; Scheckel, K. G.; McGrath, S. P.; de 428
Jonge, M. D.; Paterson, D.; Naidu, R.; Lombi, E., A multi-technique investigation of copper and 429
zinc distribution, speciation and potential bioavailability in biosolids. Environ. Pollut. 2012, 166, 430
(0), 57-64. 431
18. Lombi, E.; Donner, E.; Tavakkoli, E.; Turney, T. W.; Naidu, R.; Miller, B. W.; Scheckel, 432
K. G., Fate of Zinc Oxide Nanoparticles during Anaerobic Digestion of Wastewater and Post-433
Treatment Processing of Sewage Sludge. Environ. Sci. Technol. 2012, 46, (16), 9089-9096. 434
19. Mamindy-Pajany, Y.; Sayen, S.; Mosselmans, J. F. W.; Guillon, E., Copper, Nickel and 435
Zinc Speciation in a Biosolid-Amended Soil: pH Adsorption Edge, μ-XRF and μ-XANES 436
Investigations. Environ. Sci. Technol. 2014, 48, (13), 7237-7244. 437
20. Kirpichtchikova, T. A.; Manceau, A.; Spadini, L.; Panfili, F.; Marcus, M. A.; Jacquet, T., 438
Speciation and solubility of heavy metals in contaminated soil using X-ray microfluorescence, 439
EXAFS spectroscopy, chemical extraction, and thermodynamic modeling. Geochim. Cosmochim. 440
Acta 2006, 70, (9), 2163-2190. 441
21. Formentini, T. A.; Legros, S.; Fernandes, C. V. S.; Pinheiro, A.; Le Bars, M.; Levard, C.; 442
Mallmann, F. J. K.; da Veiga, M.; Doelsch, E., Radical change of Zn speciation in pig slurry 443
amended soil: Key role of nano-sized sulfide particles. Environ. Pollut. 2017, 222, 495-503. 444
22. Yamamoto, K.; Hashimoto, Y.; Kang, J.; Kobayashi, K., Speciation of Phosphorus Zinc 445
and Copper in Soil and Water-Dispersible Colloid Affected by a Long-Term Application of Swine 446
Manure Compost. Environ. Sci. Technol. 2018, 52, (22), 13270-13278. 447
23. Inglezakis, V. J.; Zorpas, A. A.; Karagiannidis, A.; Samaras, P.; Voukkali, I.; Sklari, S., 448
EUROPEAN UNION LEGISLATION ON SEWAGE SLUDGE MANAGEMENT. Fresenius 449
Environmental Bulletin 2014, 23, (2A), 635-639. 450
24. Romeo, A.; Vacchina, V.; Legros, S.; Doelsch, E., Zinc fate in animal husbandry systems. 451
Metallomics 2014, 11, (6), 1999-2009. 452
25. Doelsch, E.; Basile-Doelsch, I.; Rose, J.; Masion, A.; Borschneck, D.; Hazemann, J. L.; 453
SaintMacary, H.; Bottero, J. Y., New Combination of EXAFS Spectroscopy and Density 454
Fractionation for the Speciation of Chromium within an Andosol. Environ. Sci. Technol. 2006, 40, 455
(24), 7602-7608. 456
26. Ravel, B.; Newville, M., ATHENA, ARTEMIS, HEPHAESTUS: data analysis for X-ray 457
absorption spectroscopy using IFEFFIT. J. Synchrotron Rad. 2005, 12, (4), 537-541. 458
27. Tella, M.; Bravin, M. N.; Thuriès, L.; Cazevieille, P.; Chevassus-Rosset, C.; Collin, B.; 459
Chaurand, P.; Legros, S.; Doelsch, E., Increased zinc and copper availability in organic waste 460
28. Hammer, D.; Keller, C.; McLaughlin, M. J.; Hamon, R. E., Fixation of metals in soil 463
constituents and potential remobilization by hyperaccumulating and non-hyperaccumulating 464
plants: Results from an isotopic dilution study. Environ. Pollut. 2006, 143, (3), 407-415. 465
29. Jacquat, O.; Voegelin, A.; Villard, A.; Marcus, M. A.; Kretzschmar, R., Formation of Zn-466
rich phyllosilicate, Zn-layered double hydroxide and hydrozincite in contaminated calcareous 467
soils. Geochim. Cosmochim. Acta 2008, 72, (20), 5037-5054. 468
30. Jacquat, O.; Voegelin, A.; Kretzschmar, R., Local coordination of Zn in hydroxy-469
interlayered minerals and implications for Zn retention in soils. Geochim. Cosmochim. Acta 2009, 470
73, (2), 348-363. 471
31. Panfili, F.; Manceau, A.; Sarret, G.; Spadini, L.; Kirpichtchikova, T.; Bert, V.; Laboudigue, 472
A.; Marcus, M. A.; Ahamdach, N.; Libert, M.-F., The effect of phytostabilization on Zn speciation 473
in a dredged contaminated sediment using scanning electron microscopy, X-ray fluorescence, 474
EXAFS spectroscopy, and principal components analysis. Geochim. Cosmochim. Acta 2005, 69, 475
(9), 2265-2284. 476
32. Kelly, R. A.; Andrews, J. C.; DeWitt, J. G., An X-ray absorption spectroscopic 477
investigation of the nature of the zinc complex accumulated in Datura innoxia plant tissue culture. 478
Microchem. J. 2002, 71, (2-3), 231-245. 479
33. González, J. C.; Peariso, K.; Penner-Hahn, J. E.; Matthews, R. G., Cobalamin-Independent 480
Methionine Synthase from Escherichia coli: A Zinc Metalloenzyme. Biochemistry 1996, 35, (38), 481
12228-12234. 482
34. Sarret, G.; Saumitou-Laprade, P.; Bert, V.; Proux, O.; Hazemann, J. L.; Traverse, A. S.; 483
Marcus, M. A.; Manceau, A., Forms of zinc accumulated in the hyperaccumulator Arabidopsis 484
halleri. Plant Physiol. 2002, 130, (4), 1815-1826. 485
35. Doelsch, E.; Masion, A.; Moussard, G.; Chevassus-Rosset, C.; Wojciechowicz, O., Impact 486
of pig slurry and green waste compost application on heavy metal exchangeable fractions in 487
tropical soils. Geoderma. 2010, 155, (3-4), 390-400. 488
36. Feder, F.; Bochu, V.; Findeling, A.; Doelsch, E., Repeated pig manure applications modify 489
nitrate and chloride competition and fluxes in a Nitisol. Sci. Tot. Environ. 2015, 511, 238-248. 490
37. McBride, M.; Sauve, S.; Hendershot, W., Solubility control of Cu, Zn, Cd and Pb in 491
contaminated soils. Eur. J. Soil Sci. 1997, 48, (2), 337-346. 492
38. Karathanasis, A. D.; Johnson, D. M. C.; Matocha, C. J., Biosolid Colloid-Mediated 493
Transport of Copper, Zinc, and Lead in Waste-Amended Soils. J. Environ. Qual. 2005, 34, (4), 494
1153-1164. 495
39. Hernández, T.; Chocano, C.; Moreno, J.-L.; García, C., Use of compost as an alternative 496
to conventional inorganic fertilizers in intensive lettuce (Lactuca sativa L.) crops—Effects on soil 497
and plant. Soil and Tillage Research 2016, 160, 14-22. 498
40. McGrath, S. P.; Chambers, B. J.; Taylor, M. J.; Carlton-Smith, C. H., Biofortification of 499
zinc in wheat grain by the application of sewage sludge. Plant Soil. 2012, 361, (1), 97-108. 500
41. Black, R. E., Zinc Deficiency, Infectious Disease and Mortality in the Developing World. 501
The Journal of Nutrition 2003, 133, (5), 1485S-1489S. 502
42. B., B.; Wedepohl, K. H., Zinc. In Handbook of Geochemistry, Wedepohl, K. H., Ed. 503
Springer-Verlag: Berlin, 1978; Vol. II/3. 504
43. Yamamoto, K.; Hashimoto, Y., Chemical Species of Phosphorus and Zinc in Water-505
Dispersible Colloids from Swine Manure Compost. J. Environ. Qual. 2017, 46, (2), 461-465. 506
507 508
Supporting Information
509
Zinc speciation in organic waste drives its fate in
510
amended soils
511
Nounagnon Richard Hodomihou§, Frédéric Feder§, Samuel Legros§, Thiago Augusto 512
Formentini‡¥, Enzo Lombi, Emmanuel Doelsch†*
513 514
§ CIRAD, UPR Recyclage et risque, 18524 Dakar, Senegal 515
Recyclage et Risque, Univ. Montpellier, CIRAD, Montpellier, France 516
‡ Laboratory of Environmental Engineering, Federal University of Santa Maria (UFSM), 97105-517
900 Santa Maria, RS, Brazil 518
¥ Department of Soil and Environment, Swedish University of Agricultural Sciences, SE-75007
519
Uppsala, Sweden Future Industries Institute, University of South Australia, Adelaide, SA 5095, 520
Australia 521
† CIRAD, UPR Recyclage et risque, F-34398 Montpellier, France 522
524
*Corresponding author. Emmanuel Doelsch, doelsch@cirad.fr 525 526 number of pages 15 527 number of figures 6 528 number of tables 1 529
SI 1 Soil, plant, leached water and organic waste sampling procedure and analytical methods
530
Soils 531
Soils were sampled in the 0-20 and 20-40 cm layers from two sites located in suburban 532
agricultural areas (Pikine and Rufisque market gardening areas located on an Arenosol and a 533
Fluvisol, respectively) of Dakar (Senegal). Only steel or plastic tools were used for sampling in 534
order to avoid trace element contamination of soils. After air-drying and declumping the 535
aggregates, soils samples were sieved through a 2 mm mesh sieve. 536
After organic matter (OM) dissolution and carbonate removal, soil particle size analyses (sand, 537
silt and clay) were conducted using the combined pipette sieving and sedimentation method (NF 538
X 31-107). The total limestone or carbonate content in soil was estimated by the volumetric method 539
(ISO 10693). Total nitrogen (ISO 13878) and total carbon (ISO 10694) were determined by dry 540
combustion with an elemental NC 2100 Soil Analyzer (Thermo Electron Corp.), and organic 541
carbon was determined according to the difference with mineral carbon as calculated from the 542
carbonate content (ISO 10694). Soil and OW pH were determined according to the potentiometric 543
method in the supernatant of the soil–water and OW-water suspension with 1:2 and 1:5 ratios, 544
respectively (ISO 10390). For total P and Zn analyses, sieved soil sub-samples were ground to 100 545
µm particle size in zirconium material before dissolution. After 2 h calcination at 500°C, total 546
dissolution was performed by acid digestion using a mixture of hydrofluoric (HF), nitric (HNO3) 547
and perchloric (HClO4) acids (ISO 14869-1). Total P and Zn concentrations were then determined 548
using inductively coupled plasma mass spectrometry (ICP-MS). Furthermore, two reference 549
standard certified soil samples, i.e. CRM 7001 (light sandy soil) and CRM 7004 (loam), were used 550
to assess the accuracy of the results according to the ISO 9001 certification of the laboratory. The 551
variation coefficient for both of these checks must be less than 5%. 552
At the end of the second cycle, the soil columns were dismantled and seven soil layers were 553
sampled as follows: 0-3, 3-6, 6-10, 10-15, 15-20, 20-30 and 30-40 cm. Soils were air-dried, sieved 554
through a 2 mm mesh sieve, and ground to 100 μm using a planetary grinder made of zirconium 555
oxide to avoid trace element contamination. Zn contents were determined by ICP-MS after 2 h 556
calcination of the soil samples at 500°C, followed by total dissolution using a mixture of 557
hydrofluoric (HF), nitric acid (HNO3) and perchloric acid (HClO4) (ISO 14869-1). Furthermore, 558
two reference standard certified soil samples: CRM 7001 (light sandy soil) and CRM 7004 (loam) 559
were used to assess the accuracy of the results according to the ISO 9001 certification of the 560
laboratory. Deviations from the certified values of these controls were less than 5%. 561
Leached water 562
pH, dissolved organic carbon (DOC) and Zn were analysed in the leached water. For this 563
purpose, weekly leachate samples collected at 40 cm depth (i.e. at the bottom of the soil columns) 564
were filtered using grade GF/D Whatman microfiber filter paper (pore size 2.7 µm) and subdivided 565
in three subsamples. pH was determined in the first leachate subsamples immediately after 566
sampling. The second leachate subsamples were conditioned and acidified with 2.5% ultrapure 567
nitric acid (v/v) in 10 mL scintillation flasks (previously washed with a 10% nitric acid bath and 568
rinsed with ultrapure water), and stored at 4°C. The Zn concentration in acidified leachate 569
subsamples was determined using ICP-MS. The third leachate subsamples conditioned in 20 mL 570
brown amber glass bottles (prewashed in a 10% NaOH bath and rinsed with ultrapure water), were 571
treated with 0.1% sodium azide (NaN3) and stored at 4°C until use. DOC in azide-treated leachate 572
subsamples was determined using a Total Organic Carbon (TOC) Analyzer (Shimadzu, TOC-L) 573
in NPOC mode. Samples were bubbled for 90 s with 1.5% HCl to eliminate carbonates before 574
oven injection (680°C). The DOC measurement quality was checked with the certified reference 575
sample MISSIPPI-03 and the variation coefficient was less than 10%. 576
Plants 577
Freshly harvested leaves of mature lettuce plant samples were rinsed several times with distilled 578
water, cut into small pieces, and oven-dried at 60°C to constant mass. Then these samples were 579
ground into powder separately through a grinder made of zirconium oxide (bowls and balls) in 580
order to avoid trace element contamination. Total digestion of ground lettuce samples consisted of 581
introducing 1 g of each ground lettuce sample into a platinum crucible which was subsequently 582
placed in a muffle furnace for 2 h calcination at 500°C. After cooling, the ash was moistened with 583
a few drops of ultrapure water, and 2 mL of 6N HCl was added. Dry evaporation was then carried 584
out on a warming plate. Hydrofluoric acid was added to the ash residue and then evaporated again 585
on a warming plate. The silica contained in the ash thus volatilized as SiF6. The ash residue was 586
taken up in 2 mL of 6N HCl and filtered through Whatman No.42 filter paper into a 50 mL vial. 587
The filter containing the residue was placed in the same crucible and then calcined at 500°C. 588
Finally, the crucible was rinsed with 1 mL of 6N HCl, and then with ultrapure water (18.2 MΩ.cm) 589
from a Millipore Milli-Q system, and transferred to the same vial. The vial was gauged and then 590
homogenized by manual stirring. Furthermore, three strawberry plant samples (Fragaria vesca) 591
with internal references were also analyzed for verification and validation of the results. Deviations 592
from the certified values of these controls were always less than 5%. All reagents used were Merck 593
analytical grade (AR). The Zn concentration in digestates was determined by inductively coupled 594
plasma mass spectrometry (ICP-MS, Varian Ultramass). 595
Organic wastes 596
Sewage sludge (SS) was sampled at the Pikine municipal wastewater treatment plant. This 597
lagoon-type plant is run on the basis of biological processes with free culture in basins and 598
produces 1905 t of activated sludge per year. SS are sun dried in a refining tank. 599
Poultry manure (PM) from laying hens was sampled in a henhouse at Rufisque. The manure is 600
mixed with litter (sawdust or rice husking waste) used as a henhouse substrate. 601
Both SS and PM had been stockpiled for long periods prior to being spread on the soil columns 602
(>3 months), which is consistent with market gardeners’ practices. 603
Organic waste was dried at 40°C then ground with a grinder made of zirconium oxide (bowls 604
and balls) in order to avoid trace element contamination, and then ground and sieved through a 1 605
mm mesh sieve. The characteristics of these OW soils were obtained using standard soil analysis 606
methods. 607
608 609
SI 2 X-ray diffraction
610
X-ray diffractograms of the soils were obtained with a Philips PW 3710 X-ray diffractometer 611
using CoK radiation at 40 kV and 40 mA (a counting time of 12 s per 0.02° step was used for the 612 2 h range 5–75°) 613 a 614 b 615
Figure SI-2: X-ray diffractograms for (a) Arenosol and (b) Fluvisol 616
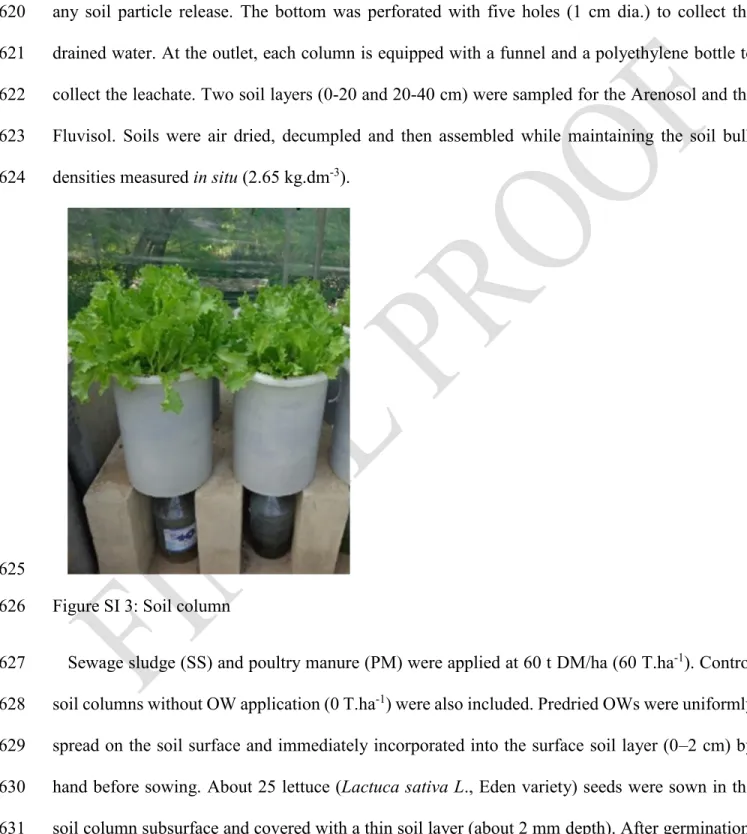
SI 3 Experimental design
617
The soil columns were composed of cylindrical polyethylene columns (50 cm h; 33 cm dia.). 618
The bottom of each column was covered by a nylon membrane (Nitex, 50 μm mesh) to prevent 619
any soil particle release. The bottom was perforated with five holes (1 cm dia.) to collect the 620
drained water. At the outlet, each column is equipped with a funnel and a polyethylene bottle to 621
collect the leachate. Two soil layers (0-20 and 20-40 cm) were sampled for the Arenosol and the 622
Fluvisol. Soils were air dried, decumpled and then assembled while maintaining the soil bulk 623
densities measured in situ (2.65 kg.dm-3). 624
625
Figure SI 3: Soil column 626
Sewage sludge (SS) and poultry manure (PM) were applied at 60 t DM/ha (60 T.ha-1). Control 627
soil columns without OW application (0 T.ha-1) were also included. Predried OWs were uniformly 628
spread on the soil surface and immediately incorporated into the surface soil layer (0–2 cm) by 629
hand before sowing. About 25 lettuce (Lactuca sativa L., Eden variety) seeds were sown in the 630
at the 3 to 4 leaf stage, the seedlings were thinned in order to leave a dozen vigorous lettuce plants 632
per column. Lettuces (Lactuca sativa L.) were cultivated 1 week after OW application. Each 633
lettuce crop cycle lasted 5 weeks. 634
The pore volume (PV) of each soil column was calculated using the equation reported by Feder 635
et al. (2015)36: 636
[Pore volume] = Porosity × Volume of the soil column. 637
with Porosity = 1 – 𝐴𝐷 𝑅𝐷 638
where AD (kg.dm-3) corresponds to the apparent density or bulk density measured for each soil 639
in situ, and RD corresponds to the real particle density (expressed in kg.dm-3) estimated at 2.65 kg 640
.dm-3 for both soils. 641
Each column received 8 L of water weekly, corresponding to 0.6 PV for the Arenosol columns 642
and 0.5 PV for the Fluvisol columns. Water (4 L) was applied on fixed days (Monday and 643
Thursday). 24 h after each water supply, the leachates drained and collected at the column outlets 644
were sampled. On a weekly basis, the two leachate samples from the same soil column were 645
combined and stored before analysis. 646
At the end of the lettuce crop cycle, only the above-ground parts (leaves) of the plants were 647
harvested. The plants were cut, then washed three times successively with tap water, and rinsed 648
twice with distilled and ultra-pure water. The lettuces were dried in an oven at 60°C to constant 649
weight and the dry biomass was weighed to determine the lettuce yields. 650
After the first lettuce harvest, the whole experiment (OW application, lettuce crop, water 651
irrigation and sampling) was repeated a second time. 652
Three replicates were performed for each treatment (a treatment is defined as a soil and an OW) 653
representing a total of 18 soil columns. 654
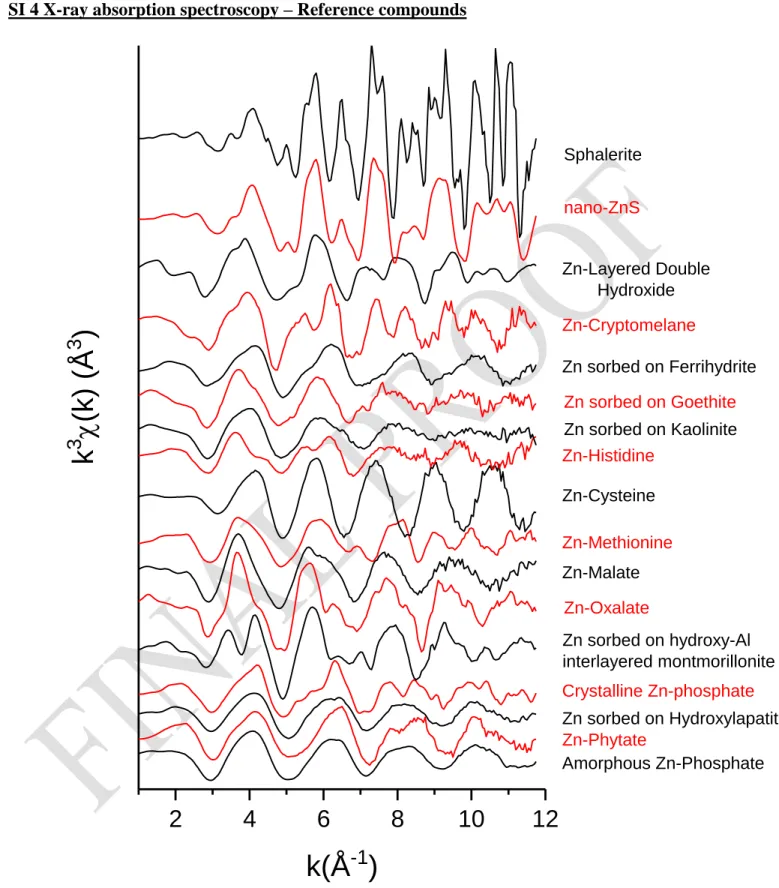
SI 4 X-ray absorption spectroscopy – Reference compounds
655
656
Figure SI 4a: Zn K-edge extended X-ray absorption fine-structure spectroscopy spectra of all 657
2
4
6
8
10
12
Amorphous Zn-Phosphate Zn-Phytate Zn sorbed on Hydroxylapatite Crystalline Zn-phosphate Zn sorbed on hydroxy-Al interlayered montmorillonite Zn-Oxalate Zn-Malate Zn-Methionine Zn-Cysteine Zn-Histidine Zn sorbed on Kaolinite Zn sorbed on Goethite Zn sorbed on Ferrihydrite Zn-Cryptomelane Zn-Layered Double Hydroxide nano-ZnSk
3
(k)
(Å
3
)
k(Å
-1
)
Sphalerite659
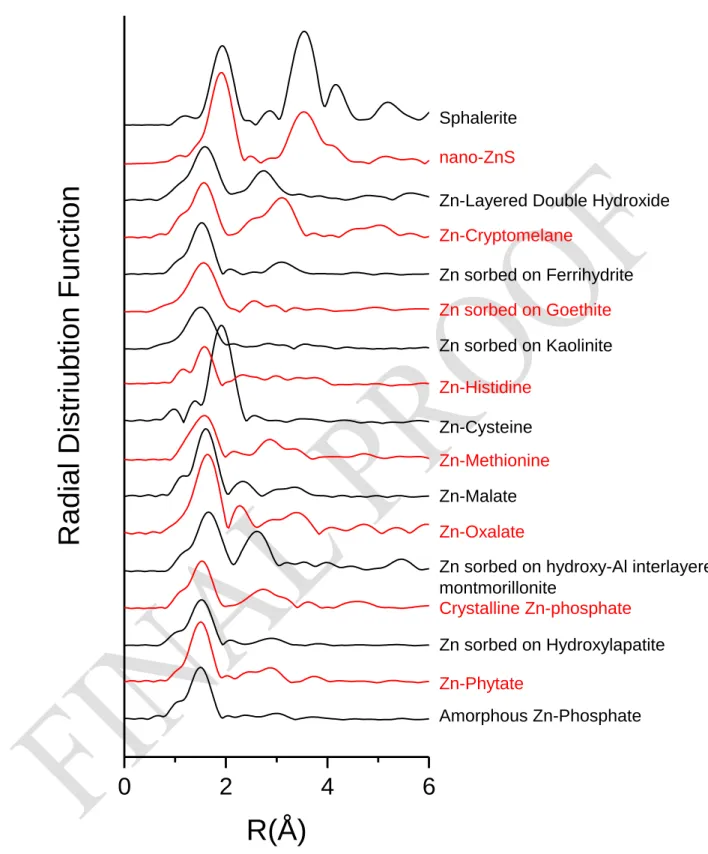
Figure SI 4b: Radial distribution function (window Kaiser-Bessel, dk=2) of all reference 660 compounds. 661
0
2
4
6
Amorphous Zn-Phosphate Zn-Phytate Zn sorbed on Hydroxylapatite Crystalline Zn-phosphateZn sorbed on hydroxy-Al interlayered montmorillonite Zn-Oxalate Zn-Malate Zn-Methionine Zn-Cysteine Zn-Histidine Zn sorbed on Kaolinite Zn sorbed on Goethite Zn sorbed on Ferrihydrite Zn-Cryptomelane
Zn-Layered Double Hydroxide
nano-ZnS
Radia
l Distriub
tion
F
un
ction
R(Å)
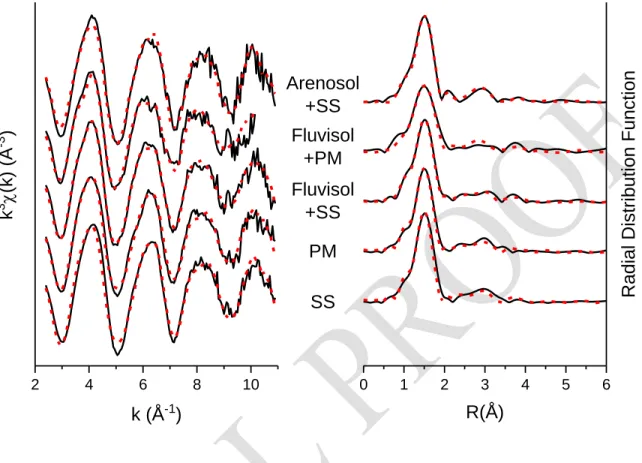
SphaleriteSI 5 X-ray absorption spectroscopy – linear combination fitting
662
663
Figure SI 5: Experimental (black) and modeled (dotted, red) Zn K-edge extended X-ray absorption 664
fine-structure spectroscopy spectra and radial distribution function (window Kaiser-Bessel, dk=2) 665
for each sample of OW and soil + OW. SS= sewage sludge, PM=poultry manure 666 667 2 4 6 8 10 0 1 2 3 4 5 6 Fluvisol +PM Fluvisol +SS k 3 (k) (Å -3 ) k (Å-1) SS PM Arenosol +SS Radia l Distribu tion F un ction R(Å)
Table SI 5: Detailed linear combination fitting results. SS = sewage sludge, PM = poultry manure 668 Amorphous Zn-phosphate Zn-phytate Cristalline Zn-phosphate Zn sorbed on hydroxylapatite Zn sorbed on hydroxy-Al interlayered montmorillonite R-factor* Arenosol + SS 14% 97% 0.050 Fluvisol + PM 75% 14% 0.063 Fluvisol + SS 91% 10% 0.029 PM 96 % 10% 0.030 SS 86 % 15 % 0.037 *R-factor = Σ(𝑘3𝜒(𝑘) 𝑒𝑥𝑝− 𝑘3𝜒(𝑘)𝑓𝑖𝑡)2/Σ(𝑘3𝜒(𝑘)𝑒𝑥𝑝)2 669 670 671
SI 6 variations in pH, DOC and Zn in the drained water at the soil column outlets.
672
673
Figure SI 6: Variations in pH, DOC and Zn concentrations in drained water at the outlet of the (a) 674
Arenosol columns and (b) Fluvisol columns. Arrows represent the OW applications. PM: Poultry 675
SI 7 Zn concentration as a function of the dissolved organic carbon concentration in drained
677
water at the soil column outlets.
678 679
680 681
Figure SI 7: Zn concentration as a function of dissolved organic carbon in drained water at the 682
column outlets of the Arenosol (a) and Fluvisol (b). R corresponds to the Pearson linear correlation 683
coefficient; NS = not significant; Significance level: * = p <0.05, and *** = p <0.0001. 684
SI 8 X-ray absorption spectroscopy – comparison of reference compounds.
686
The EXAFS spectra of Zn sorbed on hydroxyapatite, amorphous Zn phosphate and Zn sorbed on 687
Ferrihydite look very similar, although some minor features can be observed. But, these distinct 688
features are much easier to detect on the radial distribution function. The radial distribution 689
function obtained from Fourier transforming the reduced EXAFS data consists of different peaks 690
resulting from Zn-backscatter interactions. The peaks between 2 and 4 Å indicate the presence of 691
atoms in the next-nearest shells around Zn. For amorphous Zn phosphate, Zn sorbed on 692
hydroxylapatite and Zn sorbed on Ferrihydrite, the radial distances of these peaks are different (see 693
arrows), thus indicating a modification of the local Zn environment for these three references. 694
696
Figure SI 8: Zn K-edge extended X-ray absorption fine-structure spectroscopy spectra and radial 697
distribution function (window Kaiser-Bessel, dk=2) for amorphous Zn phosphate, Zn sorbed on 698
hydroxylapatite and Zn sorbed on Ferrihydrite. 699