HAL Id: halshs-00727628
https://halshs.archives-ouvertes.fr/halshs-00727628
Submitted on 4 Sep 2012HAL is a multi-disciplinary open access archive for the deposit and dissemination of sci-entific research documents, whether they are pub-lished or not. The documents may come from teaching and research institutions in France or abroad, or from public or private research centers.
L’archive ouverte pluridisciplinaire HAL, est destinée au dépôt et à la diffusion de documents scientifiques de niveau recherche, publiés ou non, émanant des établissements d’enseignement et de recherche français ou étrangers, des laboratoires publics ou privés.
The Economics of Structural Change in Knowledge
Francesco Quatraro
To cite this version:
Francesco Quatraro. The Economics of Structural Change in Knowledge. Routledge, pp.1-224, 2010. �halshs-00727628�
The Economics of
Structural Change in
Knowledge
byFRANCESCO QUATRARO
GREDEGCNRS and University of Nice Sophia Antipolis 250 rue Albert Einstein
06560 Valbonne, France francesco.quatraro@unice.fr
2
Table of Contents
PART I - OVERVIEW
Chapter 1 - Structural change and the knowledge-base economy: An international overview. ... 8
1.1 Introduction ... 8
1.2 On the different meanings of structural change. ... 9
1.3 The timeliness of the analysis of structural change in modern economies ... 11
1.4 The role of ICTs in the recent dynamics of structural change ... 15
1.5 The emergence of the knowledge-based economy ... 19
1.6 Conclusions ... 23
PART II - THE THEORY Chapter 2 - Structural change and the long run dynamics of economic growth. ... 36
2.1 Introduction ... 36
2.2 The origins of the analysis of structural change in economics ... 36
2.3 The analysis of structural change in the 1930s: the three-sector hypothesis... 42
2.4 Implications: structural change and convergence. ... 44
2.5 An overview of the different analytical approaches ... 46
2.6 The missing link with innovation and technological change ... 49
2.7 Conclusions ... 52
Chapter 3 - The Economics of Technological Knowledge ... 54
3.1 Introduction ... 54
3.2 Knowledge as an Economic Good ... 55
3.3 Modes of Knowledge Production and Analytical Representations ... 59
3.3.1 Knowledge as public good, the linear model and the extended production function ... 59
3.3.2 Knowledge as a proprietary good, knowledge interactions and the knowledge production function 61 3.4 Recombinant growth and complex knowledge ... 63
3.5 Conclusions ... 66
Chapter 4 - Structural change and knowledge structure: an integrated framework ... 68
4.1 Introduction ... 68
4.2 Collective knowledge and interactive dynamics ... 69
4.3 A structuralist approach ... 72
4.4 Complexity and economics of innovation ... 75
3
4.6 Conclusions ... 86
PART III - APPLICATIONS Chapter 5 - The implementation of knowledge structure: methodological implications. ... 90
5.1 Introduction ... 90
5.2 The use of co-occurrence matrixes: coherence, cognitive and variety. ... 91
5.2.1 An overview upon calculations ... 92
5.3 Social Network Analysys ... 97
5.4 Conclusions ... 100
Chapter 6 - The internal structure of technological knowledge and productivity growth: cross-country evidence from the ICT sector. ... 101
6.1 Introduction ... 101
6.2 Research Strategy ... 103
6.3 The Data... 107
6.4 Cross-country dynamics of ICT knowledge base: the empirical evidence ... 109
6.5 Econometric results ... 112
6.6 Conclusions ... 115
Chapter 7 - Evolutionary patterns of knowledge structure in biotechnology. ... 131
7.1 Introduction ... 131
7.2 Knowledge networks ... 133
7.3 Data and Methodology ... 139
7.3.1 Measurement of the Knowledge Base ... 139
7.4 Empirical results ... 141
7.4.1 Using co-occurences matrixes ... 141
7.4.2 The implementation of SNA: Networks and Knowledge Structure ... 145
7.5 Graphical analysis of networks: the web of knowledge ... 150
7.6 Discussion and Conclusions ... 153
Chapter 8 - Knowledge, structural change and productivity: a special focus on Italian regions. ... 168
8.1 Introduction ... 168
The Model ... 170
Methodology ... 174
Panel Data and Spatial Dependence ... 176
The Data ... 178
Empirical Results... 179
Discussion ... 182
4
Chapter 9 - The co-evolution of knowledge and economic structure: Evidence from European Regions. 197
9.1 Introduction ... 197
9.2 A model for knowledge and economic structure: The shift-share analysis. ... 198
9.3 Empirical approach ... 201
9.3.1 The Data ... 203
9.4 Econometric results ... 205
9.5 Conclusions ... 207
5
List of Figures
Figure 1.1 – The evolution of manufacturing share of employment across Europe, US, Japan and Korea. ... 25
Figure 1.2 – The evolution of manufacturing share of employment across Germany, France, Italy and Spain. ... 26
Figure 1.3 – The evolution of manufacturing share of employment across UK, Sweden, Finland and Denmark. ... 27
Figure 1.4 – Evolution of value added share across EU-15, USA, Japan and Korea ... 28
Figure 1.5 – Evolution of value added share across Germany, France, Italy and Spain ... 29
Figure 1.6 – Evolution of value added share across UK, Sweden, Finland and Denmark ... 30
Figure 1.7 – Contribution of ICTs to value added growth ... 31
Figure 1.8 – Dynamics of patents per 1000 employees ... 33
Figure 1.9 – Share of ICTs patents on total applications ... 34
Figure 2.1 - Feedbacks among Innovation, Structural Change and Economic Growth ... 53
Figure 4.1 – Simplified scheme of dynamic interactions in complex socio-economic systems ... 87
Figure 4.2 – Zoom in the dynamic interactions between the knowledge and the innovation systems ... 88
Figure 6.1 - Patent applications in the ICT sector, 4 years cumulative count ... 119
Figure 6.2 - Dynamics of patent applications in the core ICT technological classes ... 120
Figure 7.1- Dynamics of patent applications and technological classes in biotechnology ... 161
Figure 7.2 – Matrix of co-occurrences in the biotechnology sector... 162
Figure 7.3 - Properties of knowledge base of biotechnology ... 163
Figure 7.4 - Dynamics of network density for biotechnology ... 164
Figure 7.5 - Average centrality measures ... 165
Figure 7.6 - Network of technology classes for biotechnology, 4 sub-periods ... 166
Figure 8.1 – Cross-regional distribution of TFP and Knowledge Coherence ... 196
Figure 9.1 – Distribution of the 9 relevant variables describing knowledge and economic structure. ... 209
Figure 9.2 – Distribution of the three components of shift-share decomposition ... 210
Figure 9.3 – Distribution of the properties of knowledge structure (I) ... 211
6
List of Tables
Table 1.1 – Share of GDP invested in ICTs (%) ... 32
Table 6.1 - IPC classes used to define the ICT sector... 121
Table 6.2 - Cross country distribution of patent applications ... 122
Table 6.3 - Country breakdown of patent applications in the ICT sector (4 years cumulated), by year. ... 123
Table 6.4 – Country breakdown of Revealed technology advantage in the ICT sector ... 124
Table 6.5 – Country Breakdown of Variety (information entropy) in the ICT sector ... 125
Table 6.6 – Country Breakdown of Related variety (within-group information entropy) in the ICT sector . 126 Table 6.7 – Country Breakdown of Unrelated variety (between-group information entropy) in the ICT sector ... 127
Table 6.8 – Country Breakdown of Knowledge coherence in the ICT sector ... 128
Table 6.9 – Econometric estimation of Equation (6.5) ... 129
Table 6.10 - Econometric estimation of Equation (6.5) ... 130
Table 7.1 - Definition of the biotechnology sector using IPC classes ... 157
Table 7.2 - Dynamics of normalized degree centrality, top 10 technological classes ... 158
Table 7.3 - Dynamics of closeness centrality, top 10 technological classes ... 159
Table 7.4 - Dynamics of betweenness centrality, top 10 technological classes ... 160
Table 8.1 - Descriptive Statistics ... 191
Table 8.2 - Regional Decomposition of Variables (1981-2002) ... 192
Table 8.3 - Panel Data Estimates of Equation (9.12) ... 193
Table 8.4 - Results for the Estimation of Equation (9.14) (Spatial Autoregressive Model) ... 194
Table 8.5 - Results for the Estimation of Equation (9.15) (Spatial Error Model) ... 195
Table 9.1 – Descriptive statistics of the 9 variables before normalization ... 213
7
8
Chapter 1 -
Structural change and the knowledge-base economy: An
international overview.
1.1
Introduction
The economies of advanced capitalistic countries have been experiencing a process of dramatic reshaping of their structure for some decades. To be fair, such process of structural change has constantly interested economic systems, as it manifested itself formerly as the shift from agriculture to non-agriculture activities, and subsequently as movement from manufacturing sectors to service activities. In other words, structural change is an inherent characteristics of capitalistic economies, and it is both a cause and a determinant of restless economic growth (Metcalfe, 2002). While this phenomenon has largely attracted the attention of leading economists in the past, there is scarce attention today to the economic analysis of structural change and to its relationships with other key dynamics like technological change and economic development.
This chapter aims at providing evidence of the empirical relevance of structural change in the present economic conditions. While by structural change one can mean different things, our descriptive effort will be based on the most traditional usage of the term, which refers to the change in the sectoral composition of modern economies. We will than provide empirical evidence of the links between the way structural change actually takes places in advanced countries, i.e. the increasing weight of service activities; the dynamics of technological change, with particular respect to the creation, diffusion and exploitation of information and communication technologies (ICTs); and the increasing centrality of knowledge exchanges within production processes. The emerging picture will represent a sort of empirical context to frame the analysis conducted in the rest of the book, which aims at extending the application of a structuralist approach to the analysis of technological knowledge and of the networks of knowledge generating agents, by showing that these are strictly intertwined and that they are tied by a set of recursive feedbacks and loops such that they can be effectively accommodated by using the heuristic tools of complexity theory.
This chapter is organized as follows. The next section will provide a synthetic overview on the different theoretical contexts within which the term “structural change” is actually used in the field of economics. Section 1.3 will discuss data on the evolution of value
9
added and employment share in manufacturing and service activities across advanced countries, so as to show the topicality of the analysis of structural change. In section 1.4 we stress how the transition towards service based economies made it possible a change in the technological paradigm leading to the creation and diffusion of ICTs. A mutually enforcing dynamics between structural change and technological can be devised in this respect. Section 1.5 put forth some key implications of structural change and ICTs diffusion, i.e. the increasing relevance of knowledge utilization for production purposes. Data on knowledge production will show how faster rates of growth can be observed in correspondence of relatively higher shares of service activities with respect to manufacturing ones. Section 1.6 will draw some preliminary conclusions, by emphasizing the need to rejuvenate the study of structural change by extending its domain of application and integrating perspectives on different parts of economic activities.
1.2
On the different meanings of structural change.
The term “structural change” is far from having a univocal meaning in the field of economics. For example, in econometric theory, the issue of structural change refers to the behavior of the parameters of a model in the course of time. The usual assumption of stationarity is commonly made, according to which one or all of the relevant parameters of the econometric model are constant over time. However, structural breaks can occur, such that one of these parameters changes at some time in the sampled period. The econometrics of structural change allows to identifying structural breaks in time series by providing a rich set of tests (Hansen, 2001).
On a different ground, the concept of economic structure plays an important role in the field of industrial organization, with particular respect to the structure-conduct-performance paradigm. In this approach, the economic performance of an industry is a function of the behavior of buyers and sellers which, in turn, is a function of the industry’s structure (Bain, 1956). Industry structure includes here some variables like the number and size of economic agents, the technology, the barriers to entry, the extent of vertical integration and the degree of product differentiation (Scherer, 1980; McWilliams and Smart, 1993).
Within the localized technological change approach the term structural change is used to indicate changes in relative prices of production factors. The change in relative factors, in
10
contexts characterized by high irreversibility and bounded rationality is likely to engender a reaction in economic agents that confronted with two alternatives, i.e. either adapt or innovate. Both of these alternatives imply some costs for economic agents, i.e. switching costs or innovation costs. When switching costs are relatively higher due to irreversibility of previous production choices, innovating may turn out to be a better solution. The introduction of technological change appears therefore as an outcome of pressures coming from the changing conditions of factor markets, and it is directed towards the increasing exploitation of the production factor which has become cheaper. These dynamics in turn are likely to introduce further alterations of the economic structure, engendering further innovation efforts (Antonelli, 2003).
However, in a more traditional perspective the notion of structural change is related to changes in the patterns of sectoral composition of countries and regions over the process of economic development. The pillars of this line of enquiry are usually found in the seminal works by Simon Kuznets (1930) and Arthur Burns (1934). Their works provide indeed a former and impressive empirical evidence concerning the rise, the growth and the fall of industrial sectors and the linked shift in the main sources of industrial leadership in different countries. The economic development of countries and regions is in this perspective strictly tied to the performance of their leading industries, and the ability to maintain an enduring competitive advantage is strongly influenced by the ability to foster the establishment of industries in the growing phase of their development.
A much overlooked influence on this strand of analysis comes from the somewhat less celebrated work Industry and Trade by Alfred Marshall (1919). In such book the key factors underlying the trade between nations are analyzed, by emphasizing the cyclical behavior of industry performances and the evident relationships between a country’s industrial specialization and its economic leadership. The rise and the fall of British economic power are analyzed in this perspective, and contrasted with the emergence of German and French industrial leadership. Marshall also emphasized the importance of production techniques in shaping a country’s competitive advantage, as well as the availability of innovative inputs to the production process. Moreover, he stressed throughout the book that the considerations about the dynamics of industry and trade among countries can be very easily adapted to the analysis of economic interactions among regions or even smaller territorial units. In this sense, he provided a much wider toolkit to understand secular changes within economic systems, by anticipating not only Kuznets’ and Burns’ speculations, but also touching some
11
key issues that would have been further developed by Joseph Schumpeter (1939 and 1942) and François Perroux (1954).
In this book we will move by focusing on the process of structural change as conceived in this last and most influential strand of analysis. Although the origins of this approach date back to about a century ago, we will show in the next section the relevance of investigations in this field in the present economic conditions, and maintain in the rest of the chapter that the cross-fertilization with economics of knowledge is necessary in a context shaped by the transition towards the knowledge-based economy.
1.3
The timeliness of the analysis of structural change in modern
economies
The effects of structural change on the process of economic development have recently received renewed attention. On the one hand, some studies dealt with structural change by focusing on the consequences of both the changing specialization of national economies in favour of “hi-tech” activities, and the gap with countries specialized in “low-tech” activities (Fagerberg, 1994 and 2000). On the other hand, some authors investigated the effects of structural change on the returns to R&D activity and on the tendency of the rate of profit to fall (Frantzen, 2000; Wolff, 2003; Quatraro, 2009a).
The topicality of structural change is well reflected in the data on the changing distribution of employees across industries in the different advanced countries. While in the 1970s much of the attention of economists was given to the shift of employment from agriculture to manufacturing activities, in the most recent years a gradual shift from manufacturing to service sectors has begun to characterize the dynamics of advanced capitalistic economies.
The data reported in Figure 1.1 provide an impressive sketch of such a process. The share of employees in four sectors, i.e. manufacturing, financial intermediation, transport and storage and communication, real estate and renting and business activities, have been calculated on the basis of data supplied by the Groningen Growth and Development Centre1. The diagram compares the four main economies. The evidence about the EU-15 aggregate
1
12
and the US looks very similar. Even if we miss US data for the first half of the 1970s, we can notice that for the both of them the share of employees in manufacturing falls over the whole observed period. However, in the late 1990s the rate of fall in the US becomes slightly faster than the EU-15 so that at the end of the observed period, i.e. in 2007 the share is about 13% in the US and 16% in the EU-15. The dynamics of Japan slightly drift from such observed trend. While in Japan the initial share of manufacturing employees was at about 33%, like in the EU, we observe a steep decrease up to 1975, and then a prevalent stationary dynamics around some 27% share just until 1990. Then we observe a modest decrease until 2000, such that the share never falls below 20%. Interestingly enough, since 2001 the manufacturing employment share started increasing, though at a pretty slow rate. A very different situation can be observed in the case of Korea. In the early 1970s such employment share was just below the 25% but it started immediately to increase at a very fast rate until 1976, so that it arrived at 40% in 5 years. Then it remained rather stable until 1988, when it started to decrease so as to arrive at about 21% in 2007. It would seem as if Korea had gone through the two different aggregate phases of strengthening and subsequent decrease of manufacturing activities in a relatively very short time span.
>>> INSERT Figure 1.1 ABOUT HERE <<<
We can reasonably conclude by now that a process of gradual decrease in the weight of manufacturing activities is ongoing in the four key observed economies. It is as much reasonable wondering where employees outgoing from manufacturing sectors are directed. Figure 1.1 shows the existence of interesting dynamics concerning the sector gathering real estate, renting and business activities. The most relevant evidence is related to the US. Indeed one can observe that the employment share in such service activities is continuously increasing over time at a pace such that in 2004 they outperformed manufacturing activities and got to some 17% share on total employment. The US evidence is then very informative and it can be considered as archetypical of the much debated transition process to the service economy which, after all, is exactly the effect of a dynamics of structural change. The EU-15 performance is not comparable in terms of magnitude, although it has followed the same trend. The share of private business services indeed began to grow in the early 1980s, while in the 1970s in the US it was already increasing, but it remained well below the manufacturing over the observed time span, so that in 2007 it was at about 14%. The Japanese evidence looks very interesting in this respect. Indeed, although the employment manufacturing share therein remained around 20% in the 2000s, the real estate, renting and business activities grew
13
so much that in 2007 they also approached the 20% share, which is far above the US and the European evidence. Therefore, Japan seemed to have caught up and actually outperformed both US and Europe in this respect.
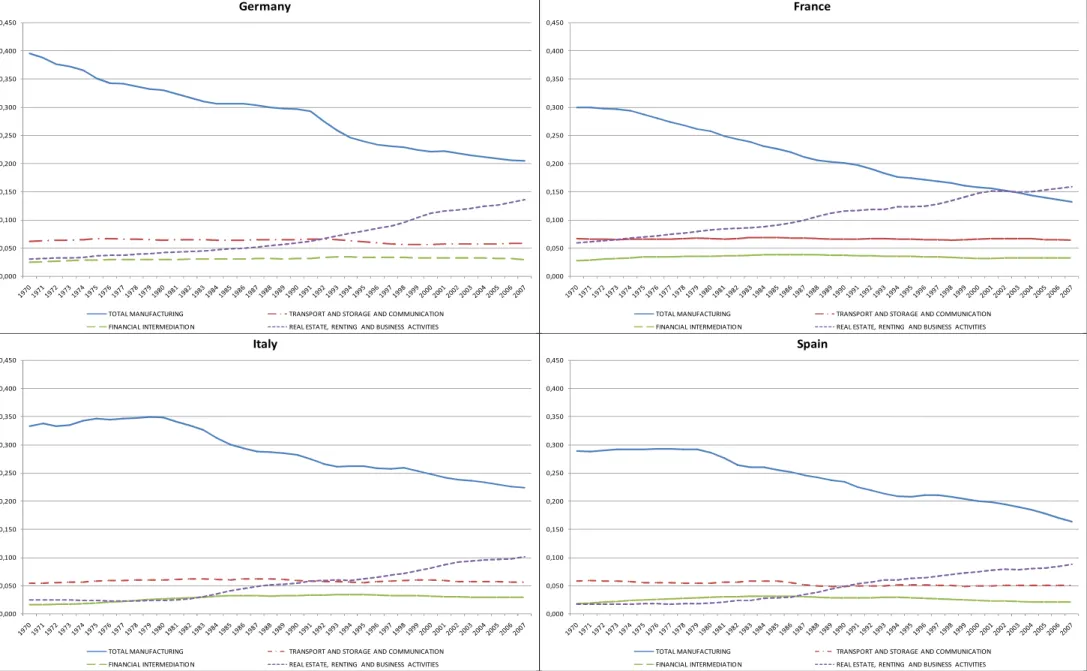
It can be useful now to look at within-Europe differences in terms of evolutionary patterns of employment in manufacturing and service sectors. Figure 1.2 shows the evidence concerning Germany, France, Italy and Spain, which may be taken as representative of most advanced continental European countries. As expected, the country showing the highest share of manufacturing employment in the 1970s is Germany (about 40%), followed by Italy (about 35%) and then Spain and France on similar values (about 30%). The differential dynamics are very interesting. The country that appeared to have pursued the most the transition from manufacturing to service based economy is France. The manufacturing employment share fell from 30% in 1970 to 14% in 2007, while real estate, renting and business activities arrived at about 16%. The French evidence resembles very much the US one. The German evidence is also characterized by a marked decrease of manufacturing share, which in 2007 was half the value of 1970, like in France. The same also applies to Spain. In Italy the situation is slightly different, as the decreasing trend emerged relatively late. On the contrary, in the first half of the Seventies the manufacturing share showed a slight increase and then it remained stable up to the end of the decade. One can observe a fall in the manufacturing share of employment in Italy only in the early 1980s, and anyway at a rate such that in 2007 was at about 23%, i.e. even higher than the German situation. This suggests a relative delay of Italy with respect to the other advanced European countries.
>>> INSERT Figure 1.2 ABOUT HERE <<<
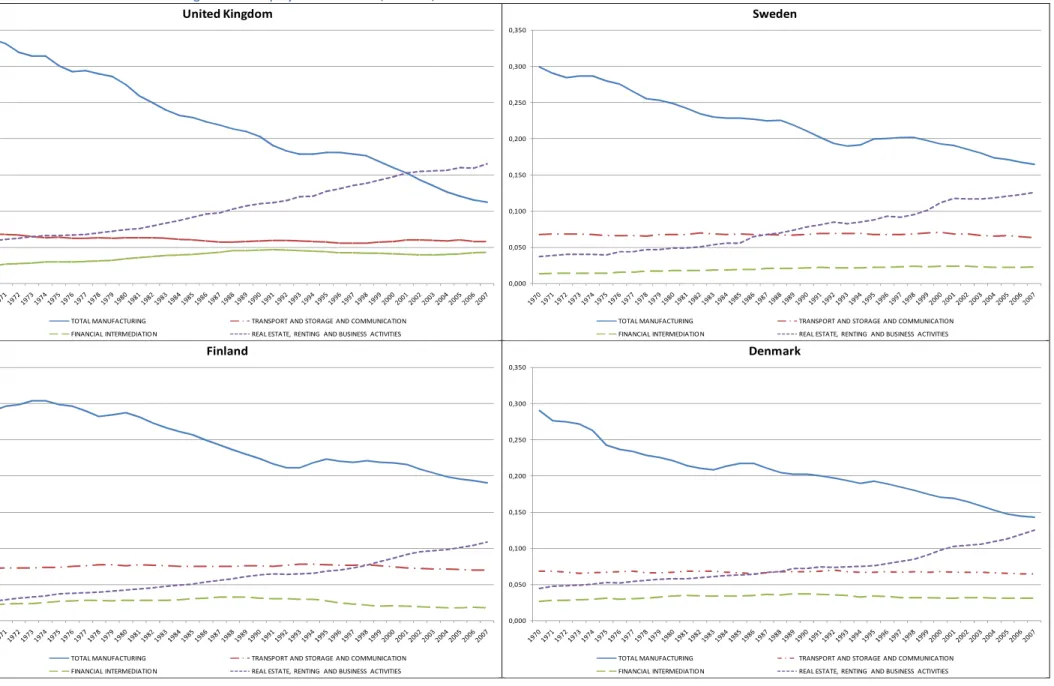
Figure 1.3 provides the evidence concerning some North-European countries like UK, Sweden, Denmark and Finland. That of UK is the most evident European case of transition towards a service-based economy. The share of manufacturing employment falls constantly over the observed period from about 35% in 1970 to about 10% in 2007, i.e. of about 71%, with an average annual growth rate of -1.8%. On the contrary, the share of real estate, renting and business shows en enduring increase, which is much more marked along the whole 1980s. Interestingly enough, also the financial intermediation sector is characterized by a significant growth, at the turning between the 1970s and the 1980s. The three remaining countries share a common dynamics of manufacturing employment share, which is at about 30% in 1970 and constantly falls along the observed period. Such share remains however well above the 15%
14
in the case of Sweden and Finland in 2007, while it arrives at about 14% in Denmark. For what concerns the dynamics of service sectors, and in particular of the real estate, renting and business activities, we can observe a common increasing trend, although at evidently different rates. In Sweden the service employment share increases at a pace that experiences a marked acceleration in the second half of the 1980s, while Denmark experienced such a boost at the end of the 1990s and the beginning of 2000s. The situation is a bit different in Finland, where the increase of service sectors is relatively smooth.
>>> INSERT Figure 1.3 ABOUT HERE <<<
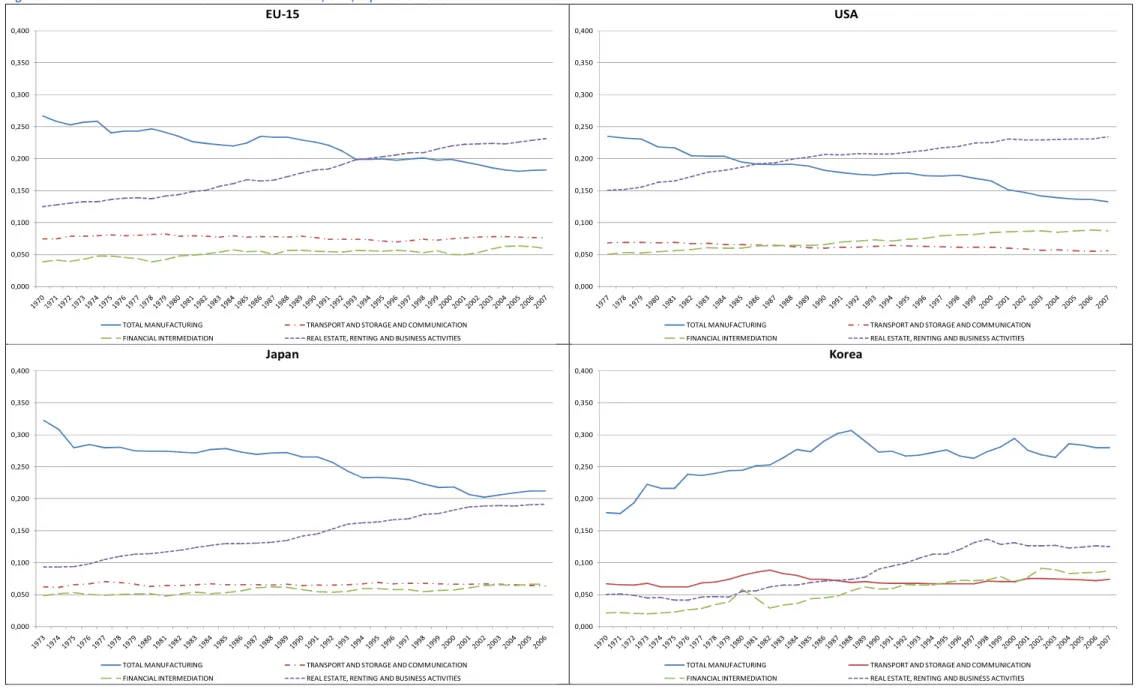
The gradual shift from a manufacturing-centric to a service-based economy does not involve the only reallocation of employees across industries, which is a somewhat long-lasting process, but also and mainly a change in the locus of value creation. Figure 1.4 shows the evolution of value added share in the four sectors across the EU-15, USA, Japan and Korea. The data about the value added share are of course in line with the evidence concerning the evolution of employment share. However, we can notice how the dynamics of value added seems to anticipate that of employment. In the case of US, for example, the value added share of real estate, renting and business activities overtake that of manufacturing sectors already in 1986, while the same occurs in the employment share only in 2004. The same evidence can also be observed in the case of EU-15 countries. The value added share of private business services overtakes that of manufacturing in the early 1990s, while there is no evidence yet of such overtaking for what concerns the employment data. We could reasonably expect to observe it in a few years.
>>> INSERT Figure 1.4 ABOUT HERE <<<
If we move to continental European countries (Figure 1.5), the impression of a lag between value added and employment dynamics receives further support. The reallocation of employment across sectors is likely to follow the reallocation of value added. This is fairly evident in the case of France, where we can see that the intersection between manufacturing and private business sectors occurs in 1986 for what concerns value added and in 2002 for what concerns employment. In the case of Germany, Italy and Spain such overtaking of services employment share is never observed, while in the case of value added it is observed in 1998, 2001 and 2004 respectively. This would suggest that even in continental Europe the transition to a service based economy is about to gain momentum, although with a significant delay with respect to US. Finally, Figure 1.6 shows the evidence about value added share in
15
North-European countries. The main trend is confirmed also by these data, though the case UK suggest a shorter lag between the overtaking of valued added share and that of employment. It is interesting to note how the increasing weight of service activities appears to be well established in the 2000s in Denmark and Sweden according to value added data, which suggest the converging evidence also of employment share in a decade.
>>> INSERT Figure 1.5 AND Figure 1.6 ABOUT HERE <<<
The evidence presented so far speaks for the topicality of the analysis of structural change. Although such a line enquiry dates back to very remote times, the structure of advanced capitalistic economies are interested by a continuous pressure to development and mutation. Structural change is an intrinsic characteristic to the process of restless economic growth, of which it is both a cause and a consequence. It is important to stress since now that structural change involves the industrial composition of economic systems, but it is not limited to this. It implies indeed a multidimensional concept which is related also to changes in the size distribution of firms and in the organization of production activities. More recently, the evidence concerning the productivity surge of the US in the 1990s stimulated a debate on its causes, which introduced another piece to the puzzle of structural change, i.e. the contribution of information and communication technologies (ICTs) to the development and establishment of service sectors. The next section will discuss such aspect of the process, and provide the basis to introduce another key element, which concerns the increasing relevance of knowledge both as an input and as an output in advanced capitalistic economies.
1.4
The role of ICTs in the recent dynamics of structural change
The changing composition of industrial activities, with particular respect to the increasing weight of service activities to detriment of manufacturing ones, provided a fertile humus for the effective introduction, adoption and diffusion of information and communication technologies (Antonelli, Patrucco and Quatraro, 2007 and 2008).
From a historical viewpoint, the path leading to the generation and adoption of ICT emerged out of a collective and interactive process induced by relevant changes in the economic environment. Since the late 1960s, twenty years after World War II, the US was experiencing a progressive erosion of its economic and technological leadership. The
16
combined effect of the convergent catching up of competing countries, the international diffusion of mass production and science-based technologies (Nelson and Wright, 1992) and the exhaustion of technological opportunities in the chemical and engineering technologies, resulted in a strong decline of US international competitive advantage and a productivity slowdown (Griliches, 1980). This decline in performance induced a myriad of interdependent, sequential and creative efforts directed towards the introduction of complementary technological innovations. The main result of these developments has been the creation of a new technological system with a strong skill bias. In the decades following their introduction, ICTs have considerably improved, and have slowly acquired the features of a general purpose technology (GPT). These technologies have a high degree of fungibility, that is, usable in many different contexts, strong complementarities and considerable spillover effects. Along with the improvements, the diffusion of ICT across US firms stemmed from a process of sequential, creative adoption (Lipsey et al, 2005).
Empirical analyses of the recent unexpected US productivity surge have clearly shown that the main responsible of such growth revival in the late 1990s is technological change, in particular the introduction of the new information and communication technologies (ICTs) (Jorgenson, 2001). Along these lines, a rather extended body of literature offered cross-country comparisons of the ICTs contributions to productivity growth. While the evidence related to the diffusion of the technology is somewhat mixed, the data about productivity suggest the existence of a new process of divergence between US and some other advanced countries in Europe (Daveri, 2002; Timmer and van Ark, 2005).
The development of ICTs is clearly the result of a complex set of technological, historical, economic and institutional factors. The coupling of the evidence concerning the role of ICTs in economic development with that concerning the movement towards a service based economy suggests that out of the so many enabling elements, the process of structural change observed in the last decades provided the US economy with a competitive advantage, which translated in an increased diffusion of ICTs fostered by the rise of service activities, which in turn boosted the rate of growth of productivity. ICTs are indeed technologies showing a strong bias towards the employment of highly qualified human capital, able to confront with the increasing specialization in the supply of knowledge-intensive business services.
17
Structural change therefore interacts with institutional and economic change so as to shape the patterns of technological change. If one looks at the data on the contribution of ICTs to value added growth across different countries2 (Figure 1.7), it is very evident that in the US it started increasing in the early 1990s and then it experienced a sudden acceleration up to the end of the decade. In the following years such contribution decreased and remained pretty stable around 0,40. This is partly due bursting of the NASDAQ bubble in 2000, but also to the changing pattern of contribution of ICTs to productivity growth (Jorgenson et al., 2007). The data reported in Figure 1.7 refer to the contribution of ICT capital to the growth of value added, which was influenced by the fast rates of technological progress in the field, high competition and declining prices. Such dynamics characterized the phases of fastest diffusion of ICTs, but then tended to stabilize. In the most recent years it is the efficiency gains in the production of ICT-related capital to have generated the most relevant positive effects. These latter, however, are mostly reflected in productivity statistics than in value added growth.
The data concerning Japan do not display any particular peak in the contribution of ICTs to value added growth. We can observe a rather regular cyclical behaviour and identify a slightly decreasing trend since the second half of the 1990s. As already noted, Japan clearly lags behind US in terms of changing industrial specialization in favour of service activities. These are in turn the main users of ICTs and are therefore the main responsible of their diffusion. The scarce contribution of ICTs can be hence related to the relatively low development of user services. Moreover, the global division of labour in the production of ICTs is such that only the mature modules of production process have been moved towards Eastern countries in the recent years, while the most promising in terms of expected returns have been retained in US (Fransman, 2007).
In the mid diagram of Figure 1.7 we can observe the situation concerning the continental European countries. First of all, it must be noted that in such areas the contribution of ICTs is far lower than that observed in the US over most of the observed period. Only in 2000s they appear to converge, partly as an effect of financial markets shocks. The situation is instead very different in Northern European countries. Although we can notice a pretty marked cyclical behaviour much in line with the evidence analyzed so far, in the second half of the 1990s both UK and (even more) Sweden experienced levels of ICTs contribution to value added growth comparable to those of US. This is very coherent with the general
2
18
evidence concerning the relative stronger weight of service sectors in these countries with respect to continental Europe.
>>> INSERT Figure 1.7 ABOUT HERE <<<
In order to gain a more comprehensive understanding of the comparative dynamics of ICTs diffusion one can look at the share of GDP expenditure for some main ICT-related goods and services. In Table 1.1 we report the expenditure for computer and office equipment, broadband and telecommunications and informatics services. These data are derived from input-output statistics provided by the OECD, for what concerns European countries, and the Bureau of Economic Analysis for what concerns the US evidence. These figures refer to both firms and households expenditure. Of course, such a difference in data sources, and hence in product classification, makes it difficult to compare the US and the European evidence. However we can well compare the differential dynamics.
>>> INSERT Table 1.1 ABOUT HERE <<<
On the whole, all of the three identified products show a positive trend in the second half of the 1990s. It is also quite interesting to note that both UK and US show a decrease in the expenditure for computers in the early 2000s, while they experienced an increase in the GDP share invested in broadband and telecommunication as well as informatics services. Within Europe, UK is the country with highest shares of GDP expenditure in each product category, which is fairly in line with the fact that it appears also as the European country that mostly resemble the US dynamics of structural change. Encouraging figures are related to the French and German situation, the path of which towards the service economy has appeared as well established. Within this framework, Italy appears to have a relatively high delay in the exploitation of the potentials linked to the diffusion of ICTs, which is preventing from the establishment of sound growth paths.
The evidence discussed so far emphasizes the intertwining between the process of structural change and technological change. In particular, it provides further support to the idea that the increasing specialization in service activities has created a fertile ground to the adoption and diffusion of ICTs. Of course this is only part of the story. ICTs are the outcome of technological efforts carried out mostly in the US and engendered by failure-inducement dynamics set up by the oil crisis in the 1970s and the subsequent productivity slowdown. Institutional factors related to the definition of standards and the rise of venture capital also
19
played an important role. The rise of service sectors has been crucial in setting in motion positive dynamics on the demand side, ensuring fast diffusion for such technologies and creating the condition for further development and applications (Quatraro, 2011). This synergy has paved the way to much deeper changes in advanced economies, by creating the conditions for the emergence of systems based on the creation and exploitation of technological knowledge.
1.5
The emergence of the knowledge-based economy
The effects of the introduction of ICT have been powerful. The US economy has been enjoying a new surge in productivity since the 1995. The ICT industry has played a key role in this as a result of the rapid technological developments in the semiconductor industry. The persistent and steep decline in the price of semiconductors has been transmitted downwards in the value chain, affecting the semiconductor user sectors, and especially the producers of telecommunication equipment and software (Jorgenson, 2001). The productivity gains stemming from the spread of ICTs are due both to increases in efficiency in upstream industries and to the flows of creative adoptions of ICTs in downstream sectors. These technologies have enabled knowledge spillovers to the rest of the system and as a result of intense competition, the new upstream industries have been unable to retain the full stream of benefits stemming from the new technology. This has engendered a flow of pecuniary externalities (David, 2001a).
Strong US technological leadership has encouraged a new international division of labour which reversed the situation that prevailed in the 1980s. The US quickly became the main producer and user of ICTs, while the rest of the advanced countries are engaged in creative adoption involving adapting the technology to the idiosyncratic conditions of their markets and industrial structures.
Because of the strong directional skill bias of ICTs a digital divide is emerging between countries that are ‘properly’ endowed, that is, that have the ‘right’ amount of human capital and access to the knowledge commons. These ‘properly’ endowed countries are able to participate in the process of cumulative technological change and creative adoption. Other countries can, at best, adopt ICTs passively and enjoy fewer chances to take advantage of the new opportunities for productivity growth. ICTs are global in character because they bring
20
about increases in productivity and efficiency, such that their adoption is profitable across a great array of products and processes, and regions. Nevertheless, asymmetric effects stemming from the strong skill bias and the different endowments of human capital must be accounted for in examining these effects (Antonelli, 2003).
Since the early 1990s the adoption of ICTs has made possible the emergence of global corporations based on distributed coordination processes, selling worldwide customized products, manufactured and assembled in a variety of regions, while retaining in their home countries the skill-intensive activities. This trend is especially evident in the new service industry and, in particular, in the new knowledge-intensive-business service sector (Dunning, 1993).
Specialization in new knowledge-based services that rely heavily on the quality and variety of advanced digital communication characterizes the transition to the new knowledge economy in advanced countries. ICTs are increasingly important for a wide scope of knowledge services that range from entertainment to health and financial services to education and logistics. The advent of digital technologies changes the context in which knowledge-based services were traditionally supplied. ICTs allow remote interaction between different actors, while in traditional services, any interaction implied physical proximity. ICTs change the way in which services are delivered and used, and the way in which services are provided to final users. ICTs are crucial also to changes in the way new knowledge services are used and contributed to by final and intermediary users (Von Hippel, 2005).
The centrality of knowledge in the economy has increased so much that a new branch of economics actually emerged and consolidated in the last decades, i.e. economics of knowledge, which analyzes the conditions leading to the creation of knowledge on the one hand, as well as its economic effects on the other hand (Foray, 2004). Much attention has been provided in this respect to technological knowledge and to the benefits stemming from its application to production processes. In Chapter 3 we will dig in more detail into the economic theories dealing with knowledge. By now, it is important to stress the close link between the increasing rates of knowledge production and the recent dynamics of structural change which led to the increase in the share of service activities and the diffusion of ICTs.
The analyses of technological knowledge have been conducted by relying on a relatively small number of indicators. They are mostly proxy variables to measure and quantify the phenomenon. The most used indicator is undoubtedly the number of patent
21
applications filed by economic agents, which are aggregated at different levels, say firms, regions or countries. The use of patents as a proxy for technological knowledge has been put forth by Zvi Griliches in the 1970s, and further developed by his students, who developed different perspectives on the exploitation of such data for economic investigation. Although patent applications show important limits that we will discuss at due length in further on, they nonetheless provide a useful representation of the effectiveness of knowledge production process across the economies, at least for what concern manufacturing sectors.
In order to complete the picture on the actual relevance of structural change and its linkages with the increasing role of knowledge in advanced economies, we report in Figure 1.8 and Figure 1.9 data about knowledge production as proxied by patent applications. The former report the number of patent applications within the Patent Cooperation Treaty (PCT). Such data are drawn by the OCED Science and Technology Indicators (OECD, 2009). In order to account for cross-country size differences the total number of patent applications has been divided by the number of employees provided by Groningen Growth and Development Centre, so as to obtain a relative measure of patenting activity which is more useful for the purpose of comparison. In the top diagram we compare the four main players on the world economy. One can immediately observe that the rate of creation of knowledge is positive over the whole observed period. In particular, in the US there is a significant boost in the second half of the 1990s which becomes even more evident in the 2000s. This represents interesting, though descriptive, empirical evidence of the correspondence between the gradual dominance of service over manufacturing activities, which became evident in the US already in the 1990s, the diffusion of ICTs and the increasing relevance of knowledge production activities. The evidence about Japan and Korea is as much interesting, as we can observe a sudden acceleration for the former since the second half of the 1990s while in the latter this occurs in correspondence of the end of the same decade. The EU-15 aggregate shows a smoother dynamics in which the growth rate, differently from the other countries, decreases in the early 2000s.
22
Figure 1.8 ABOUT HERE <<<
In order to better understand the European evidence, the mid diagram of the figure shows the evidence of continental European countries. Even controlling for cross-country differences, patenting activity in continental Europe seems to be far lower than in the US or Japan. As expected, the countries showing the best performances are Germany and France, which experience a marked acceleration in the second half of the 1990s. Indeed these appear to be also at the forefront in the changing specialization in favor of service activities, despite the relatively high share of manufacturing that still persists in Germany. The Italian and Spanish evidence confirms instead the relative delay of these two countries. The bottom diagram shows finally the evidence concerning North-European countries. These figures are comparable to the US and Japanese evidence also in terms of magnitude. This is especially true for what concerns Denmark, Finland and Sweden, while the UK shows figures significantly below those of such countries. The best performing country is here Sweden, closely followed, and actually overcome in 2001, by Finland. The acceleration in the rate of creation of new knowledge in these two countries occurred in the first half of the 1990s, while it can be observed towards the end of the decade in the case of Denmark.
The data on knowledge creation provide therefore a useful complement to the understanding of the implications of the recent dynamics of structural change which took the shape of a transition from manufacturing to service-based economic systems. Further interesting information can be obtained by looking at the share of patent applications within the PCT which are related to ICTs. In Figure 1.9 we report the dynamics concerning US, Japan, Korea and EU-15. We can observe that Japan and US retain the highest relative levels of ICT-related patents for almost the whole observed period. In particular, the US became dominant in the second half of the 1990, i.e. in the period in which its productivity dynamics was mostly driven by the creation, diffusion and exploitation of ICTs. Such position has been retained up to 2002, when it was overtaken by Korea and Japan. In the mid diagram the data about continental European countries suggest that again France and Germany have a significant advantage with respect to Italy and Spain. Germany outperformed France only in the second half of the 1990s, while in the rest of the observed period the curve concerning France was constantly above those of the other countries. It must be noted, however, that the share of ICT-related patents never went above the 35% in central European countries, while in the case of US and Japan the peak was reached at 45%. The bottom diagram provides instead the evidence about North-European countries, showing that since the early 1990s Finland has
23
taken the lead of this group, growing constantly until 2007 at a rate such that in 2007 about 60% of its patents were in ICT related technologies. Sweden follows Finland, although with significantly lower values, while UK and Denmark are characterized by dynamics which are not particularly relevant.
>>> INSERT Figure 1.9 ABOUT HERE <<<
These data allow us to gain a more comprehensive picture of the structural transformation ongoing in advanced capitalistic economies, so as to include the increasing relevance of knowledge production and, in particular in the second half of the 1990s, of technological knowledge related to the development and creative adoption of ICTs. We are now in the position to draw some preliminary conclusions that will serve as a basis to develop the heuristic framework in the next three chapters.
1.6
Conclusions
The analysis of industrial and technological dynamics allows to outlining an interesting picture representing the evolution of structural features of most advanced economies. Three main groups of countries clearly emerge, on the basis of the relative advancement in the transition process towards a service- and knowledge-based economy. The US appears to be the leader in this context, closely followed by Japan and, more recently, Korea. North-European countries appear to be characterized by a somewhat long lasting tradition of high service share in the economy, though the data on knowledge production suggest the establishment of a significant active role in this field only in the late 1990s. The central European countries show instead a quite worrying delay, which can partly explain why the persistence of US leadership is challenged nowadays by some Eastern countries, but not at all by European ones. Out of these latter, France and Germany are clearly far better positioned than Italy and Spain, in which industrial activity seem to be still too much dependent on the evolution of manufacturing activities. The low levels of knowledge production suggest moreover that such activities are hardly specialized in the production of high-tech goods, and are more likely to involve mature and labor-intensive sectors which are now more and more developing in areas characterized by lower wage rates for unskilled labor.
24
The evidence discussed in this chapter suggest not only that structural change deserves to be properly investigated in order to fully understand differential dynamics of economic development. The matching of economic variables with technological indicators also calls for a more extended approach to the analysis, involving also the appreciation of the role of innovation dynamics. The integration of innovation and knowledge into the picture can be far reaching, in that it lends itself to a broader declension of the concept of structural change. In particular, the recent developments on the dynamics of collective knowledge generation through the recombination of dispersed and fragmented knowledge provide the basis to bring about into the framework of analysis the structure of networked agents as well as the structure of knowledge bases. Each structure is likely to be characterized by its own architecture, which in turn is likely to have effects on the actual performances on the working of whole system. A complex chain of feedbacks and mutual enforcing dynamics can therefore take place in this direction. The location aspects play a key role in this respect, in that they are likely to introduce powerful constraints to the way such structures evolve over time as well as to the way each structure exerts its influences on the other ones.
The next part of the book will be devoted to the development of a path moving from the traditional theories of structural change, going through the integration of the theories about innovation and knowledge production, so as to get to a temporary synthesis based on the heuristic tools provided by the complex systems theory and its applications to the economic domain.
25 Figure 1.1 – The evolution of manufacturing share of employment across Europe, US, Japan and Korea.
0,000 0,050 0,100 0,150 0,200 0,250 0,300 0,350 0,400 0,450 EU-15
TOTAL MANUFACTURING TRANSPORT AND STORAGE AND COMMUNICATION FINANCIAL INTERMEDIATIO N REAL ESTATE, RENTING AND BUSINESS ACTIVITIES
0,000 0,050 0,100 0,150 0,200 0,250 0,300 0,350 0,400 0,450 USA
TOTAL MANUFACTURING TRANSPORT AND STORAGE AND COMMUNICATION FINANCIAL INTERMEDIATIO N REAL ESTATE, RENTING AND BUSINESS ACTIVITIES
0,000 0,050 0,100 0,150 0,200 0,250 0,300 0,350 0,400 0,450 Japan
TOTAL MANUFACTURING TRANSPORT AND STORAGE AND COMMUNICATION FINANCIAL INTERMEDIATION REAL ESTATE, RENTING AND BUSINESS ACTIVITIES
0,000 0,050 0,100 0,150 0,200 0,250 0,300 0,350 0,400 0,450 Korea
TOTAL MANUFACTURING TRANSPORT AND STORAGE AND COMMUNICATION FINANCIAL INTERMEDIATIO N REAL ESTATE, RENTING AND BUSINESS ACTIVITIES
26 Figure 1.2 – The evolution of manufacturing share of employment across Germany, France, Italy and Spain.
0,000 0,050 0,100 0,150 0,200 0,250 0,300 0,350 0,400 0,450 Germany
TOTAL MANUFACTURING TRANSPORT AND STORAGE AND COMMUNICATION FINANCIAL INTERMEDIATIO N REAL ESTATE, RENTING AND BUSINESS ACTIVITIES
0,000 0,050 0,100 0,150 0,200 0,250 0,300 0,350 0,400 0,450 France
TOTAL MANUFACTURING TRANSPORT AND STORAGE AND COMMUNICATION FINANCIAL INTERMEDIATIO N REAL ESTATE, RENTING AND BUSINESS ACTIVITIES
0,000 0,050 0,100 0,150 0,200 0,250 0,300 0,350 0,400 0,450 Italy
TOTAL MANUFACTURING TRANSPORT AND STORAGE AND COMMUNICATION FINANCIAL INTERMEDIATIO N REAL ESTATE, RENTING AND BUSINESS ACTIVITIES
0,000 0,050 0,100 0,150 0,200 0,250 0,300 0,350 0,400 0,450 Spain
TOTAL MANUFACTURING TRANSPORT AND STORAGE AND COMMUNICATION FINANCIAL INTERMEDIATIO N REAL ESTATE, RENTING AND BUSINESS ACTIVITIES
27 Figure 1.3 – The evolution of manufacturing share of employment across UK, Sweden, Finland and Denmark.
0,000 0,050 0,100 0,150 0,200 0,250 0,300 0,350 United Kingdom
TOTAL MANUFACTURING TRANSPORT AND STORAGE AND COMMUNICATION FINANCIAL INTERMEDIATIO N REAL ESTATE, RENTING AND BUSINESS ACTIVITIES
0,000 0,050 0,100 0,150 0,200 0,250 0,300 0,350 Sweden
TOTAL MANUFACTURING TRANSPORT AND STORAGE AND COMMUNICATION FINANCIAL INTERMEDIATIO N REAL ESTATE, RENTING AND BUSINESS ACTIVITIES
0,000 0,050 0,100 0,150 0,200 0,250 0,300 0,350 Finland
TOTAL MANUFACTURING TRANSPORT AND STORAGE AND COMMUNICATION FINANCIAL INTERMEDIATIO N REAL ESTATE, RENTING AND BUSINESS ACTIVITIES
0,000 0,050 0,100 0,150 0,200 0,250 0,300 0,350 Denmark
TOTAL MANUFACTURING TRANSPORT AND STORAGE AND COMMUNICATION FINANCIAL INTERMEDIATIO N REAL ESTATE, RENTING AND BUSINESS ACTIVITIES
28 Figure 1.4 – Evolution of value added share across EU-15, USA, Japan and Korea
0,000 0,050 0,100 0,150 0,200 0,250 0,300 0,350 0,400 EU-15
TOTAL MANUFACTURING TRANSPORT AND STORAGE AND COMMUNICATION FINANCIAL INTERMEDIATION REAL ESTATE, RENTING AND BUSINESS ACTIVITIES
0,000 0,050 0,100 0,150 0,200 0,250 0,300 0,350 0,400 USA
TOTAL MANUFACTURING TRANSPORT AND STORAGE AND COMMUNICATION FINANCIAL INTERMEDIATION REAL ESTATE, RENTING AND BUSINESS ACTIVITIES
0,000 0,050 0,100 0,150 0,200 0,250 0,300 0,350 0,400 Japan
TOTAL MANUFACTURING TRANSPORT AND STORAGE AND COMMUNICATION FINANCIAL INTERMEDIATION REAL ESTATE, RENTING AND BUSINESS ACTIVITIES
0,000 0,050 0,100 0,150 0,200 0,250 0,300 0,350 0,400 Korea
TOTAL MANUFACTURING TRANSPORT AND STORAGE AND COMMUNICATION FINANCIAL INTERMEDIATION REAL ESTATE, RENTING AND BUSINESS ACTIVITIES
29 Figure 1.5 – Evolution of value added share across Germany, France, Italy and Spain
0,000 0,050 0,100 0,150 0,200 0,250 0,300 0,350 0,400 Germany
TOTAL MANUFACTURING TRANSPORT AND STORAGE AND COMMUNICATION FINANCIAL INTERMEDIATION REAL ESTATE, RENTING AND BUSINESS ACTIVITIES
0,000 0,050 0,100 0,150 0,200 0,250 0,300 0,350 0,400 France
TOTAL MANUFACTURING TRANSPORT AND STORAGE AND COMMUNICATION FINANCIAL INTERMEDIATION REAL ESTATE, RENTING AND BUSINESS ACTIVITIES
0,000 0,050 0,100 0,150 0,200 0,250 0,300 0,350 0,400 Italy
TOTAL MANUFACTURING TRANSPORT AND STORAGE AND COMMUNICATION FINANCIAL INTERMEDIATION REAL ESTATE, RENTING AND BUSINESS ACTIVITIES
0,000 0,050 0,100 0,150 0,200 0,250 0,300 0,350 0,400 Spain
TOTAL MANUFACTURING TRANSPORT AND STORAGE AND COMMUNICATION FINANCIAL INTERMEDIATION REAL ESTATE, RENTING AND BUSINESS ACTIVITIES
30 Figure 1.6 – Evolution of value added share across UK, Sweden, Finland and Denmark
0,000 0,050 0,100 0,150 0,200 0,250 0,300 0,350 0,400 United Kingdom
TOTAL MANUFACTURING TRANSPORT AND STORAGE AND COMMUNICATION FINANCIAL INTERMEDIATION REAL ESTATE, RENTING AND BUSINESS ACTIVITIES
0,000 0,050 0,100 0,150 0,200 0,250 0,300 0,350 0,400 Sweden
TOTAL MANUFACTURING TRANSPORT AND STORAGE AND COMMUNICATION FINANCIAL INTERMEDIATION REAL ESTATE, RENTING AND BUSINESS ACTIVITIES
0,000 0,050 0,100 0,150 0,200 0,250 0,300 0,350 0,400 Finland
TOTAL MANUFACTURING TRANSPORT AND STORAGE AND COMMUNICATION FINANCIAL INTERMEDIATION REAL ESTATE, RENTING AND BUSINESS ACTIVITIES
0,000 0,050 0,100 0,150 0,200 0,250 0,300 0,350 0,400 Denmark
TOTAL MANUFACTURING TRANSPORT AND STORAGE AND COMMUNICATION FINANCIAL INTERMEDIATION REAL ESTATE, RENTING AND BUSINESS ACTIVITIES
Figure 1.7 – Contribution of ICTs to value added growth 0,00 0,20 0,40 0,60 0,80 1,00 1,20 1,40 1981 1982 1983 1984 1985 1986 1987 1988 1989 1990 1991 1992 1993 1994 1995 1996 1997 1998 1999 2000 2001 2002 2003 2004 2005 2006 2007 USA Japan 0,00 0,20 0,40 0,60 0,80 1,00 1,20 1,40 1981 1982 1983 1984 1985 1986 1987 1988 1989 1990 1991 1992 1993 1994 1995 1996 1997 1998 1999 2000 2001 2002 2003 2004 2005 2006 2007
Italy France Germany Spain
0,00 0,20 0,40 0,60 0,80 1,00 1,20 1,40 1981 1982 1983 1984 1985 1986 1987 1988 1989 1990 1991 1992 1993 1994 1995 1996 1997 1998 1999 2000 2001 2002 2003 2004 2005 2006 2007
32 Table 1.1 – Share of GDP invested in ICTs (%)
1995 1996 1997 1998 1999 2000 2001 2002 2003 2004
Computers and Office Equipment1
Germany 3.422 3.512 3.775 3.686 3.836 3.869 France 1.966 2.014 2.018 2.041 2.056
United Kingdom 2.465 2.426 2.502 2.442 2.319 2.312 2.162 2.128 2.128 Italy 1.946 1.884 1.953 2.011 1.938 1.929 1.872
United States 3.711 3.833 3.763 3.789 3.337 2.786 2.657 2.859
Broadband and Telecommunications2
Germany 1.681 1.756 1.913 2.272 2.337 2.401 France 1.827 2.033 2.299 2.490 2.678 United Kingdom 2.792 3.095 3.359 3.732 3.684 3.806 3.775 4.137 4.248 Italy 1.445 1.560 1.675 1.848 1.947 1.864 2.013 United States 1.892 2.434 2.685 2.878 3.092 3.129 3.178 3.284 Informatics services3 Germany 0.956 1.177 1.422 1.493 1.603 1.912 France 1.514 1.680 2.172 2.280 2.478 United Kingdom 1.523 1.767 2.244 2.711 3.103 3.261 3.607 3.802 4.383 Italy 1.208 1.359 1.403 1.541 1.738 1.717 1.893 United States 0.914 1.308 2.017 1.604 1.588 1.667 1.663 1.719 Source: Elaborations on Input-Output data BEA and OECD.
Notes: 1Product code: USA (334+335) and OECD (30+31) 2
Product code: USA 513 and OECD 64 3
33 Figure 1.8 – Dynamics of patents per 1000 employees
0 0,5 1 1,5 2 2,5 3 3,5 4
Japan Korea United States European Union (15 countries)
0 0,5 1 1,5 2 2,5 3 3,5 4
France Germany Italy Spain
0 0,5 1 1,5 2 2,5 3 3,5 4
34 Figure 1.9 – Share of ICTs patents on total applications
0 0,1 0,2 0,3 0,4 0,5 0,6 0,7
Japan Korea United States European Union (15 countries)
0 0,1 0,2 0,3 0,4 0,5 0,6 0,7
France Germany Italy Spain
0 0,1 0,2 0,3 0,4 0,5 0,6 0,7
36
Chapter 2 -
Structural change and the long run dynamics of economic
growth.
2.1
Introduction
The dynamics of structural change do not represent a phenomenon limited in time space, but it rather looks like a continuous process ongoing in different geographical and industrial contexts, linked to the phases and cycles of economic development. The empirical evidence provided in the previous chapter speaks for this, and shows how much uneven are growth rates across sectors and, for the same sectors, across different countries.
Since its origins, the concept of structural change relates the changes in the sector composition of the economy. It has been then enriched by using it to denote additional phenomena like changes in firms’ size distribution or institutions. While there is a wide body of empirical evidence talking this issue, analytical models are relatively less numerous. Some models are grounded on the supply-side, focusing on the asymmetric dynamics of labour productivity, while other models draw upon a demand-side approach, mainly based on the inclusion of nonhomotetic preferences in neoclassical growth models or on Engel’s law. Both types of approaches share the same limitations, in that technological change is recognized as important aspect of the process, but it is evoked as exogenous. Such drawbacks have been addressed by evolutionary models based on replicator dynamics, which have the clear merit to draw the attention of the intrinsic relationships between the analysis of structural change à la Kuznets and the Schumpeterian analysis of technological change.
This chapter elaborates the path driving from the antecedent scholars dealing with structural change to the articulation of the intertwining with the study of technological change. Section 2 explores the origins of the analysis of structural change in economics, moving from Smith through Marshall and Young. Section 3 illustrates the so-called three-sector hypothesis, emphasizing the consequences in terms of convergence across regions and countries. Section 4 provides an overview on the analytical approaches to the analysis of structural change, while Section 5 articulates the link between structural change and technological change, by showing similarities and complementarities between Kuznets and Schumpeter. Finally Section 6 provides provisionally conclusions.
37
The identification of the origins of the analysis of structural change in economics is not a very easy task, for at least two sets of reasons. First, it is difficult to detect a unique meaning of structure and structural change in economics. Second, the utilization of the term ‘structural change’ is relatively recent, and it is likely that key authors in economic science have dealt with structural change without having explicitly mentioned it.
We have already noted in the first chapter that the term structural change can indicate different research contexts in economics. A former systematic analysis of the different meanings that this expression can take in economics can be found in Machlup (1963). He provided indeed an extensive list of the uses of terms, by assessing also the clearness degree of the utilization. The most common use of the term concerns the different arrangements of productive activity in the economy, with particular reference to the different distribution of productive factors among various sectors of the economy, various occupations, geographic regions, types of product, and so on and so forth (Machlup, 1963: p.XXX). The key reference in this respect is the Nobel laureate Simon Kuznets, who dedicated most of his research activity, which will be the object of detailed analysis in what follows, to the analysis of the changing distribution of employment across industries and the relationship between stage of development and the industrial composition of national economies (Kuznets, 1930 and 1973).
However, some more remote contributions can be found dealing with similar issues, put forth by the founding fathers of the economic science. For example, Adam Smith’s Wealth of Nations (1776) articulated as a main hypothesis that the increase in the final demand for goods engenders the division of labour, by creating new branches of activity. Moreover, Adam Smith explicitly stated that those countries which have successfully developed a specialization in manufacturing activities are those mostly reaping the benefits stemming from the division of labour, i.e. efficiency gains: “The most opulent nations, indeed, generally excel all their neighbours in agriculture as well as in manufactures; but they are commonly more distinguished by their superiority in the latter than in the former” (Smith, 1776, p.XXX). In Smith the industrialization process is strictly linked to the division of labour, which in turn contributes to the accumulation of new skills and competences. The division of labour is also at the basis of technological change, channelled both by learning dynamics (the increase of dexterity) and the creation of new machineries, often stemming by “the ingenuity of the makers of the machines, when to make them became the business of a peculiar trade; and some by that of those who are called philosophers, or men of speculation” (Smith, 1776: p. XXX). Thus, in the Wealth of Nations, poor countries are those mainly specialized in agriculture activities, whereby the division of labour is limited by the nature of the tasks to be carried out and therefore can yield very limited productivity gains. On the