HAL Id: hal-01975522
https://hal.archives-ouvertes.fr/hal-01975522
Submitted on 2 Oct 2020HAL is a multi-disciplinary open access archive for the deposit and dissemination of sci-entific research documents, whether they are pub-lished or not. The documents may come from teaching and research institutions in France or abroad, or from public or private research centers.
L’archive ouverte pluridisciplinaire HAL, est destinée au dépôt et à la diffusion de documents scientifiques de niveau recherche, publiés ou non, émanant des établissements d’enseignement et de recherche français ou étrangers, des laboratoires publics ou privés.
Reactivity monitoring of the accelerator driven
VENUS-F subcritical reactor with the “current-to-flux”
method
N. Marie, J.L. Lecouey, G. Lehaut, T. Chevret, A. Billebaud, S. Chabod, X.
Doligez, A. Kochetkov, A. Krása, F.R. Lecolley, et al.
To cite this version:
N. Marie, J.L. Lecouey, G. Lehaut, T. Chevret, A. Billebaud, et al.. Reactivity monitoring of the ac-celerator driven VENUS-F subcritical reactor with the “current-to-flux” method. Annals Nucl.Energy, 2019, 128, pp.12-23. �10.1016/j.anucene.2018.12.033�. �hal-01975522�
Reactivity monitoring of the accelerator driven VENUS-F subcritical
reactor with the “current-to-flux” method
N. Marie a,*, J. L. Lecouey a, G. Lehaut a, T.Chevret a, A. Billebaud b, S. Chabod b, X. Doligez c, A. Kochetkov d, A. Krása d, F. R. Lecolley a, F. Mellier e, W. Uyttenhove d**, G. Vittiglio d,J. Wagemansd.
aNormandie Univ, ENSICAEN, UNICAEN, CNRS/IN2P3, LPC Caen, 14000 Caen, France
b LPSC, Université Grenoble-Alpes, CNRS/IN2P3, 53 Avenue des Martyrs. 38026 Grenoble cedex,
France
c Institut de Physique Nucléaire d'Orsay, CNRS-IN2P3/Univ. Paris Sud, France d SCK·CEN, Belgian Nuclear Research Centre, Boeretang 200, 2400 Mol, Belgium e CEA-Cadarache, 13108 Saint Paul-lez-Durance, France
**present address: The Binding Energy bvba, Rodebeukenhof 8, 9050 Gent, Belgium
* Corresponding author. Tel.: +33 2 31 45 25 16. E-mail address: marie@lpccaen.in2p3.fr
Abstract
In this article, we evaluate the quality and robustness of a method envisaged for the on-line monitoring of the subcriticality of an ADS, called the “current-to flux” (CTF) method. For this evaluation, we performed a dedicated experiment at the GUINEVERE facility. It is hosted at the SCK-CEN and consists of the subcritical VENUS-F reactor coupled to a continuous external neutron source provided by the GENEPI-3C accelerator. During this experiment, the reactor control rods were moved in various patterns, and the subsequent dynamical evolutions of the reactor reactivity were monitored using nine fission chambers (FCs). The space-energy effects that bias the reactivity values are corrected using a procedure based on simulations computed with the Monte Carlo neutron transport code MCNP. We investigate the precision of this correction procedure by comparison with a reactivity value extracted with the beam interruption technique and we demonstrate its insensitivity to the simplifications made on the VENUS-F reactor modeling and to a simulation key parameter such as the boron carbide density filling the control rods.
1. Introduction
Nuclear waste management is a major societal concern which triggered a renewal of interest for the Accelerator Driven Systems (ADS) (OECD-NEA, 2002, 2006) in the 90’s. ADS are composed of a subcritical fast nuclear reactor coupled to an accelerator which delivers a beam of high energy particles. The latter impinges on a heavy and thick target immersed inside the reactor core. The spallation reactions induced this way produce an external neutron source which maintains the reactor thermal power constant. Such facilities could be loaded with fuel containing a large amount of highly radiotoxic minor actinides which could be transmuted by neutron induced reactions (Lensa et al., 2008). Indeed, their small delayed neutron fractions have no real impact on the control of the reactor as long as it remains subcritical enough. Thus, for safety reasons and reactor operation purposes, the reactor reactivity has to be measured continuously to ensure it remains in a given margin to criticality. The final conclusions of the MUSE project (Mellier et al., 2005) pointed out that two independent methods should be combined to achieve this on-line subcriticality monitoring. The first one is based on the temporal evolution of the neutron population during programmed short interruptions of the continuous particle beam and allows the absolute determination of the reactivity. It is called the beam interruption (BI) method (Chevret et al., 2014). For an industrial ADS, in order not to disturb standard exploitation conditions, such an accelerator mode could be operated only during recurring short periods. The second method, which has to be combined with the first one, is the “current-to-flux” (CFT) technique which could be employed in normal operation conditions, i.e when the accelerator delivers a continuous beam. Such a methodology which combines different techniques is planned to be applied to the future research MYRRHA reactor, conceived as an ADS (Baeten et al., 2003; Uyttenhove, 2016; Abderrahim et al., 2010). This CTF method provides at an almost instantaneous time scale the reactivity relative evolution around an initial reactivity value, measured beforehand with another absolute technique such as the BI technique. The CTF method does not aim at providing absolute measurements of the subcritical level of an ADS but only at monitoring relative reactivity variations. The validation of this whole methodology was one of the main objectives of the FREYA project
(FREYA) conducted at the GUINEVERE (Generator of Uninterrupted Intense NEutrons at the lead VEnus REactor) facility at SCK-CEN, in support of the design and licensing of the MYRRHA project. GUINEVERE consists of the fast subcritical lead VENUS-F reactor, driven by the deuteron accelerator GENEPI-3C (Baylac et al., 2009). The T(d,n)4He fusion reactions at the core center furnish the reactor with the external neutron source.
This paper presents the investigation of the CTF technique for the monitoring of the VENUS-F reactivity during an experiment performed jointly by CNRS and SCK-CEN after the completion of the FREYA project. The reactor was operated in a subcritical configuration, further on referred to as SC7, and characterized by a neutron multiplication coefficient ranging from keff 0.95 to 0.96. It was
decided to test the CTF method under conditions which are probably more hostile than those that will be encountered during operation: track fast and large reactivity variations caused by the motion of a strong absorbent. For this purpose, a single experiment consisting in performing ten motions of the control rods (CRs) at a velocity of 15 mm/s, after the stabilization of the reactor at various steady states, was carried out. A similar experiment was done at the Yalina-Booster for a subcritical level of about keff 0.95: one insertion and one extraction of the CRs, corresponding to two transients of only
300 pcm within 6 s, were performed (Bécares et al., 2013). The evolution of the CTF reactivity values was studied for only one 235U fission chamber (FC).
In this paper, we first present the GUINEVERE facility. The principles of the CTF method are then explained, and this technique is applied to estimate, as a function of time, the reactivity of the reactor from the FC count rates. The origin of the dramatic discrepancies observed among the results given by nine detectors, spread over the reactor, is investigated. The principles of a correction procedure based on Monte Carlo simulations are described. For a specific CR position, the corrected reactivities are compared to the absolute reactivity determined with the BI technique. Finally, the robustness of the CTF method coupled to the correction technique is assessed by studying its sensitivity to the simplifications made on the VENUS-F reactor modeling and to a key parameter of the simulations.
2. Experimental facility
2.1. The Guinevere facility
The GUINEVERE facility, hosted at the SCK-CEN in Mol (Belgium) (Billebaud et al., 2009), is composed of the VENUS-F reactor which is a fast reactor with solid lead for mimicking Pb coolant, and a 30 wt.% highly enriched metallic uranium fuel (provided by the French Commissariat à l’Energie Atomique, CEA). It is coupled to the GENEPI-3C accelerator which was operated in a continuous mode in the experiment presented in this paper. The accelerator delivers a deuteron beam (at 220 keV energy) which hits a copper target with a titanium-tritium (TiT) deposit. The 14-MeV external neutron source is provided by the resulting T(d,n)4He reactions occurring at the center of the core.
The VENUS-F reactor is contained in a cylindrical vessel (80 cm in radius and 140 cm in height). A 12x12 matrix can receive 144 elements which can be fuel assemblies, lead assemblies, graphite assemblies or absorbing elements. This matrix is delimited by a 30 mm thick stainless steel casing and is surrounded by semi-circular lead plates acting as part of the radial neutron reflector which is completed with top and bottom 40 cm-thick lead axial reflectors. The CTF experiment was carried out in a reactor configuration (called SC7) consisting of 35 fuel assemblies (FAs) and 6 safety rods (SRs) with fuel followers. The latter were retracted from the core to act like standard FAs. For this configuration, the reactor mid-plane cross-section is depicted in Fig. 1. The four central slots of the grid were left empty to give room to the accelerator beam tube. To control the reactor reactivity, two boron-carbide control rods were also installed at the core periphery. A small reactivity worth absorbent rod (POAR), was also fully inserted inside the core. 19 graphite blocks were arranged into two rows to better simulate the MYRRHA reflector made of BeO.
Fig. 1: Mid-plane cross-section of the SC7 configuration of the VENUS-F reactor. Lead reflector and lead assemblies are in very light gray. SR stands for safety rods (SR) with fuel followers. CR stands for Control Rod. Graphite blocks are arranged into two rows. The central square represents the GENEPI-3C accelerator beam tube. The arrows designate the fission chamber locations whose names are in bold.
In the GUINEVERE facility, the T(d,n)α fusion reactions produce the external source of 14-MeV neutrons. A possible variation of the deuteron beam position on the active part of the target, combined with the desorption of the 3H isotopes over time, preclude estimating the source intensity from the simple measurement of the deuteron beam current on the copper target support. Therefore, a direct monitoring of the neutron production is performed via the detection in a small silicon wafer detector, called API, of the alpha particles emitted in the fusion reactions. Since deuteron (D) atoms are gradually implanted into the target, DD fusion reactions can occur as well. It was verified that this parasitic neutron contribution was negligible for the CTF experiment. Thus, from the alpha detection rate in API, Nα, it is possible to have access to the intensity of the external neutron source produced by
DT reactions.
2.4. The fission chambers
Some lead assemblies contain experimental channels to accommodate fission chambers (FCs). During the CTF experiment, nine fission chambers (FCs) were inserted into these special assemblies and placed at the VENUS-F reactor mid-plane (see Fig. 1). Six CFUL01 FCs manufactured by Photonis with a deposit mass of about 1 g, composed of about 92 % 235U, were used. Three Reuter-Stokes (RS) FCs (100 mg 235U deposit) completed this set. The detectors are mainly localized at the core-reflector interface and in the reflector because similar positions are envisioned for the MYRRHA facility. Indeed, standard 235U FCs would not sustain the neutron flux in the MYRRHA core center.
Each FC was connected to a High Voltage power supply and its signal was shaped by an amplifier-threshold discriminator (Canberra 7820-ADS) delivering TTL pulses. The GANDDALF acquisition card enables the counting of the digital pulses as well as their time-stamping (impulse mode) with a 20 ns resolution.The discriminator thresholds were tuned to remove part of the signal associated to electronic noise or light particles (alpha) and gamma-rays. Very low background counting rates were recorded overnight for all FCs while the reactor was shut down, and were subtracted to the FC counting rates. Dead-time correction was also applied when the counting rates were too high. For this purpose, the formula of the series arrangement of two dead times (paralyzable + non-paralyzable) has been used
(Müller et al, 1994). Its parameters were adjusted on data taken during a dedicated experiment performed at the GUINEVERE facility. Such dead time correction has already been applied with success for PNS data (Marie et al., 2013). For the present work, the correction is at most of 2 % for the FCs with the heaviest deposit. Together with the deposit mass, the minimum and maximum detector counting rates are gathered in Table 1. They correspond to the two extreme cases for which
both control rods are inserted or removed from the reactor (their heights are, respectively, at 0 mm or 600 mm). In the last two columns, the detection rates are also given for two other CR positions.
Fission chamber CR heights CR1@0 mm CR2@0 mm CR1@600 mm CR2@600 mm CR1@0 mm CR2@600 mm CR1@600 mm CR2@0 mm Deposit mass (mg) counting rate (s-1) counting rate (s-1) counting rate (s-1) counting rate (s-1) RS74 100 18700 25200 21000 22300 RS75 100 21300 27600 25000 23300 RS72 100 39500 56700 51200 43600 CFUL627 1000 145400 194900 176600 159800 CFUL654 1000 114800 187800 170200 125900 CFUL600 1000 112800 185700 125200 165800 CFUL653 1000 62500 84400 76000 68800 CFUL628 1000 196300 246400 219900 217200 CFUL659 1000 112700 143600 127400 126200
Table 1 : Detector names, associated deposit masses and counting rates for different CR heights in the SC7 reactor.
3. The current-to-flux method
3.1. Principles
In order to maintain a constant power in a subcritical reactor, an external neutron source is used to constantly inject new neutrons inside the core. In many designs, the external source foreseen for ADS is a spallation target bombarded by high energy protons delivered by a particle accelerator whose beam line terminates at the core center. The reactivity of the reactor could then be monitored using the CTF method which is based on the proportionality existing between the thermal power of the reactor and the external neutron source intensity. This section is dedicated to the demonstration of this relationship. Let 𝑆 be the number of neutrons injected per second by the external source, then the total number of neutrons appearing in the reactor per second, 𝑁𝑡𝑜𝑡, is given by :
𝑁𝑡𝑜𝑡 = 𝑆
1−𝑘𝑠 (1)
where 𝑘𝑠 is the neutron source multiplication factor accounting for the source position and energy effects.
Since the difference 𝑁𝑡𝑜𝑡− 𝑆 is the number of neutrons created by fission, the number of fission
reactions, 𝑁𝑓𝑖𝑠𝑠𝑖𝑜𝑛𝑠, occurring per second inside the reactor reads: 𝑁𝑓𝑖𝑠𝑠𝑖𝑜𝑛𝑠 =𝑁𝑡𝑜𝑡−𝑆 𝜈 ̅ = 𝑆 𝜈 ̅ 𝑘s (1−𝑘s) (2)
where 𝜈̅ is the average number of neutrons released per fission. One can also introduce the source importance 𝜑∗ which accounts for the difference of multiplication of a source neutron compared to a fission neutron:
𝜑∗ = 𝑘s
1−𝑘s
1−𝑘𝑒𝑓𝑓
𝑘𝑒𝑓𝑓 (3)
where 𝑘𝑒𝑓𝑓 is the effective neutron multiplication coefficient of the reactor. So, one gets: 𝑁𝑓𝑖𝑠𝑠𝑖𝑜𝑛𝑠 =𝑆
𝜈 ̅𝜑
∗ 𝑘𝑒𝑓𝑓
1−𝑘𝑒𝑓𝑓 (4)
Finally, the thermal power of the reactor, 𝑃𝑤, is calculated by : 𝑃𝑤 = 𝑁𝑓𝑖𝑠𝑠𝑖𝑜𝑛𝑠 𝐸𝑓 = 𝑆
𝜈 ̅𝜑
∗ 𝑘𝑒𝑓𝑓
1−𝑘𝑒𝑓𝑓 𝐸𝑓 (5)
where 𝐸𝑓 is the mean energy released per fission. The reactor reactivity, , can then be easily related
to the neutron source intensity 𝑆 and 𝑃𝑤:
−𝜌 =𝑘𝑒𝑓𝑓−1 𝑘𝑒𝑓𝑓 = 𝑆 𝜈 ̅𝜑 ∗ 𝐸𝑓 𝑃𝑤 (6)
Besides, the reactor power is proportional to the total number of fissions per second and then to the neutron flux present inside the reactor, Φ. This one is estimated from the measurement of the counting rate, 𝑁𝑛, of a FC placed in the assembly:
𝑁𝑛 = 𝜀𝑑𝑒𝑡 〈𝜎𝑓〉 𝑁𝑌 Φ (7)
where 𝜀𝑑𝑒𝑡 is the absolute efficiency of the detector, 〈𝜎𝑓〉 is the deposit fission cross section averaged over the flux energy distribution in the reactor and 𝑁𝑌 is the number of atoms 𝑌 in the FC fissile deposit. So, if one can neglect variations of the neutron energy spectrum, the number of neutrons detected per second in a FC, Nn, is proportional to the reactor power. The proportionality between S
and Φ at a constant reactivity levelwas shown experimentally at the Yalina facility (Villamarin et al., 2009).
In the particular case of the GUINEVERE facility, as explained in section 2.3, the external neutron source intensity 𝑆 can be inferred from the measurement of the number of alpha particles 𝑁𝛼 detected
per second in the API detector.
Finally, the reactivity of the reactor can be determined from the measurements of 𝑁𝛼 and 𝑁𝑛: 𝜌 = 𝐶 𝑁𝛼
where C is a factor which gathers all the proportionality constants. The determination of this factor and the measurements on-line of the quantities Nα and Nn, allows monitoring on-line the evolution of the subcritical level of the reactor, assuming the proportionality constants do not change. To fulfill this assumption, the readjustment of the parameter C should be done on a regular basis with another absolute reactivity calibration method.
3.2. Practical reactivity monitoring
The practical procedure which was employed for the VENUS-F reactivity monitoring is described in this section. For a first configuration, numbered (1), the actual reactivity of the reactor, 𝜌1, can be determined thanks to an absolute calibration method such as that based on programmed beam interruptions for instance. In the case according to Equation (8), the proportionality factor, 𝐶, can be inferred from the beforehand measurement of 𝜌1 and from the measurement of the ratio 𝑁1𝑛
𝑁1𝛼 over a
time period short enough so that all parameters and especially the reactor reactivity 𝜌1 are stable: 𝐶 = 𝜌1
𝑁1𝑛
𝑁1𝛼 (9)
where 𝑁1𝛼 is the number of alpha particles detected per second in API and 𝑁1𝑛 is the number of
neutrons detected per second in one of the considered FCs, for the reactor configuration (1).
Assuming that 𝐶 remains unchanged, then if a subsequent reactor modification occurs, leading to a new reactivity value, 𝜌, the latter can be inferred from the new detector counting rates 𝑁𝛼 and 𝑁𝑛: 𝜌 = 𝐶𝑁𝛼 𝑁𝑛 = 𝜌1 𝑁1𝑛 𝑁1𝛼 𝑁𝛼 𝑁𝑛 (10)
Using Formula (10), it should be possible to monitor the evolution of the reactor subcritical level at any instant.
4. The current-to-flux experiment at the Guinevere facility
4.1. Methodology - Raw data
In order to test the CTF method, an experiment was carried out while VENUS-F was operated in the SC7 configuration (Fig. 1) with an almost constant beam intensity so that the external neutron source was stabilized. First, the reactor was kept about 30 minutes in a steady state with both CRs inserted. Then, both CRs were simultaneously withdrawn at a speed of 15 mm/s. The sequence of the measurements that followed was :
- (ii) then, insert or lift up one or both control rods at 15 mm/s, - (iii) repeat i and ii for nine more CR moves, one after the other.
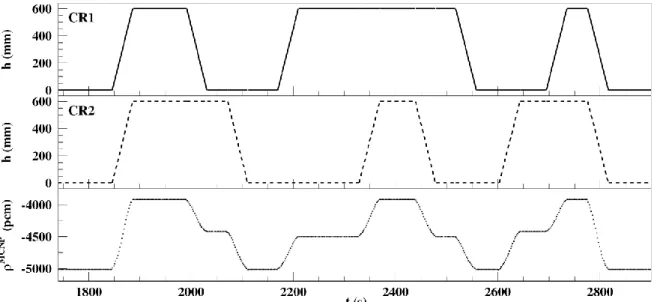
The whole manipulation sequence is illustrated in the two upper panels of Fig. 2 which presents the time variations of the CR1 and CR2 heights, in continuous and dashed lines, respectively. The full motion of a CR takes 40 s. In the lowest panel of Fig. 2, is shown the resulting time variation of the VENUS-F reactivity, ρMCNP, calculated with the MCNP 5.1.40 code (see section 5 for more details).
Fig. 2: Two upper panels: time evolution of the heights of CR1 (continuous line) and of CR2 (dashed line). Lower panel: calculated time evolution of the VENUS-F reactivity, 𝜌𝑀𝐶𝑁𝑃.
CR1 height (mm) CR2 height (mm) 𝝆𝑴𝑪𝑵𝑷 (pcm) 0 0 - 5013(5) 600 600 - 3918(5) 0 600 - 4425(5) 600 0 - 4496(5)
Table 2: The CR heights and associated VENUS-F reactivities, 𝜌𝑀𝐶𝑁𝑃, calculated with MCNP. The uncertainties on the last digit of 𝜌𝑀𝐶𝑁𝑃 are in parenthesis.
During the withdrawal or the insertion of any CR, logically, the reactor reactivity increases or decreases simultaneously as observed in the lowest panel. When both CRs are immobile, the reactor
The plateaus correspond to four different levels whose associated computed reactivities and CR positions are given in Table 2.
Fig. 3. For four representative FCs, time evolution of their neutron detection rates (time binning of 2 s), dead time corrected.
The temporal evolution of the neutron counting rates (dead time corrected), 𝑁𝑛(𝑡), of four representative FCs (with almost the same 235U deposit) are displayed in Fig. 3, with a time binning of 2 s. For clarity, the plots of CFUL628, CFUL600, CFUL659 are gathered on the same upper panel and those of CFUL654 and CFUL659, again, are presented in the lower panel. As expected, the rate variations are synchronized with those of the CR heights and so, with the reactivity evolution. The ratio of the fission rates of CFUL628 and CFUL659, both placed far away from the CRs, is quasi constant alongside the experiment. CFUL628 counts more than CFUL659 because the reactor core is not symmetric: more fuel assemblies are placed on the side of CFUL628 than that of CFUL659 (see Fig. 1). Although the counting rates of CFUL659, CFUL600 and CFUL654, are similar at the beginning of the experiment, i.e. when both CRs are at 0 mm, they subsequently evolve differently: the counting rate of CFUL600, which is near to CR1, becomes much higher than that of CFUL659 when CR1 is moved away from its initial position. The number of neutrons detected by these two FCs becomes again comparable each time CR1 is back to 0 mm. A similar behavior is observed for CFUL654 which is positioned nearby CR2. A local perturbation is induced by the motion of a CR, which has a strong impact on the detection rate of the FC positioned in its vicinity. Thus, one can
expect a strong dispersion of the reactivity estimations extracted from the fission rates of the various FCs since these rates depend on the detector distance to the CR which is moved.
4.2. Analysis of the experiment – Raw reactivities
The method presented in section 3 was applied in order to monitor the evolution of the VENUS-F reactivity as a function of time during the ten different motions of the CRs. To do so, the proportionality factor, 𝐶, (Formula (9)) was recalculated before each CR height modification during the reactor steady state, as if each CR motion was an independent experiment.
The methodology is as follows:
- (i) The reactivity 𝜌1,𝑖 (i = 1, 2…10) of each stable state is calculated with MCNP (Table 2). It is preferred to the reactivity value inferred from the BI technique in order not to introduce additional uncertainties due to another experimental method.
- (ii) the constant 𝐶𝑖 is calculated for each initial steady-state subcritical level (shown in Fig. 2) and for each of the nine detectors :
𝐶𝑖 = 𝜌1,𝑖 𝑁1𝑛,𝑖(𝑡)
𝑁1𝛼,𝑖(𝑡)= 𝜌1,𝑖 𝑓𝑖 (11)
where 𝑓 𝑖 is the result of the linear fit done over the plateau representing the ratio 𝑁1𝑛,𝑖(𝑡)
𝑁1𝛼,𝑖(𝑡) of the
counting rates measured during the ith reactor steady state.
Then, the change of the reactor reactivity due to the ith CR motion, is monitored using Equation (10): ρi(t) = Ci
Nα,i(t)
Nn,i(t) (12)
where Nn,i(t) is the counting rate of the considered FC and Nα,i(t) is the alpha detection rate, at each
instant t. The rate Nα,i(t), proportional to the external neutron source intensity, was quasi constant
during the experiment thanks to stable conditions of the accelerator. The raw values, ρi(t), were calculated at each time bin (of 2 s) on an arbitrary time interval ranging from a few minutes before the beginning of the ith CR movement (ith plateau) until a few minutes after the end of it ( (i+1)th plateau).
The experimental raw reactivity uncertainties, σρi(t), were determined assuming that all uncertainties on ρ1,i, f i, Nα,i(t) and Nn,i(t) are independent. Besides, a detailed study of them shows that the total
relative uncertainty always remains below 2% regardless of the detector or the CR motion considered, and that it is strongly dominated by the uncertainty on the alpha particle counting rates.
Fig. 4: For the VENUS-F SC7 configuration, experimental raw reactivity values, ρ(t), as a function of time, extracted from the responses of 4 FCs and for the three first CR motions. For each CR motion, vertical lines delimit the time intervals on which Formula (15) was applied, with a rescale of the constant 𝐶𝑖.
For the first three CR motions, Fig. 4 presents the time evolution of the experimental raw reactivity extracted from the responses of the same four FCs as for Fig. 3 since they are representative of all the other FCs and CR movements. The vertical lines delimit the time intervals on which Formula (12) was applied. Inspecting Fig. 4, it is clear that the CTF method enables to monitor the evolution of the reactor reactivity during the CR motions, but it is also blindly obvious that the detectors do not lead to the same sub-criticality estimates.
Let’s comment in more details the different plots:
a) CFUL659 and CFUL628, both far away from the CRs, give equivalent reactivity values at any time because the ratio between their detection rates is quasi constant during the whole experiment. For the forthcoming explanations, let’s take those two detectors as arbitrary reference (ref) ones.
b) At the beginning of each interval, the four FCs lead to similar reactivity levels because the proportionality factor Ci was rescaled before each CR motion.
c) Let’s consider region i = 1 of Fig. 4. While both CRs are lifted-up, the reactivities inferred from CFUL600 and CFUL654 (almost perfectly superimposed on each other) change with a bigger extent that those obtained from the ref FCs. After the CRs motions, the plateaus obtained for CFUL600 and CFUL654 correspond to a similar reactivity but the latter departs from that derived from the ref FCs.
After the examination of Fig. 3, and columns 3 and 4 of Table 1, these differences can be explained by the larger increase of the counting rates of the detectors close to the moving absorbent.
d) In region i = 2, during the insertion of CR1 (while CR2 remains immobile), only the reactivity estimated with CFUL600 is modified in a different way than that of the other FCs whose results are in agreement. This discordance stems from the larger decrease of the detection rate of CFUL600, compared to that of the other FCs which are installed at a larger distance from CR1 (see Fig. 3). e) For region i = 3, the same cause explains the behavior of CFUL654 in the proximity of CR2.
Fig. 5: For the VENUS-F SC7 configuration, experimental raw reactivities as a function of time, extracted from the responses of the nine FCs used and for the ten different CR motions.
The whole experiment was analyzed with the CTF method. Figure 5 illustrates the temporal evolution of the raw reactivities for the ten different actions successively executed on the CRs. The CTF method is able to track and monitor the reactivity deviations from the different initial states but a strong dispersion is observed among the raw results. The closer to the CR moved a detector is, the more its reactivity value departs from the results inferred from the other FCs. This strong spatial dependence signs the presence of space-energy effects at work in VENUS-F, as previously shown in Refs (Chevret et al., 2014, Chevret, 2016). Indeed, because of the 1/v absorption cross-section of 10B, absorption effects are larger for neutrons of lower energy. Therefore, the flux local depression in the vicinity of a CR is more pronounced for lower energy neutrons and this impacts the response of the FC nearby.
This local perturbation explains why the CTF reactivity values differ from one detector to another and depend on its relative distance to the CR in motion.
5. Correction of space-energy effects
5.1. Different types of simulations
In the previous section, a strong dispersion was observed among the raw reactivity estimates obtained with the CTF method. One possibility to correct for this bias, is to apply position dependent correction factors to the raw reactivities. These factors can be computed using a neutron transport code which gives access to the realistic space-energy neutron flux shape inside the reactor. In this study, they were evaluated using the Monte Carlo MCNP 5.1.40 code (MCNP, 2003). The nuclear data library ALEPH-LIB-JEFF3.1 prepared by SCK/CEN (W. Haeck and B. Verboomen, 2006) was used for all the computations.
A simplified geometry of the VENUS-F reactor was developed in order to reduce the duration of the simulations. The most important modifications were:
- (a) the homogenization of the content of the fuel assemblies;
- (b) the simplification of the POAR rod, the CR and safety rods (SR) geometries;
- (c) The GENEPI -3C beam pipe was not included in the geometry, and air was replaced by vacuum. The concrete walls of the bunker and the surroundings (some flanges and metallic structures nearby the vessel) of the reactor were also modeled. Indeed, the analysis presented in Refs (Chevret et al., 2014) proved the necessity to include these elements in the simulations.
Two types of simulations were carried out:
- (i) criticality calculations (MCNP kcode) were performed to estimate the reactivity of four initial steady states of the VENUS-F SC7 reactor. They are gathered in Table 2 with the corresponding CR positions. Later on, they will be designated by 𝜌1𝑘𝑐𝑜𝑑𝑒𝑀𝐶𝑁𝑃. For each of these initial reactor state, fourteen additional simulations were done by changing by steps of 30 mm or 60 mm, between 0 mm and 600 mm, the height(s) of the CR(s) which is (are) moved. Doing so, fourteen reactivities are calculated in order to have the VENUS-F subcritical level during each considered CR insertion or withdrawal. These values will be named hereafter, 𝜌𝑘𝑐𝑜𝑑𝑒𝑀𝐶𝑁𝑃 . - (ii) fixed-source calculations conducted with 14-MeV neutrons emitted from the core center
were done to provide the fission rates of each FC used during the experiment. This was done for all the reactor configurations simulated in point (i). Hereafter, 𝑁1𝑛𝑀𝐶𝑁𝑃 and 𝑁𝑛𝑀𝐶𝑁𝑃
symbolize the detector rates associated, respectively, to the initial considered reactor reactivity, 𝜌1𝑘𝑐𝑜𝑑𝑒𝑀𝐶𝑁𝑃, and to the other VENUS-F reactivities (corresponding to other CR heights), 𝜌𝑘𝑐𝑜𝑑𝑒𝑀𝐶𝑁𝑃. Some extra assumptions were made to compute the fission rates of the FCs. First, the detectors were not modeled in the MCNP geometry. The FC counting rates were estimated by simply folding the neutron energy flux at the FC position with the energy-dependent 235U fission microscopic
cross-section. Second, in order to reduce the simulation variance, the flux was averaged on a cylinder of 30 cm in height, centered on the actual detector places.
This approach was tested by comparing the correction factors obtained for another configuration (the SC1 configuration) with those computed with a thorough description of the VENUS-F reactor
(Uyttenhove, 2009). No statistically significant difference was observed.
With all these different calculations, we have at our disposal a set of pseudo-data simulating the experimental measurements done during the CTF experiment.
5.2. Determination of the corrected reactivity values.
If one analyzes the pseudo-data determined with the MCNP simulations in the same manner as for the experiment, using the CTF Formulae (11) and (12), a reactivity value can be calculated for each specific position of the CRs and for each FC, as follows:
𝜌𝑐𝑡𝑓𝑀𝐶𝑁𝑃 = 𝜌1𝑘𝑐𝑜𝑑𝑒𝑀𝐶𝑁𝑃 𝑁1𝑛𝑀𝐶𝑁𝑃
𝑁𝑛𝑀𝐶𝑁𝑃 (13)
The subscript “ctf” stands for current-to-flux method. Then, the following differences are evaluated:
ρctfMCNP− ρ1kcodeMCNP = ∆ρdistortedMCNP (14)
ρkcodeMCNP− ρ1kcodeMCNP = ∆ρtrueMCNP (15)
Each ∆ρdistortedMCNP value can be regarded as the “CTF distorted value” of the reactivity variation because it is derived from the computed fission rates which are position-dependent (as seen the experimental data). On the contrary, the difference ∆ρtrueMCNP can be regarded as the “true” value of the reactivity variation because it is inferred from the keff values computed with a fundamental fission source
distribution.
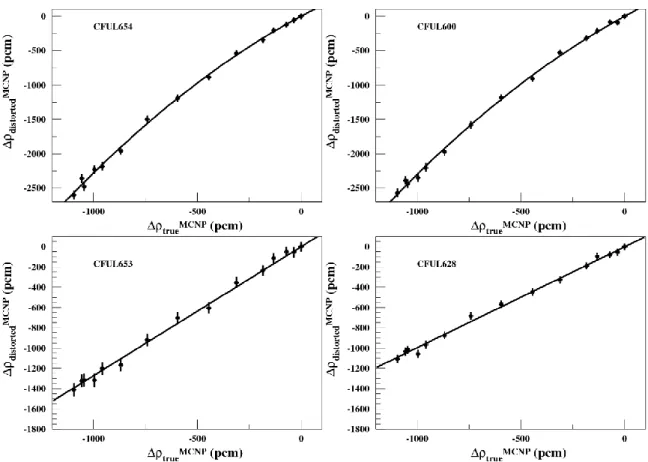
The couples, (∆ρdistortedMCNP , ∆ρtrueMCNP), were determined for each detector and for each CR height. For the simultaneous insertion of both CRs, such points, (∆ρdistortedMCNP , ∆ρtrueMCNP), are presented as dots in Fig. 6 for four FCs. These are representative examples. For all detectors, a clear correlation is observed between the “CTF distorted” and the “true” reactivity variations.
Fig. 6: For the SC7 configuration, for the simultaneous insertion of CR1 and CR2 inside the core, for four FCs, ∆ρdistortedMCNP values as a function of ∆ρtrueMCNPvalues (dots) and their associated fitted curves.
Depending on the FC considered, the plots were fitted with a linear or a quadratic function with no constant term:
∆𝜌𝑑𝑖𝑠𝑡𝑜𝑟𝑡𝑒𝑑𝑀𝐶𝑁𝑃 = 𝑏𝐹𝐶 ∆𝜌𝑡𝑟𝑢𝑒𝑀𝐶𝑁𝑃 (16)
or
∆𝜌𝑑𝑖𝑠𝑡𝑜𝑟𝑡𝑒𝑑𝑀𝐶𝑁𝑃 = 𝑎𝐹𝐶 (∆𝜌𝑡𝑟𝑢𝑒𝑀𝐶𝑁𝑃)2+ 𝑏
𝐹𝐶 ∆𝜌𝑡𝑟𝑢𝑒𝑀𝐶𝑁𝑃 (17)
These polynomial functions were determined for each specific action on the CR(s) and for each detector. Using the inverse functions, the “true” value can be calculated from the “distorted” one. In the same way, the experimental distorted variation ∆ρdistorteddata can be calculated at each time bin, for each detector:
∆ρdistorteddata (t) = ρi(t) − ρ1,i (18)
where ρi(t) and ρ1,i calculations are described in points (i) and (ii) of section 4.2.
Now, assuming that data and simulations suffer from the same space-energy effects, we tentatively use the simulated correction functions to assess the corrected variation, ∆ρtruedata(t), for any experimental distorted value:
∆ρtruedata(t) = 1 bFC∆ρdistorted data (t) (19) or, ∆ρtruedata(t) =−bFC+√ bFC 2 + 4 a FC ∆ρdistorteddata (t) 2aFC (20)
Finally, the corrected experimental reactivity value, ρicor(t), at each time bin and for each detector, can be estimated:
ρicor(t) = ∆ρtruedata(t) + ρ
1,i (21)
Its associated uncertainty, σρ
i
cor, is evaluated by quadratic summation of the uncertainties σρ
1,i (given
in parenthesis in Table 2), and σ∆ρ
true
data. For the calculation of σ∆ρ true
data, the contribution related to the
experimental raw reactivity uncertainty is combined with those on the fit parameters( aFC and bFC ), and their correlations.
6. Application to the analysis of the experiment
6.1. Corrected reactivities
Fig. 7: For the VENUS-F SC7 configuration, experimental corrected reactivity values ρ𝑐𝑜𝑟 as a function of time, extracted from the responses of the nine FCs used and for the whole sequence (ten different) of CR motions.
The technique developed to correct the experimental raw reactivities was presented in the preceding section 5. The resulting corrected reactivities are depicted, as a function of time, in Fig. 7. It is remarkable how well, after the correction, the results extracted for the nine detectors superimposed on each other, for the ten different CR motions. The comparison between Fig. 5 and Fig. 7 underlines the performance of the correction procedure to compensate the discrepancies which were observed before its application. Moreover, a study of the relative uncertainties on the corrected reactivities shown that they remain lower than 3%, for all the CR movements and all the FCs.
6.2. Accuracy of the results
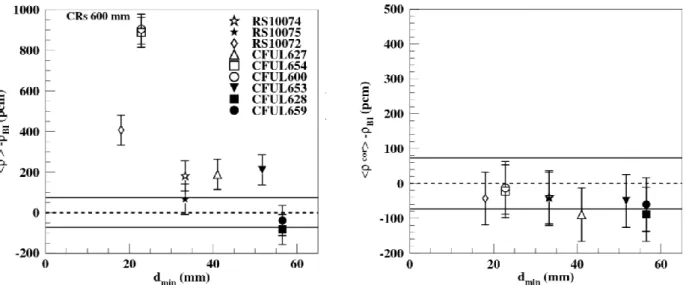
We now address the question of the accuracy of the CTF method coupled to the correction procedure by comparing the CTF results with the absolute reactivities extracted with the BI method. Indeed, for the same reactor configuration, SC7, experiments were also performed with beam interruptions of 2 ms every 25 ms. The BI reactivity values were estimated to ρBI = -5261(96) pcm and ρBI = -4096(73) pcm for both CRs positioned at 0 mm and 600 mm, respectively. To answer the question, when applying the CTF method to the simultaneous CR withdrawal data, the BI value estimated at 0 mm was used as the absolute subcritical level of the initial reactor steady state in Formulae (11) and (21), instead of the MCNP value ρ1,i (see point (i) of section 4.2 and section 5.2). The resulting raw CTF reactivities were then corrected with the same polynomial functions as those described in the preceding analysis. The final raw and corrected CTF reactivities reached at 600 mm were then inferred by fitting the corresponding plateau. These fitted values 〈ρ〉 and 〈ρcor〉 are compared to the absolute BI one in Fig. 8, where the differences 〈ρ〉 − ρBI and 〈ρcor〉 − ρ
BI are presented as a function of the distance
between the considered FC and the nearest CR. The continuous lines give the uncertainty domain of the ρBI value. The dashed line indicates the possible best agreement between 〈ρ〉 or 〈ρcor〉, and ρ
BI.
Looking at the raw results, a general tendency emerges: the difference between the CTF and BI reactivity values is all the more pronounced so as the FC is close to the moving CR, and so likely impacted by a local flux perturbation. The difference can reach up to 900 pcm. After correction, the CTF reactivity values are in very good agreement with the BI one and the dispersion among the results is lower than 90 pcm. It is worth noticing that the CTF reactivity values extracted for CFUL659 and CFUL628 are comparable to the BI one even without correction. As expected, for detectors placed far away from a local flux perturbation, the CTF method is a robust technique to assess the reactor sub-critical level, if the factor Ci can be rescaled often enough to be representative of the core conditions. For both CRs at 600 mm, the corrected CTF reactivity value averaged on the nine FCs, ρ̅̅̅̅̅ = -cor
4143(22) pcm, is in very good agreement with the absolute BI reactivity value. The same study was done for the CR insertion data and the same conclusions were drawn.
Fig. 8: For the SC7 configuration and for the subcritical level reached at 600 mm, the difference between the BI reactivity value, ρBI, and the CTF value, as a function of the distance between the considered FC and the nearest CR. The left and right panels are the differences inferred, respectively, from the raw reactivities, 〈𝜌〉, and from the corrected ones, 〈ρcor〉. The continuous lines give the uncertainty domain of the ρBI values. The dashed line indicates the possible best agreement between 〈ρ〉 or 〈ρcor〉, and ρBI.
To conclude with, when it is coupled to a correction procedure and based on an initial absolute reactivity level inferred from the BI method, the CTF method enables the continuous monitoring of the reactor reactivity with accuracy and a precision comparable to the BI technique. Of course, this ability is true only when the perturbations which trigger the reactivity variation are known in advance so that several Monte Carlo simulations, each based on a static calculation representing the status of the subcritical reactor at specific time during the transient, can be done beforehand to generate the required correction functions. On the other hand, the analysis pointed out that no correction procedure is required for detectors placed far enough from the perturbation at the root of the reactivity modification. Such detector give then access directly to reliable reactivity values. A similar result was obtained for the KIPT facility but with numerical simulations (Cao et al, 2015). A static modal analysis with the TU Delft DALTON code (Uyttenhove et al., a-2014) also emphasized that in some locations of VENUS-F, detectors would be less sensitive to space-energy effects when CRs are moved
7. Robustness of the “current-to-flux” method coupled to the
correction procedure
7.1. Sensitivity to the VENUS-F geometry description
In order to test the sensitivity of the correction procedure to the simplifications made on the VENUS-F reactor modeling in the MCNP simulations, the polynomial correction functions were recalculated in the same manner as for the simplified geometry but using a thorough description of the reactor. The raw reactivity values and the technique employed to correct them remain identical to those described in Sections 4.2 and 5.2. The two MCNP models being quite different, for an identical CR height, the simulated reactivities differ by about 570 pcm. Consequently, the detector count rates are also modified. The question is to know whether the correction functions are impacted or not. From the CR withdrawal data, the experimental CR worths, W, were inferred. Fig. 9 presents the W values obtained from the raw reactivities (solid black points) and from the reactivities corrected with the procedure based either on the simplified VENUS-F description (open squares) or on the detailed reactor modeling (open triangles). Some errors bars are not visible because of the symbol size.
Fig. 9: For the SC7 reactor configuration, reactivity worth of both CRs, W, as a function of the FC obtained from the raw reactivities (solid black points) and from the reactivities corrected with the procedure based either on the simplified VENUS-F model (open squares) or on the detailed reactor modeling (open triangles).
An overall agreement between the corrected CR worths inferred from the two VENUS-F models is observed. One notices a larger difference between the corrected worths of the two detectors that needed the largest corrections, owing to their proximity to the moving CRs, but which remains lower than 90 pcm. The same agreement was obtained for the corrected W values extracted from the study of the CR insertion data. The correction functions are thus almost insensitive to the 570 pcm reactivity difference between both models and to the reactor modeling in the MCNP simulations. This can be explained by the fact that they are based on reactivity variations (∆ρdistortedMCNP , ∆ρtrueMCNP) instead of on reactivity values (ρctfMCNP, ρkcodeMCNP) and that the macroscopic flux shapes remain very similar for both models although the reactivities and geometries are different.
7.2. Sensitivity to the B
4C density implemented in the simulations
The sensitivity of the correction technique to an important MCNP simulation input parameter has also to be addressed. This one is the density of the boron carbide (B4C) filling the CRs. Indeed, for a given
CR height, the flux shape in the vicinity of the CRs, the computed reactivities and detector counting rates will differ when the absorbent worth of the CRs is modified. However, as in the previous section, it has to be verified that the resulting differences between the correction functions are negligible. To investigate this, the B4C density was changed by a factor of ± 10 % in the MCNP simulations based
on the semi-homogeneous VENUS-F geometry. The polynomial function were determined for the simultaneous withdrawal of both CRs. Examples of reactivities, ρMCNP, calculated at 0 mm or 600 mm, and CR worths, WMCNP, are summed up in Table 3. The CR reactivity worth increases with the
density of B4C: there is a difference of 122(6) pcm between the results retrieved from the two extreme
densities (CRs at 0 mm).
CR height d = 2.232 g/cm3 d = 2.480 g/cm3 d = 2.728 g/cm3
ρMCNP (pcm) 0 mm -4950(4) -5013(5) -5072(4)
ρMCNP (pcm) 600 mm -3915(4) -3918(5) -3931(4)
WMCNP (pcm) 1035(6) 1095(7) 1141(6)
Table 3: For three different B4C densities, VENUS-F reactivities calculated for two CR heights (600 mm and 0 mm) and CR worths, WMCNP, obtained with MCNP simulations using the simplified geometry.
The corrected experimental CR worths, W, are presented in Fig. 10. One sees that they are all statistically compatible over an interval of 90 pcm. This means that the polynomial functions are almost
insensitive to a reasonable variation of the B4C density implemented in the MCNP simulations. These
results point out the robustness of the correction technique relatively to this parameter.
Fig. 10: For the SC7 reactor configuration, corrected experimental reactivity worth of both CRs, W, as a function of the FC. The stars, squares and triangles are related to a B4C density equal to, respectively, d = 2.232 g/cm3, d = 2.480 g/cm3, and d = 2.728 g/cm3(for the initial 235U enrichment).
8. Summary
The “current-to-flux” method has been tested by monitoring the relative evolution of the reactivity of the VENUS-F reactor during the motions of the CRs at a speed of 15 mm/s, after the stabilization of the reactor at various steady states. The reactor was driven by a continuous beam and was operated in the SC7 configuration characterized by a neutron multiplication coefficient domain of keff 0.95 -
0.96. It was observed that the raw CTF reactivity values retrieved from the nine fission chambers were scattered over 1000 pcm. It was concluded that this dispersion was the sign of the presence of space-energy effects in the reactor. By means of MCNP simulations, polynomial functions were built in order to correct the raw biased results. It was underlined that, when the CTF method is completed with the correction procedure and when it is based on initial absolute subcritical levels inferred from an absolute reactivity calibration method such as the BI technique, it gives continuously access to the variation of the reactivity in an absolute way, for any detector position inside the reactor. Thus the spatial dependence can be corrected, leading to a dispersion among the corrected results lower than 90 pcm.
It was also highlighted that for the FCs placed far away from the CRs , i.e. far from the source that triggers the reactivity change, the CTF reactivities were obtained with an accuracy and a precision comparable to the BI technique without the need of any correction. In the case of a pre-defined transient, the corrections functions can be calculated in advance so that the measured raw CTF relative reactivities can be corrected during the execution of the transient in the subcritical reactor. In this specific case and for an initial absolute reactivity level, the CTF method is then capable to monitor the reactivity on-line with accuracy. Furthermore, for a pre-defined reactor configuration or transient, simulations can help to identify potential detector locations which enable the strongest reduction of the space-energy effects and so, where the need for the application of correction factors could be reduced or eliminated. However, in practice, technical or design constraints can render these theoretical optimal positions unavailable or unendurable by current neutron detectors. Of course, for no-predefined reactor perturbations, because of its spatial sensitivity, the CTF technique will track only a deviation of the reactivity relatively to an initial sub-critical level. That’s why the use of the CTF method should be limited to short period bounded by absolute reactivity measurements performed with other absolute calibration methods. Moreover, the robustness of the correction technique was tested by changing the degree of simplification of the reactor geometry modeling in the MCNP simulations and by changing the density of the B4C filling the CRs. Whatever the test investigated, the
application of the correction procedure led to a scattering among the detectors of the corrected CR worths lower than 90 pcm. This analysis points out the robustness of the CTF method when it is coupled to a correction procedure.
9. Acknowledgments
This work was partially supported by the 6th Framework Programs of the European Commission (EURATOM) through the EUROTRANS-IP contract # FI6W-CT-2005-516520, and the French PACEN and NEEDS programs of CNRS. The authors want to thank the VENUS reactor and GENEPI-3C accelerator technical teams for their help and support during experiments.
10. References
Abderrahim et al, 2010. H. A. Abderrahim et al., “MYRRHA, a Multipurpose hYbrid Research
Reactor for High-end Applications”, Nuclear Physics News, Volume 20, Issue 1, 2010.
Baeten et al., 2003. P. Baeten, H. Ait Abderrahim, “Reactivity monitoring in ADS, application to the MYRRHA ADS project », Progress in Nuclear Energy, Volume 43, Issues 1–4,2003, Pages 413-419.
Baylac et al, 2009. M. Baylac et al., “The GENEPI-3C Accelerator for the GUINEVERE Project”, Proc. of the International Topical Meeting on Nuclear Research Applications and Utilization of Accelerators (AccApp ’09), 4-8 May 2009, Vienna (Austria).
Billebaud et al, 2009. A. Billebaud et al., “The GUINEVERE Project for Accelerator Driven System Physics”, Proceedings of global 2009”, Paris, France (September 6-11,2009).
Billebaud et al.,2013. A. Billebaud, A. Kochetkov, S. Chabod, X. Doligez, G. Lehaut, F. R. Lecolley, J. L. Lecouey, N. Marie, F. Mellier, V. Bécares, D. Villamarin, G. Vittiglio, H.-E. Thyébault, W. Uyttenhove, J. Wagemans, FREYA Deliverable D1.1, 2013.
Cao et al, 2015. Yan Cao, Yousry Gohar, Zhaopeng Zhong, “Measuring and monitoring KIPT Neutron Source Facility Reactivity », technical report of the Argonne National Laboratory, DOI: 10.2172/1224197, 2015.
Chevret et al., 2014. T. Chevret et al. "Reactivity Measurement of the Lead Fast Subcritical VENUS-F Reactor Using Beam Interruption Experiments”, Proceedings of PHYSOR 2014, The Role of Reactor Physics Toward a Sustainable Future, Kyoto, Japan, September 28th – October 3rd, 2014, to be published.
Chevret, 2016. T. Chevret, thèse de doctorat, "Mesure de la réactivité de réacteurs sous-critiques pilotés par accélérateur par l'analyse d'expériences d'interruptions de faisceau programmées", Université de Caen-Normandie, 2016.
Bécares et al, 2013. V.Bécares, D.Villamarín, M.Fernández-Ordóñez, E.M.González Romero, C.Berglöf, V.Bournos, Y.Fokov, S.Mazanik, I.Serafimovich, “Validation of ADS reactivity monitoring techniques in the Yalina-Booster subcritical assembly “, Annals of Nuclear Energy, Volume 53, March 2013, Pages 331-341
Haeck and Verboomen, 2006. W. Haeck and B. Verboomen, ALEPH-DLG 1.1.0 - Creating Cross Section Libraries for MCNP(X) and ALEPH, Technical Report NEA/JEFF/DOC-1125, OECD/NEA, 2006.
James. F. James, MINUIT – Function Minimization and Error Analysis, CERN Geneva, Switzerland Program Library entry D506.
Kochetkovet al., 2013. A. Kochetkovet al., "Current progress and future plans of the FREYA Project", NEA/NSC/DOC, 7 (2013-05-21) pp.78-87, International Workshop on Technology and Components of Accelerator Driven Systems (TCADS) OECD Nuclear Energy Agency, 2013-05-21, Nantes, fr.
Lensa et al., 2008. Lensa, W.v., Nabbi, R., Rossbach, M., 2008. RED-IMPACT – impact of partitioning, transmutation and waste reduction technologies on the final nuclear waste disposal – synthesis report. Schriften des Forschungszentrums Jülich – Reihe Energie & Umwelt 15.
Marie et al., 2013. N. Marie, G. Lehaut, J.L. Lecouey, A. Billebaud, S. Chabod, X. Doligez, F.R. Lecolley, A. Kochetkov, W. Uyttenhove, G. Vittiglio, J. Wagemans, F. Mellier, G. Ban, H.E. Thyébault, D. Villamarin, “Reactivity monitoring using the area method for the subcritical VENUS-F core within the framework of the FREYA Project”, International Workshop on Technology and Components of Accelerator Driven Systems (TCADS2) OECD Nuclear Energy Agency, France (2013)
MCNP, 2003. MCNP - A General Monte Carlo N-Particle Code, Version 5, ORNL, RSICC LA-UR-03-1987, Los Alamos National Laboratory (2003).
Mellier et al., 2005. Mellier, F., et al., 2005. The MUSE experiments for sub-critical neutronics validation. Deliverable no. 8: final report. 5th Euratom Framework Programme Contract No. FIKW-CT-2000-00063.
OECD-NEA, 2002. Accelerator-Driven Systems (ADS) and fast reactors (FR) in advanced nuclear fuel cycles: a comparative study. Tech. Rep. NEA-3109.
NEA-Uyttenhove, 2009. W. Uyttenhove, MCNP VENUS-F core model, version 3.1, October 26, 2010, based on W. Uyttenhove, P. Baeten, and A. Kochetkov, GUINEVERE : Experimental Programme – Description of the VENUS-F Reactor for Neutronics Calculations, Technical Report R-4914, SCK•CEN, 2009.
Uyttenhove, 2016. W. Uyttenhove, “Reactivity Monitoring of Accelerator-Driven Nuclear Reactor Systems », doctoral thesis, doi.org/10.4233/uuid:233dee24-be56-4534-aa3d-e325fe433a38
Uyttenhove et al, a-2014. W. Uyttenhove, P. Baeten, A. Kochetkov, G. Van den Eynde, G. Vittiglio and J. Wagemans, D. Lathouwers, J.-L. Kloosterman and T.H.J.J. van der Hagen, A. Billebaud and S. Chabod, F. Mellier, J.-L. Lecouey, F.-R. Lecolley, G. Lehaut and N. Marie, X. Doligez, M. Carta, V. Bécares, D. Villamarin, “Static modal analysis of the current-to-flux subcriticality monitor for accelerator-driven systems”, PHYSOR 2014 - The Role of Reactor Physics toward a Sustainable
Future, The Westin Miyako, Kyoto, Japan, September 28 - October 3, 2014, on CD-ROM (2014)
Uyttenhove et al, b-2014. W. Uyttenhove, D. Lathouwers, J.-L. Kloosterman, T.H.J.J. Van der Hagen, G. Van den Eynde, P. Baeten, ” Methodology for modal analysis at pulsed neutron source experiments in accelerator-driven systems”, Annals of Nuclear Energy, Volume 72, October 2014, Pages 286-297.
Villamarin et al, 2009. Villamarin et al., “Current-to-flux experimental results in the YALINA-booster subcritical assembly”. In: Ninth International Topical Meeting on Nuclear Research Applications and Utilization of Accelerators (AccApp’09). Vienna, Austria, 4-8 May 2009.