HAL Id: hal-01179563
https://hal.archives-ouvertes.fr/hal-01179563v2
Submitted on 4 Aug 2015
HAL is a multi-disciplinary open access
archive for the deposit and dissemination of
sci-entific research documents, whether they are
pub-lished or not. The documents may come from
teaching and research institutions in France or
abroad, or from public or private research centers.
L’archive ouverte pluridisciplinaire HAL, est
destinée au dépôt et à la diffusion de documents
scientifiques de niveau recherche, publiés ou non,
émanant des établissements d’enseignement et de
recherche français ou étrangers, des laboratoires
publics ou privés.
Across Several Distant Warm-Blooded Vertebrates
Through Comparative Transcriptomics
Thien-Phong Vu Manh, Jamila Elhmouzi-Younes, Celine Urien, Suzana
Ruscanu, Luc Jouneau, Mickaël Bourge, Marco Moroldo, Gilles Foucras, Henri
Salmon, Hélène Marty, et al.
To cite this version:
Thien-Phong Vu Manh, Jamila Elhmouzi-Younes, Celine Urien, Suzana Ruscanu, Luc Jouneau, et
al.. Defining Mononuclear Phagocyte Subset Homology Across Several Distant Warm-Blooded
Verte-brates Through Comparative Transcriptomics. Frontiers in Immunology, Frontiers, 2015, 6, pp.299.
�10.3389/fimmu.2015.00299�. �hal-01179563v2�
Edited by:
Shalin Naik, Walter and Eliza Hall Institute, Australia
Reviewed by:
Christophe Jean Desmet, University of Liege, Belgium Richard A. Kroczek, Robert Koch-Institute, Germany
*Correspondence:
Thien-Phong Vu Manh and Marc Dalod, Centre d’Immunologie de
Marseille-Luminy, Parc Scientifique et Technologique de Luminy, Case 906, Marseille Cedex 9 F-13288, France [email protected]; [email protected] Isabelle Schwartz-Cornil, UR892, Virologie et Immunologie Moléculaires, INRA, Domaine de Vilvert, Jouy-en-Josas Cedex 78352, France [email protected]
†Present address:
Jamila Elhmouzi-Younes, CEA, Division of Immuno-Virology, IDMIT Center, Institute for Emerging Diseases and Innovative Therapies (iMETI), DSV, Fontenay-aux-Roses, France ‡Thien-Phong Vu Manhand
Jamila Elhmouzi-Younes have contributed equally to this work.
§Senior co-authorship
Specialty section:
This article was submitted to Antigen Presenting Cell Biology, a section of the journal Frontiers in Immunology
Received: 20 March 2015 Accepted: 25 May 2015 Published: 19 June 2015 Citation: Vu Manh T-P, Elhmouzi-Younes J, Urien C, Ruscanu S, Jouneau L, Bourge M, Moroldo M, Foucras G, Salmon H, Marty H, Quéré P, Bertho N, Boudinot P, Dalod M and Schwartz-Cornil I (2015) Defining mononuclear phagocyte subset homology across several distant warm-blooded vertebrates through comparative transcriptomics. Front. Immunol. 6:299. doi: 10.3389/fimmu.2015.00299
Defining mononuclear phagocyte
subset homology across
several distant warm-blooded
vertebrates through comparative
transcriptomics
Thien-Phong Vu Manh1,2,3*‡, Jamila Elhmouzi-Younes4 † ‡, Céline Urien4, Suzana Ruscanu4, Luc Jouneau4, Mickaël Bourge5, Marco Moroldo6, Gilles Foucras7,8, Henri Salmon9,10, Hélène Marty9,10, Pascale Quéré9,10, Nicolas Bertho4, Pierre Boudinot4, Marc Dalod1, 2,3*§ and Isabelle Schwartz-Cornil4*§
1 UM2, Centre d’Immunologie de Marseille-Luminy, Aix Marseille Université, Marseille, France, 2 U1104, INSERM, Marseille, France, 3 UMR7280, CNRS, Marseille, France, 4 UR892, Virologie et Immunologie Moléculaires, INRA, Domaine de Vilvert, Jouy-en-Josas, France, 5 IFR87 La Plante et son Environnement, IMAGIF CNRS, Gif-sur-Yvette, France, 6 CRB GADIE, Génétique Animale et Biologie Intégrative, INRA, Domaine de Vilvert, Jouy-en-Josas, France, 7 UMR1225, Université de Toulouse, INPT, ENVT, Toulouse, France, 8 UMR1225, Interactions Hôtes-Agents Pathogènes, INRA, Toulouse, France, 9 UMR1282, Infectiologie et Santé Publique, INRA, Nouzilly, France, 10 UMR1282, Université François Rabelais de Tours, Tours, France
Mononuclear phagocytes are organized in a complex system of ontogenetically and functionally distinct subsets, that has been best described in mouse and to some extent in human. Identification of homologous mononuclear phagocyte subsets in other vertebrate species of biomedical, economic, and environmental interest is needed to improve our knowledge in physiologic and physio-pathologic processes, and to design intervention strategies against a variety of diseases, including zoonotic infections. We developed a streamlined approach combining refined cell sorting and integrated comparative transcriptomics analyses which revealed conservation of the mononuclear phagocyte organization across human, mouse, sheep, pigs and, in some respect, chicken. This strategy should help democratizing the use of omics analyses for the identification and study of cell types across tissues and species. Moreover, we identified conserved gene signatures that enable robust identification and universal definition of these cell types. We identified new evolutionarily conserved gene candidates and gene interaction networks for the molecular regulation of the development or functions of these cell types, as well as conserved surface candi-dates for refined subset phenotyping throughout species. A phylogenetic analysis revealed that orthologous genes of the conserved signatures exist in teleost fishes and apparently not in Lamprey.
Keywords: comparative biology, immunology, dendritic cells, monocytes, macrophages, genomic and bio-informatic methods
introduction
Reaching the global health objective requires to improve disease prevention and treatments in humans and in a wide variety of animal species. To achieve that goal, knowledge of the immune system, and particularly of the mononuclear phagocyte system that orchestrates the immune response, needs to be translated across species in order to develop better vaccines and immune response-targeting therapies in relevant species.
The mononuclear phagocytes encompass three main functional cell types: monocytes (Mo), macrophages (MP), and DC. The main functions of Mo are to patrol the body to detect infections and to produce microbicidal compounds including TNF, superoxide, or nitric oxide intermediates, or to differentiate into MP. The main function of MP is to preserve tissue homeostasis through trophic and scavenger functions. DCs are professional antigen-presenting cells that are key instructors of immunity, controlling tolerance to self and immune defense against pathogens. However, beyond these generic definitions, each of these mononuclear phagocyte category encompasses a complex array of different subtypes with distinct ontogeny and functions, as described extensively in mice and to some extent in humans. Mo include at least two main subsets, classical Mo (cMo) and non-classical Mo (ncMo) (1), that express different innate immune recognition receptors and mediate distinct func-tions, with ncMo showing the original property of patrolling blood vessels (2). Adult MP are derived either from embryonic precursors and self-renew in tissues, or in some cases are replenished from circulating Mo (2–6). The MP subtypes populating different tissues show distinct molecular and functional characteristics which are in a large part determined by their anatomical microenvironment (7, 8). Two cell types with morphologic and functional features of DC derive from the Mo/MP lineage, namely monocyte-derived DC (MoDC) and Langerhans cells (9). MoDC are generated (i) upon inflammatory stimuli in vivo (10), (ii) at steady-state in the skin (3), and (iii) upon culture of purified Mo or of total bone marrow cells with GM-CSF ± IL-4 in vitro (11, 12). Langerhans cells derive from embryonic monocytic precursors upon IL-34 signaling and populate the outer layer of epithelia (13). Finally, three types of bona fide DC exist, the plasmacytoid DC (pDC) and the conventional DC (cDC) cDC1 and cDC2 types which derive from a bone marrow common DC precursor and are present both in lymphoid organs and as interstitial DC in the parenchyma of non-lymphoid tissues such as skin, lung, gut, and liver (14). Comparative transcriptomic analyses pioneered by us and used by other groups, as well as functional studies, have demonstrated the existence of similar mononuclear phagocytes and DC subsets between human and mice (15–20). DC subset candidates have also been described in other mammals such as in ruminants and pigs. However, no systematic study has demonstrated the existence of a framework of homologous DC subsets throughout distant species [for review see Ref. (21)]. Overall, it remains unknown whether a similar diversity in mononuclear phagocyte subsets exists across distant mammals and vertebrates, and when during evolution this complex organization of the mononuclear phagocyte system arose. The combination of phenotypic, functional, and ontogenic studies used in the mouse model cannot be used to define cell subsets in most other species of interest due to technical, financial,
or ethical limitations. As the ontogeny and functions of cell types are instructed by specific gene-expression modules, cell type identity can be defined by its molecular fingerprinting (22). We thus reasoned that mononuclear phagocyte subset identity could be defined by gene-expression profiling, whatever the species. In addition, cell types that are homologous between species must exhibit closer molecular fingerprints and gene-expression pro-grams than non-homologous cell types, based on the definition of homologous cell types as “those cells that evolved from the same precursor cell type in the last common ancestor” (23).
In this paper, we developed a streamlined approach (see Figure S1 in Supplementary Material) to identify homologous mononuclear phagocyte subsets in distant species with refer-ence to the mouse, consisting in (i) designing antibody panels for sorting candidate cell subsets to high marker-based purity, (ii) generating genome expression profiling of the sorted cell subsets, and (iii) performing computational transcriptomic analyses to establish gene signatures and compare them to the transcriptomic fingerprints of the well-characterized immune cell types of the mouse referent species. Our analysis was extended to chicken cell subsets, showing that it is amenable to establish mononuclear phagocyte subset homology throughout vertebrates. We also derived gene-expression signatures and gene interaction networks that are selectively expressed in mononuclear phagocyte subsets in a conserved manner throughout distant mammals and that can be used to identify homologous subsets throughout spe-cies. The conserved gene-expression signatures and networks not only encompassed genes with known functions in mononuclear phagocyte subsets but also pointed out novel candidate genes likely involved in the ontogeny or functional specialization of these cell types. Finally, we conducted a phylogenetic analysis to examine the presence in bony fishes and in Lamprey of orthologs of genes from the transcriptomic signatures identified in mammals.
Materials and Methods
Pigs and sheep for Blood collection
All animal experiments were carried out under licenses issued by the Direction of the Veterinary Services of Versailles (accreditation numbers B78-93) and under approval of the Committee on the Ethics of Animal Experiments of AgroParisTech and INRA-Jouy-en-Josas (COMETHEA, authorization number 00604.01). The eight pigs (blood) used in this study (four males, four females) were around 2 years old and weighted between 60 and 85 kg. Down-sized pigs were kept at the Centre d’Imagerie Interventionnelle (Jouy-en-Josas). «Prealpe» female sheep (total 37, 50–80 kg), originate from and were raised in the «Unité Commune d’Expérimentation Animale» in Jouy-en-Josas, France. Blood (<400 ml/animal) was collected by venous puncture on sodium citrate.
isolation of Dc subset candidates, B lymphocytes, and Mo from Pig Blood
PBMC were obtained from pig peripheral blood buffy coat samples by 1.076 g/ml density Percoll (GE Healthcare) gradient centrifu-gation (24). For B cell sorting, PBMC were surface-labeled with 2 μg/ml primary monoclonal antibody (mAb) against IgL (K139 3E1, IgG2a) followed by Alexa647-conjugated goat anti-mouse
IgG2a antibodies (Invitrogen). For pDC sorting, PBMC were surface-labeled with 2 μg/ml primary mAb anti-pig CD4 (PT90A, IgG2a), CD3 (8E6, IgG1), CD14 (CAM36, IgG1), and CD172A (74-22-15, IgG2b) followed by Alexa488, phycoerythrin (PE), or Alexa647-conjugated goat anti-mouse isotype-specific antibodies (Invitrogen). Blood pDC candidates were sorted as CD3− CD14−
CD4+ CD172int cells, based on previously published indicative data
(25). For cDC candidates and Mo sorting, PBMC were surface-labeled with 2 μg/ml mAb anti-pig IgL (K139 3E1, IgG2a), anti-pig IgG (K138 4C2, IgM), anti-pig IgM (PG145A, IgM), anti-pig CD4 (PT90A, IgG2a), anti-human and pig cross-reacting CD14 (TUK4, IgG2a), anti-pig CD172A (74-22-15, IgG1), anti-artiodactyl MHC class II (Th21A, IgG2b), and chicken anti-human and artiodactyl cross-reacting CADM1 (3E1, IgY). The primary antibodies were revealed with Alexa488, PE, or Alexa647-conjugated goat anti-mouse isotype-specific antibodies and with donkey anti-chicken IgY Peridinin Chlorophyll Protein Complex (PerCP)-conjugated IgG. The cDC2 candidates were isolated as FSChi IgL− IgG− IgM−
CD4− CD14− MHC class II+ CADM1− CD172hi or CD172int cells.
The cDC1 candidates were isolated as FSChi IgL− IgG− IgM− CD4−
CD14− MHC class II+ CADM1+ CD172lo cells. Mo candidates were
sorted as MHC class II− CD172hi cells. Non-relevant antibodies
(IgG1, IgG2a, IgG2b, and IgM) were systematically used as controls to measure the level of non-specific background signal caused by primary antibodies. The cell subsets were sorted by flow cytometry on the ImaGif Cytometry platform using the analyzer-sorter MoFlo XDP cytometer and the Summit 5.2 software from Beckman Coulter (cytometric assessment of post-sort purity >98%). The numbers of DCs that were collected per pig lay between 2 and 3 × 10⁵ for pDC, 25 and 47 × 103 for cDC1, 20 and 40 × 105 for
cDC2 candidates.
isolation of Dc subset candidates from sheep Blood and B lymphocytes and Macrophages from sheep spleen
Sheep PBMC were loaded on 1.065 density iodixanol gradient (Optiprep, Nycomed Pharma) to isolate low density cells from blood. Sheep pDC candidates were isolated by flow cytometry as previously described (26). For isolating sheep cDC candidates, the low density PBMC from several sheep were reacted with anti-CD11c mAb (2 μg/ml, OM1 clone, IgG1) followed by a saturating concentration of pacific blue-labeled anti-mouse IgG donkey Fab (50 μg/ml). After extensive wash, cells were further incubated anti-CD172A mAb (2 μg/ml, ILA24, IgG1) followed by a saturating concentration of Alexa488-labeled anti-mouse IgG donkey Fab (50 μg/ml). After extensive wash, cells were incubated with 2 μg/ml primary mAbs anti-ruminant B cells (DU-204, IgM), CD11b (ILA130, IgG2a), TCR1γ/δ receptor (CC15, IgG2a), CD45RB (CC76, IgG1), and chicken anti-human and artiodactyl cross-reacting CADM1 (3E1, IgY). The IgM and IgG2a primary antibodies were revealed with PE-conjugated goat anti-mouse isotype-specific antibodies, the IgG1 anti-CD45RB primary antibody was revealed with Alexa647-conjugated goat anti-mouse IgG1 antibody, and the anti-CADM1 with anti-IgY PerCP-conjugated IgG. The cDC2 candidates were isolated by flow cytometry as B− CD11b− TCR1− CD45RB− CD11c+ CADM1lo
CD172hi FSChi cells. The cDC1 candidates were isolated by flow
cytometry as B− CD11b− TCR1− CD45RB− CD11c+ CADM1hi
CD172lo FSChi cells. The numbers of DCs that were collected per
sheep lay between 1 and 2 × 10⁵ for pDC, around 600 for cDC1,
and around 4000 for cDC2. The far lower amounts of collected blood cDCs from sheep as compared to pig may probably originate from the multiple staining steps due to the necessity to separately identify several IgG1 as primary antibodies. B cells and MP were sorted by flow cytometry from isolated sheep spleen cells using the anti-ruminant B cell (DU-204, IgM) and anti-CD14 (CAM36, IgG1), respectively.
Production of sheep MoDc
Three independent cultures of sheep MoDC were produced with GM-CSF as previously described (27).
rna extraction and hybridization on Microarrays
Total RNA from subsets was extracted using the Arcturus PicoPure RNA Isolation Kit (Arcturus Life Technologies) and checked for quality with an Agilent 2100 Bioanalyzer using RNA 6000 Nano or Pico Kits (Agilent Technologies). All RNA samples had an RNA integrity number (RIN) above 8.5. When insufficient total RNA amounts for hydridization were obtained (<25 ng for sheep DNA chips, <50 ng for pig DNA chips), the RNAs from the sorted subsets of distinct animal were mixed. RNA amplification and labeling was performed using the one-color Low Input Quick Amp Labeling kit (Agilent Technologies) following the manufacturer’s recommendations. Each RNA sample (25 ng for sheep and 50 ng for pig) was amplified and cyanin 3 (Cy3) labeled, and subsequently the complementary RNA (cRNA) was checked for quality on a Nanodrop and on an Agilent 2100 Bioanalyzer. The cRNAs (600 ng) were fragmented and used for hybridization on custom-designed Agilent ovine and porcine arrays. Our arrays for sheep and pig were custom-designed based on the commercial ovine Agilent arrays for these two species, as previously described (28, 29). In brief, the commercial probes with poor Sigreannot scores (30) were replaced with new probes designed using the e-array software from Agilent Technologies and including ovine or porcine orthologs of genes known to be selectively expressed in human and mouse DC subsets (15). After hybridization of the cRNAs on the custom-designed ovine array, the chips were washed according to the manufacturer’s protocol and scanned using a G2565CA scanner (Agilent Technologies) at the resolution of 3 μm. The resulting .tiff images were extracted using the Feature Extraction software v10.7.3.1 (Agilent Technologies), using the GE1_107_Sep09 protocol. All the protocols used can be obtained by contacting the CRB GADIE facility1. The transcriptomic
data from the chicken immune subsets were obtained from a previous study (31). All microarray data have been deposited in the Gene Expression Omnibus (GEO) database under reference numbers GSE9810, GSE53500, GSE55642 which have already been released and GSE66311 which is under embargo until publication of the present study.
computational Pipeline to assess cell subset homology across species
We have designed a computational pipeline in order to define cell subset homology across species, based on the analysis of gene-expression microarray data. In the current study, it has been applied to identify homology relationships between mononuclear phagocyte cells in mammalian species and then extended to the comparison with a more distant species (chicken). However, it can be applied to any cell type and to any species, provided that the annotations of the genes for each species are sufficiently well documented to allow the retrieval of the orthologous genes. In order to perform the comparison of expression profiles of cells coming from different species, thus from different platforms, we have designed two independent procedures. The first procedure (Figure S2A in Supplementary Material) is based on the assess-ment of the conservation of cell-specific fingerprints/signatures, as assessed by performing gene set enrichment analyses (GSEA, see below) between pairs of cell types. The second procedure (Figure S2B in Supplementary Material, see below) consists in cross-normalizing the expression datasets coming from the differ-ent species, in order to simultaneously examine the relationships between all cell types together.
cross-species Transcriptome comparison by Pairwise gene set enrichment analyses
The methodological pipeline is depicted in Figure S2A in Supplementary Material, based on an example with comparison of three different species (A, B, and C). Species A is the refer-ence species, i.e., the species for which the cell types are the most accurately described and generally also for which gene orthologous relationships can be retrieved from (mouse or human here). Species B and C are the test species, i.e., the species for which the identity of the cell types has to be established. Coming from three different platforms, the expression datasets have different numbers of probes, illustrated by boxes of different size. In brief, the strategy is to examine by GSEA whether the transcriptomic fingerprint of a given cell type (X) from the referent species A is enriched in one cell type (Y) of a test species (B for example) as compared to all other cell types of the same species. If this is the case, this would support the hypothesis that the cell type Y from the test species B is homologous to the cell type X of the referent species A. To perform these high-throughput GSEA in a processive way that could be easily reproduced and interpreted by other researchers devoid of bio-informatics expertise, we designed and implemented a dedicated software, called Bubble GUM (manuscript in preparation in which an extensive description of the software will be provided)2. Bubble GUM encompasses two
main modules, GeneSign and BubbleMap, respectively, dedicated to the generation of gene sets and to their use for GSEA applied to multiple pairwise comparisons of samples integrated together into a simple graphical output that helps in the interpretation of the results. The first step consists in extracting from the reference spe-cies the transcriptomic fingerprints of each cell type. A cell-specific transcriptomic fingerprint can be defined as the list of genes that
2 http://www.ciml.univ-mrs.fr/applications/BubbleGUM/index.html
are more highly expressed in the cell type of interest than in all other cell types. These fingerprints were extracted using the “Min (test) vs. Max (ref)” method [(minimum expression among all replicates for all samples for which the transcriptomic fingerprint is defined/maximum expression among all replicates used as refer-ence) ≥1.5-fold] (15, 32), using the GeneSign module of Bubble GUM. These transcriptomic fingerprints, in gene symbol format, will be assessed for enrichment on the expression datasets of spe-cies B and C. Thus, it is necessary to convert the probe annotations from the arrays of species B and C into the gene symbol of their orthologous counterparts in species A. For this purpose, we used the orthology relationships defined by the Sigenae pipeline which annotated the pig and sheep genes with their human and mouse orthologous gene symbols (30). The genes present on the gene chips of species B and C that were not associated to an orthologous counterpart in species A remained annotated with the gene symbol corresponding to their species of origin. The statistical enrichment of the cell-specific transcriptomic fingerprints extracted from the reference species A were then calculated between pairwise comparisons of cell types from species B or C with the GSEA methodology, using gene set permutations for computing the
p-values and false-discovery rates (FDR) (33). This was achieved, and the results graphically represented, by using the BubbleMap module of Bubble GUM.
cross-normalization of the species-specific expression Datasets
Using the same starting expression datasets, this is an alternative strategy which is complementary to the pairwise GSEA of the species-specific expression datasets, since it allows clustering all cell types together based on the overall evaluation of the proximity of their expression patterns of hundreds to thousands of ortholo-gous genes. The first step (Orthology Filter) consists in aligning the genes across the species (A, B, and C). It requires retaining only one representative probe per gene for each species/platform. This is needed since, in microarray designs, many genes are often each represented several times by a number of individual probes having each a different signal-to-noise ratio. However, probes have no equivalence across species, whereas genes do. In our experience, the signal-to-noise ratio is generally better for probes that have the strongest signal in positive control samples, while certain probes that have a low signal-to-noise ratio can give misleading high fold changes across conditions when using a limited number of replicates. Hence, we computed for each probe in each platform the sum of normalized expression values across all samples and kept for each gene the probe that had the highest computed value. Then, for the genes of species B and C, we retrieved the gene symbol of their orthologous counterparts in species A (reference species). In the example illustrated in Figure S2B in Supplementary Material, species A is the reference: the genes of species B and C are thus annotated using the gene symbol of the orthologous genes in the species A. The genes not represented in each of the gene chip platform used were removed from the analysis. This Orthology Filter yielded a filtered expression dataset for each species, where the number of genes and their associated symbols were similar between all species, as illustrated by boxes of the same size (Figure S2B in Supplementary Material). In order to be able
to rigorously merge the different datasets together, the dynamic ranges of expression values for each gene across all species must be homogenized by setting for each dataset and for each gene across all samples the mean expression to 0 and the variance to 1, a process called data centering and reduction. To prevent this mathematical transformation of the expression data to introduce noise by forcing artifactual expression changes for genes that were unregulated in the initial datasets, it is mandatory to remove all the genes that are not regulated in at least one of the datasets. This thus requires keeping only the genes that are differentially expressed between at least two cell types for each of the species studied. This was achieved in the second and third steps of the data processing. The second step (Differentially Expressed Gene, DEG, Filter) consisted in identifying independently in each dataset the genes that are differentially expressed between at least two cell types. The identification of DEG was performed by calculating the minimal ratio between each pairwise comparison of cell types and by selecting only the genes for which this minimal ratio was higher than twofold. The third step (DEG intersection) consisted in keeping only the genes that were common to all filtered DEG lists, i.e., the orthologous genes which expression was modulated across samples in each of the species studied. The fourth step con-sisted in data centering and reduction for each dataset, which was performed using the R statistical environment. This step consists in setting, for each dataset, the mean to 0 and the variance to 1, so that all datasets are comparable. In the fifth and final step, the different datasets were merged together simply by aligning their rows based on the common gene symbol extracted from species A. The final cross-normalized expression dataset including the data for all species was then used to perform canonical analyses for classification of samples, namely here hierarchical clustering.
generation of conserved cross-species cell Type-specific signatures
For each species (human, mouse, sheep, and pig), the transcrip-tomic fingerprint of each cell type was generated by selecting the genes more highly expressed in the cell type of interest, as compared to all other studied cell types of the same species in the case of “absolute” transcriptomic signatures, or as compared to selected cell populations of the same species in the case of “relative” transcriptomic signatures, using the “Min (test) vs. Max (ref) ≥1-fold” method. Once the fingerprints had been obtained for each species for a given cell type, the gene identifiers were all converted into their corresponding official human gene symbol using BioMart and we selected the intersection of these four lists as the final conserved cross-species transcriptomic signature specific of that cell type, with the following exceptions. First, for certain cell types such as MoDC, data were available from only three, and not four, species. Second, in order to avoid removing putatively relevant signature genes, we kept in these signatures the genes found in all species but one, when their absence in the signature of that given species was due to absence or non-functionality of corresponding ProbeSets on the array of that species.
real-Time Pcr
For relative quantitation of gene expression in subsets, RNA was reverse transcribed using random primers and the Multiscribe
reverse transcriptase (Applied Biosystems). Real-time PCR (qPCR) was carried out with 300 nM primers in a final reaction volume of 25 μl of 1 X SYBR Green PCR Master Mix (Applied Biosystems). The primers used to amplify ovine and porcine cDNA were designed with the Primer Express software (v2.0) using publi-cally available GenBank sequences (Table S1 in Supplementary Material). PCR cycling conditions were 95°C for 10 min, linked to 40 cycles of 95°C for 15 s and 60°C for 1 min. Real-time qPCR data were collected by the Mastercycler® e0p realplex-Eppendorf
system and 2−ΔCt calculations for the relative expression of the
different genes (arbitrary units) were performed with the Realplex software using GAPDH for normalization. All qPCR reactions showed >95% efficacy.
results
isolation of Mononuclear Phagocyte subset candidates from artiodactyl Blood or spleen Using a set of surface Markers
In order to establish a framework of homologous mononuclear phagocyte subsets across different species, we selected two mammalian artiodactyl species, sheep and pig, belonging to the Laurasatherians, a phylogenetically distant order from the Euarchontoglires that include the human and mouse species (Figure 1). A set of available antibodies exist to isolate cell subsets in these species of interest as food animals, hosts of zoonotic diseases, and biomedical models. We focused on blood or spleen immune subsets, because (i) a large source of transcriptomic data is available from this compartment in the human and mouse reference species, (ii) they are readily accessible with a minimum of technical biases in all species, and (iii) their gene-expression profiles are not expected to be influenced by peripheral tissue imprinting. We designed antibody panels to sort the subsets. In human and mice, cDC lack expression of T and B lymphocyte and Mo/MP markers and they abundantly express CD11c and MHC class II. Independent groups identified SIRPα as a conserved marker suitable to distinguish cDC2 from cDC1 across species (17, 34). Whereas XCR1 stands as the best marker for identifying cDC1 (34–41), appropriate reagents are not yet available in species outside human and mouse, and CADM1, whose sequence is highly conserved in evolution (42), can be used as an alternative (43, 44). cDC1 and cDC2 candidates were isolated from sheep and pig low density blood cells after exclusion of irrelevant cells (Figure 2A for sheep and Figure 2B for pigs, see Material and Methods section). The «candidate» nature of a sorted cell subset is marked by a star before the considered subset name in this paper. Due to restricted reagent availability, CD11c and MHC2 class II markers were used to isolate sheep and pig cDC, respectively.
In the case of pig, two populations being CADM1− CD172+
or CD172int were identified and selected as potential candidates
and designated as *cDC2 and **cDC2, respectively (Figure 2B). We previously published the marker phenotype, morphology, and type I IFN production properties of sheep lymph and blood *pDC as CD45RB+ FSChigh TCRγ/δ− B− CD11b− cells (26, 48).
The sorted cells were very potent at type I IFN production upon viral-type stimulation, demonstrating at the functional level that they were highly enriched in pDC. Moreover, the sorted cells
had the expected size and plasmacytoid morphology, indicating that they were not contaminated by other types of myeloid cells (48). Blood *pDC from pigs were sorted as CD3− CD4+ CD172dim
cells based on marker phenotype, morphology, and type I IFN production properties established by others (25, 49). Pig *Mo were sorted as CD172high MHC class II− cells and sheep splenic *MP as
CD14+ cells.
To decrease the risk of improper identification of sorted cell subsets, we performed a quality control consisting in examining the expression of a few control genes by qRT-PCR (Figure 2C) prior to performing genome-wide transcriptomic analyses. Control genes were chosen based on their high selective expression in a given subset of mononuclear phagocytes in a conserved manner between mouse and human (15, 36) and encompassed TCF4 for pDC, CD14 for Mo/MP, FLT3 for cDC and pDC, ZBTB46 for cDC, BATF3 and XCR1 for cDC1. As expected, TCF4 was expressed to much higher levels in sheep (26) and pig *pDC as compared to all other cell types examined except for pig **cDC2. CD14 was expressed at much higher levels in sheep and pig *mono/MP as compared to all other cell types examined except one of the two replicates of pig *cDC2. FLT3 was expressed at much higher levels in sheep and pig *cDC1 and in sheep *cDC2 as compared to all other cell types examined. BATF3 and XCR1 were expressed at higher levels in sheep and pig *cDC1 as compared to all other cell types examined. Importantly, these control analyses have allowed us to improve
FigUre 1 | Phylogenetic tree of a broad selection of
vertebrates. Phylogenic relationships and divergence time of clades are
drawn according to Hajjoubi et al. (45), de Jong et al. (46), and Douady et al. (47). Geological periods are indicated at the bottom in the following
order: primary era in yellow with Cambrian (Cb), Ordovician (O), Silurian (S), Devonian (D), Carboniferous (Ca), Permian (P); secondary era in blue with Trias (T), Jurassic (J), Cretacean (C), and the tertiary era (T) in green.
our initial strategy for sheep *cDC1 and *cDC2 sorting. In fact, in our initial sorting (Figure S3 in Supplementary Material), the CD45RB+ cells were not excluded to sort cDC candidates, and the
*cDC1 were found to express high levels of TCF4 mRNA, leading us to refine the sheep cDC sorting as presented in Figure 2. Thus, overall these control analyses validated our strategy for phenotypic identification and flow cytometry purification of sheep and pig *pDC, *Mo/MP and *cDC1 DC, and of sheep *cDC2. In the case of pig cell subsets, the nature of **cDC2 and *cDC2 was not clear since the former expressed high levels of TCF4 and XCR1, and the latter expressed relatively high levels of CD14 in one out of two replicates. Because pig **cDC2 presented a relatively high expression level of both TCF4 and XCR1, we concluded that they were significantly contaminated by pDC and cDC1. Therefore, we excluded these cells from further analyses and assumed that pig *cDC2 cells were the proper candidate.
Use of Pairwise gene set enrichment analyses for assessment of the similarity Between
Mononuclear Phagocyte subsets across Distant Mammal species
As a first approach to establish mononuclear phagocyte subset homology across species, we determined the level of similarity between artiodactyl, mouse, and human mononuclear phagocytes using pairwise GSEA, as previously performed to characterize
FigUre 2 | sorting of B cells, Dc subset candidates, and Mo/MP candidates from pig and sheep blood or spleen and analysis of their expression of control genes. (a) Sheep cell subset sorting from blood
and spleen. For sorting of blood cDC subset candidates, low density blood cells were gated on FSChi CD11c+ B− CD11b− TCR1− CD45RB− cells and analyzed for CADM1 and CD172 expression, based on isotype control references for each staining. The CADM1hi CD172lo (*cDC1) and CADM1lo CD172+ (*cDC2) cells were sorted. Blood pDC candidates (*pDC) were sorted as low density FSChi B− CD11b− TCR1− CD8− CD11c− CD45RB+ cells. Splenic candidate *Mo/MP were sorted as CD14+ cells. Splenic B cells were identified as DU-2-104+ cells. (B) Pig cell subset sorting from blood. For cDC candidate sorting, low density PBMC were gated on FSChi MHC class II+ B− CD14− CD4− cells and analyzed for CADM1 and CD172 expression. One cDC1 candidate population was identified and sorted, as
CADM1+ CD172lo (*cDC1). Two cDC2 candidate populations were identified and sorted, as CADM1− CD172hi (*cDC2) and CADM1− CD172int (**cDC2). Candidate Mo were sorted as CD172+ MHC2− cells (*Mo). Candidate pDC were sorted as CD3− CD14− CD4+ CD172int cells (*pDC). B cells were identified and sorted as IgL+ cells. (c) qPCR analysis of the expression of control genes in sorted candidates from one or two animals. RNA from candidate cell subsets (left, sheep; right, pig) were subjected to detection of control transcripts by qPCR. Control transcripts were chosen based on their high selective expression in specific subsets of mononuclear phagocytes in a conserved manner between mouse and man, i.e., TCF4 for pDC, FLT3, BATF3 and ZBTB46 for cDC, XCR1 for cDC1, and CD14 for Mo/MP. Data are represented as relative expression levels normalized to maximal expression across cell types, each bar corresponding to a distinct animal.
human immune cell subsets (19) and chicken cDC (31). To that aim, we used publicly available transcriptomic data from a selection of human and mouse immune cell types (Data Sheet S1 in Supplementary Material). We established human and mouse transcriptomic fingerprints for B cells, pDC, cDC1, Mo/MP, MoDC, cMo, and ncMo as the list of genes that are expressed at least 1.5-fold higher in the index cell population than in a large number of other immune cell types (Data Sheet S2 in Supplementary Material). B lymphocytes were chosen in all species as a reference cell subset, because their phenotypic identification in each species and their homology across species are already well established, and because they are expected to share with mononuclear phagocytes a genetic program under-lying their common function of antigen-presenting cells. We generated a common fingerprint for Mo and tissue MP because their gene program is very close in the mouse (9), even though tissue MP generally derive from embryonic precursors rather than from circulating blood Mo. We could not establish a human or mouse cDC2 transcriptomic fingerprint with a sufficiently large number of genes for subsequent reliable statistical analysis. We also defined relative transcriptomic signatures for cDC vs. Mo/MP as the list of genes that are 1.5-fold higher in all cDC relatively to Mo and MP from different tissues, and reciprocally (Data Sheet S2 in Supplementary Material). Finally, we identified transcriptomic fingerprints from human and mouse MoDC (12). We then tested whether the transcriptomic signatures of mouse and human immune cell types were enriched between sheep or pig candidate cell subsets using GSEA (33) (Figures 3 and 4). As control, since homologies between mouse and human cell subsets have been previously demonstrated by other methods of transcriptional analyses (15, 16, 18), mouse fingerprints were also used for GSEA analysis on human cells (Figure S4 in Supplementary Material) and reciprocally (Figure S5 in Supplementary Material).
As expected, sheep B cells were significantly enriched for the expression of both human and mouse B cell transcriptomic fingerprints as compared to all other sheep cell subsets examined (Figure 3, ). The sheep *pDC were enriched for the human and mouse pDC fingerprints in most comparisons (Figure 3, ), suggesting that sheep *pDC correspond to homologs of human and mouse pDC. However, both mouse and human pDC fingerprints were not significantly enriched in the comparison of sheep *pDC with *cDC2 (NES = 1.29 and 1.24, and FDR = 1.0 and 1.0, respectively), indicating that sheep pDC probably contaminate sheep *cDC2 despite exclusion of CD45RB+ cells
for their purification. The sheep *pDC were also enriched for the human B cell fingerprint in most comparisons (except with sheep B cells), what can be partly explained by the known overlap between the gene-expression program of pDC and B (15, 50–52); however, the human pDC fingerprint is not enriched in the sheep *pDC comparison with B cells and the extent of the human B cell fingerprint enrichment in sheep *pDC is above the expectations provided by similar analyses in the human and mouse reference species (Figures S4 and S5 in Supplementary Material), all of this indicating that B cells are likely to contaminate sheep *pDC despite exclusion with a pan-B cell marker for *pDC selection. Finally, *cDC2 did not show a clear enrichment for any human
and mouse signatures (Figure 3, ). However, it is also the case when examining enrichment of mouse cell subset fingerprints in human cDC2 (Figure S4 in Supplementary Material, ) and reciprocally (Figure S5 in Supplementary Material, ). Hence, this GSEA approach is not very informative for identification of cDC2, due to the lack of robust human or mouse fingerprints that are specific of this cell type as mentioned earlier. Sheep *cDC1 were significantly enriched in the human and mouse cDC1 finger-prints in all comparisons (Figure 3, ). They were also enriched systematically in the mouse cDC vs. Mo/MP fingerprints. This suggested that sheep *cDC1 correspond to true homologs to human and mouse cDC1. Sheep splenic *Mo/MP were strongly enriched for the human and mouse Mo/MP vs. cDC fingerprints except when compared to MoDC, and not for the human and mouse fingerprints of B lymphocytes, pDC, or cDC (Figure 3, ). This confirmed that sheep splenic *Mo/MP belong to the monocytic lineage and not to the B nor DC lineages. However, their precise identity remained unclear as they were enriched for the mouse cMo fingerprint but not for the human cMo or ncMo fingerprints. When mouse fingerprints were applied on human immune cell subsets comparisons and vice versa, there was also no consistent alignment of ncMo between the two spe-cies (Figures S4 and S5 in Supplementary Material, highlights and ). Finally, sheep *MoDC that were derived from bone marrow cells in GM-CSF (27), were systematically and strongly enriched in the human and mouse MoDC signatures (Figure 3, ), confirming the homology between these three populations.
A similar analysis for pig candidate cell subsets also clearly established similarities with their putative human and mouse equivalents for B cells (Figure 4, ), pDC (Figure 4, ), and cDC1 (Figure 4, ) but not for cDC2 (Figure 4, ). Pig *Mo were clearly enriched for human and mouse fingerprints of cells of the monocytic lineage, and not for human and mouse signatures of B lymphocytes, pDC, or cDC (Figure 4, ).
Thus, altogether, GSEA analysis of the sheep and pig data for the fingerprints of human and mouse immune cell subsets gave results as informative as those obtained when comparing together human and mouse cell types, and clearly established similarities between sheep and pig cell subset candidates and their putative human and mouse equivalents for B cells, pDC, cDC1, and MoDC. Further analyses are necessary to precisely identify the nature of sheep and pig *cDC2 and *Mo/MP subsets.
confirmation and extension of the conclusions on the similarity Between Mononuclear
Phagocyte subsets Through global and
simultaneous analysis of the gene-expression Profiling of all cell Types from Mammalian species Using hierarchical clustering
In order to confirm the identification of homologous mononu-clear phagocytes across species as deduced from GSEA analyses, and to potentially gain more insights into the exact nature of pig and sheep *cDC2 and *Mo/MP, we next processed all the data together for global analysis by hierarchical clustering (Figure 5). Only the genes that showed significant variation in their expression across subsets in each species were selected
FigUre 3 | gsea-based assessment of the identity of sheep cell subset candidates by comparison with well-defined human and mouse mononuclear phagocytes. Candidate sheep cell subsets were compared to
one another for their relative enrichment in transcriptomic fingerprints (GeneSets) specific of human (a) or mouse (B) mononuclear phagocyte
subsets, using GSEA through the Bubble GUM software. The human and mouse GeneSets were defined through the same approach based on pre-existing knowledge of equivalency between human and mouse mononuclear phagocytes. A GeneSet specific for B cells was included as a control for the methodology, since the identity of this cell type is clearly established in all species and its homology across species is undisputed. The GeneSets used were named and defined as follows. The transcriptomic fingerprints “B cell,” “pDC,” “cDC1,” “cMo,” “ncMo,” and “MoDC” consisted in the lists of human/mouse genes showing a high selective expression in the eponym human/mouse cell subset as compared to many other leukocytes
(see Materials and Methods for further details, Data Sheet S2 in Supplementary Material). The transcriptomic fingerprints “cDC vs. Mo/MP” and “Mo/MP vs. cDC” consisted in the lists of human/mouse genes expressed in cDC to higher levels than in Mo/MP, and reciprocally (Data Sheet S2 in Supplementary Material). All possible pairwise comparisons between sheep cell subsets were performed to assess their respective expression of the transcriptomic fingerprints of human and mouse mononuclear phagocyte subsets, using the Bubble GUM software for calculations and graphical output. Results are represented as bubbles, in a color matching that of the cell subset in which the GeneSet was enriched. Stronger and more significant enrichments are represented by bigger and darker bubbles, as illustrated in the legend box of the figure. Specifically, the surface area of bubbles is proportional to the absolute value of the normalized enrichment score (NES). The color intensity of dots is indicative of the false-discovery rate (FDR) statistical value.
and the resulting datasets were normalized across species. All B cells from the four mammalian species grouped together in a specific branch of the tree, rather than each with other immune cells of the same species. This finding validates hierarchical clustering as an alternative method for identifying homologous mononuclear phagocytes across species. A closer examination of the dendrogram shows that the different cell types grouped in two major branches. The first one encompassed all the known and candidate cells of the monocytic lineages and pig *cDC2, and split further into two subgroups, one including all the identified or candidate MoDC, and the other one including all the identi-fied or candidate Mo/MP and pig *cDC2. The second branch encompassed all the other cell types known or hypothesized not to belong to the monocytic lineage. This branch further split into two sub-branches, one constituted of the group of B cells and of the group of identified or candidate pDC, and the other
constituted of identified or candidate cDC subsets except pig *cDC2. The common clustering of B and pDC transcriptome can be explained by the shared gene-expression program between B and pDC as mentioned above. Hence, this analysis confirmed the conclusion already drawn from the GSEA analyses, namely the monocytic nature of sheep and pig *Mo/MP and *MoDC, as well as the homology between pig, sheep, mouse, and human *pDC/ pDC. Moreover, the hierarchical clustering analysis allowed to better define the nature of sheep and pig *cDC2. Specifically, it confirmed the hypothesis that sheep *cDC2 belong to the cDC family, while, on the contrary to our a priori assignment, it shows that pig *cDC2 rather resemble Mo than cDC. However, within the branch of monocytic cells, this analysis grouped Mo/MP by species of origin rather than by cMo vs. ncMo subsets. Similarly, this analysis grouped cDC by species rather than by cDC1 vs. cDC2 subsets.
FigUre 4 | gsea-based assessment of the identity of pig cell subset candidates by comparison with well-defined human and mouse mononuclear phagocytes. The gene-expression data for pig cell subset
candidates were analyzed exactly as described in Figure 3 for sheep cell
subset candidates. Candidate swine cell subsets were compared to one another for their relative enrichment in transcriptomic fingerprints specific of human (a) or mouse (B) mononuclear phagocyte subsets, using GSEA
FigUre 5 | confirming and completing homology assignment of sheep and pig candidate Mo/MP, pDc, and cDc by unsupervised hierarchical clustering with human and mouse cell types. The datasets of each species
were filtered and cross-normalized in order to allow mixing them all together for global analysis of the relationships between sheep, pig, mouse, and human mononuclear phagocyte subsets by using unsupervised hierarchical clustering. In brief, this analysis is focused on 1926 unique orthologous genes (i) for which a functional and specific ProbeSets was present on the microarrays for each species and (ii) which were found to be differentially expressed in each species between at least two subsets of mononuclear phagocytes. For each species and each of these 1926 genes, the expression data was then transformed to a mean = 0 and a variance = 1, in order to cross-normalize expression values to a similar dynamic range between the different datasets. For each cell type, the initials of the scientific name of the species of origin are indicated as a prefix: Hs, human; Mm, mouse; Ss, pig; and Oa, sheep. The robustness of the tree was tested by multiscale bootstrap resampling using Pearson’s correlation as distance and average linkage as cluster method, with 1000 iterations at 10 different dataset sizes comprised between 50 and 140% of the complete dataset. An AU (approximately unbiased) p-value (percentage) was calculated and placed on the nodes of the cluster dendrogram. Missing percentages correspond to 100%.
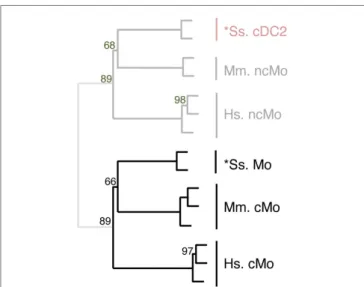
FigUre 6 | confirming homology assignment of sheep cDc1 and cDc2 candidates by unsupervised cross-species hierarchical clustering focused on cDc subsets. An unsupervised cross-species
hierarchical clustering analysis was performed as described in Figure 5, but
focused only on cDC subsets. The corresponding filtered dataset included 868 unique orthologous genes found regulated between cDC1 and cDC2 from human (Hs), mouse (Mm), and sheep (Oa). Pig cDC could not be included in this analysis due to the lack of data on proper pig cDC2.
identification of similarity Between subsets of Dc and of Mo across species Through
hierarchical clustering analyses Focused on These cell Types
The expression patterns of genes outside of the cell types of interest may mask similarity between cDC or Mo subsets, as previously reported (15). Hence, we further evaluated the simi-larities between subsets of cDC on the one hand, and of Mo/ MP on the other hand, by re-analyzing their gene-expression profiles focusing only on the genes that showed significant vari-ation in their expression across DC subsets (Figure 6) or Mo/MP (Figure 7) in each species. Pig data were not used in the analysis focused on cDC, because, pig *cDC2 belonged to the monocytic branch and not to the DC branch of Figure 5. Sheep data were not used in the analysis focused on Mo/MP, because only one subset of sheep Mo/MP had been purified. Remarkably, these focused analyses grouped samples by cell types rather than by species. The cDC-focused hierarchical clustering confirmed the conclusion drawn from GSEA that sheep, mouse, and human cDC1/*cDC1 are homologs, and refined our understanding of the identity of sheep *cDC2 by showing their homology to mouse and human cDC2 (Figure 6). The Mo/MP-focused hierarchical clustering allowed to newly identify pig homologs to mouse and human cMo vs. ncMo (Figure 7). Pig *cDC2 correspond to ncMo and pig *Mo correspond to cMo. In a complementary phenotypic FACS analysis, we confirmed that likewise human ncMo as compared cMo, pig *cDC2 express higher membrane levels of CD16 and CD163 as compared to pig *Mo (Figure S6 in Supplementary Material).
Altogether, our comparative analyses of the gene-expression profiles of mononuclear phagocyte subsets across mammals
FigUre 7 | completing homology assignment of pig cDc2 Dc candidate to non-classical Mo subset by unsupervised cross-species hierarchical clustering focused on Mo subsets. An unsupervised
cross-species hierarchical clustering analysis was performed as described in
Figure 5, but focused only on cells from the monocyte branch of the tree
obtained in Figure 5. The corresponding filtered dataset included 191 unique
orthologous genes found regulated between cMo and ncMo from human (Hs), mouse (Mm), and pig (Ss). Sheep data could not be included in this analysis due to lack of data on subsets of sheep monocytes.
indicated that the complex specialization of these cells into distinct subsets is conserved across mammals for both DC and Mo. Subset grouping did not indicate existence of a relationship between transcriptomic proximity of subsets and phylogenetic closeness of species. The conserved organization across distant mammals suggests that the mononuclear phago-cyte complexity arose in a common mammalian ancestor and that the different subsets can be considered as homologous subsets across mammals.
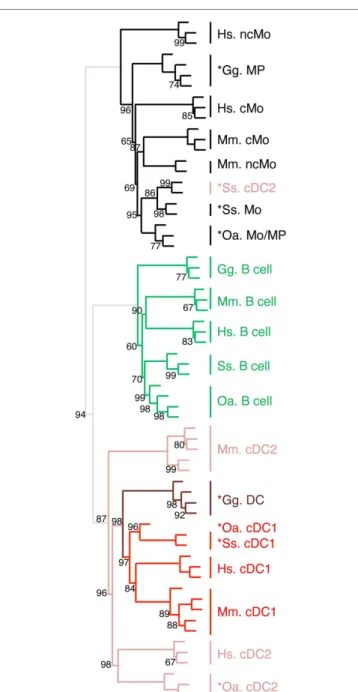
evidences for homologous cDc and Mo/MP lineages across Warm-Blooded Vertebrates
We recently generated the transcriptomic profile of MP, total cDC, and B cells from chicken spleen and found similarities with human and mouse corresponding immune cell subsets by GSEA (31). In order to extend our subset homology analysis to non-mammalian vertebrates, we normalized and processed the transcriptomic data in a hierarchical clustering analysis as described above, using mammalian and chicken Mo/MP, B cells, and cDC subsets (Figure 8). There again, a tree consisting of two main branches was obtained, corresponding to a split between Mo/MP and B cells/DC. In the cDC branch, the cDC1 subset clustered together and included the chicken total cDC. The chicken MP grouped with the mammalian Mo/MP. Whereas this analysis is still partial due to limited knowledge and availability on marker sets for sorting immune cell subsets in chicken, it shows that our transcriptomic comparative approach can be used to define subset homology throughout vertebrates. It also further supports that separation of mononuclear phagocytes into Mo/MP
and cDC occurred early during vertebrate evolution and must already have been in place in the common ancestor of reptiles (including birds) and mammals.
identification of Mononuclear Phagocyte gene-expression signatures across Mammals
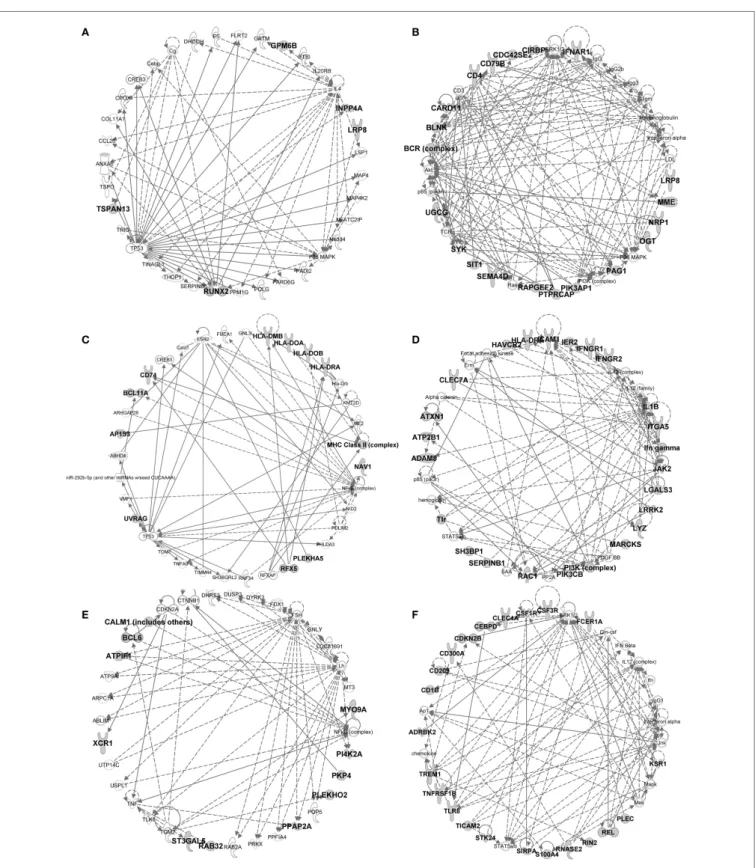
Taking advantage of our multi-species microarray data, we sought to identify core gene-expression signatures that should universally define at the molecular level each of the mononu-clear phagocyte subset and that should hold biological relevance based on their selective and conserved expression in homologous subsets throughout mammalian evolution. Absolute signatures [“Min (test) vs. Max (ref)” method, see Materials and methods] encompassed all genes selectively expressed at higher levels in the cell subset of interest (index population) as compared to all the other cell subsets studied (comparator populations), in all species studied. An absolute signature was computed for B cells in order to validate the approach by comparison of the gene list obtained with the advanced knowledge available on the biology of this lymphocyte population. Absolute signatures were also found for pDC, cDC1, and MoDC. Relative signatures encompassed genes selectively expressed to higher levels in one or several cell subsets of interest (index population) as compared to a selection of other cell subsets (comparator populations). The choice of index and comparator populations was largely based on the branching of different cell subsets in hierarchical clustering (Figure 5), or on known sharing of specific functions between cell subsets in mouse or human. The conserved absolute and relative gene-expression signatures in mononuclear phagocyte subsets are listed in Table 1 and Data Sheet S3 in Supplementary Material. In several instances, Ingenuity Pathway Analysis (IPA) mapped a high proportion of the genes to gene interaction networks (Figure 9 for the DC lineage subsets, Figure 10 for the monocytic lineage subsets and Figure S7 in Supplementary Material), and revealed predicted upstream regulators (Figure 11A) and canonical pathways and functions (Figure 11B) that are described thereafter for B cells, DC lineage subsets, and Mo/MP categories. Although certain functions or pathways were enriched in several gene signatures, the genes responsible for the enrichments differed (Data Sheet S4 in Supplementary Material) and pointed out to different, complementary contributions of the distinct cell types to the corresponding functions or pathways.
The conserved B cell signature that we use as our reference subset (Table 1) includes a regulatory gene network directed to immunoglobulin production (Figure S7 in Supplementary Material), with PAX5 as an upstream regulator (p = 10−5.8)
(Figure 11A). SOX11 (p = 10−8) and FOXO1 (p = 10−7) are
predicted to be other upstream regulators in the conserved B signature (Figure 11A), in agreement with existing knowledge. As expected, this signature is associated to B lymphocyte ontogeny and functions [e.g., “development of B lymphocytes” p = 10−10.4,
“antibody response” (p = 10−7.5), “proliferation of B lymphocytes”
(p = 10−10.5), and “morphology of B lymphocytes” (p = 10−7.5) as
well as to the “B cell receptor signaling” pathway (p = 10−7.3)]
(Figure 11B). The B cell signature also pinpoints to genes without any known function in B cells yet, such as the cell cycle gene
FigUre 8 | Unsupervised cross-species hierarchical clustering including a chicken dataset demonstrates a conserved organization of vertebrate mononuclear phagocytes in the two main lineages of Mo/MP vs. cDc. An unsupervised cross-species hierarchical clustering
analysis was performed as described in Figure 5, but including
gene-expression data from chicken (Gg prefix for Gallus gallus) and focused only on the cell types commonly sorted in all five vertebrate species, i.e., B cells, Mo/MP, and cDC. The corresponding filtered dataset included 388 unique orthologous genes found regulated across cell subsets in each species.
RAD17 (53) or the SP140 gene that encodes a nuclear body protein (54) (Table 1). Altogether, the results of the functional analysis of the conserved signature of B cells support the biological relevance of the conserved gene signatures generated by our approach.
In the conserved signatures corresponding to the DC lineage, the pDC signature is restricted to few genes including RUNX2,
which encodes for a major known regulator of pDC development (56) and other genes whose role is not yet known in this subset, with three of them coding for potential cell surface markers or targeting molecules, i.e., the low density lipoprotein receptor-related protein 8 (LRP8), tetraspanin 13 (TSPAN13), and a zinc-family transporter protein member (SLC30A5) (Table 1). These genes, except SLC30A5, map to a common network (Figure 9A). No functional annotation was found significantly enriched in the pDC absolute signature due to the low number of associated genes. Interestingly, the pDC vs. cDC relative signature includes genes belonging to a regulatory network pointing to IFN −α/βproduction (Figure 9B) and retrieves as a major putative upstream regulator X-box binding protein 1 (XBP1) (p = 10−15) (Figure 11A), a transcription factor involved
in mouse DC development (57). The pDC vs. cDC relative sig-nature was also enriched for “proliferation of B lymphocytes” (p = 10−4), “morphology of B lymphocytes” (p = 10−5), and “B
cell receptor signaling” pathway (p = 10−2.9), similarly to the
conserved B cell signature (Figure 11B). These observations are consistent with the known usage downstream of mouse and human pDC endocytic receptors of a signaling pathway akin to that of the B cell receptor (58). This known pDC signaling pathway involves the products of SYK, BLNK, and PIK3AP1, three of the six genes responsible for the enrichment of the “B cell receptor signaling” pathway in the conserved pDC vs. cDC gene signature (Data Sheet S4 in Supplementary Material), as well as
CARD11 which contributes to the enrichment for the annotation
“proliferation of B lymphocytes” in the pDC vs. cDC signature. This strongly suggests that this signaling pathway is conserved in pDC of all mammalian species. Beside TCF4 which encodes for a major known regulator of both B and pDC development (52), several other genes associated to B cell biology are found in the pDC vs. cDC relative signature (Table 1), namely CD79B,
PTPRCAP, SEMA4D, CTCF, IFR1, and MEF2C. This suggests
that additional biological processes shared between B cells and pDC remain to be identified.
No absolute signature could be generated for cDC but inter-esting informations were obtained with relative signatures, i.e., the cDC vs. Mo/MP and cDC vs. pDC. The cDC vs. Mo/MP signature includes FLT3, a key gene in mouse DC development (59) as well as many genes of a regulatory network includ-ing BCL11A, HLA-DOA, HLA-DRA, HLA-DMB, HLA-DOB,
CD74, the axone guidance neuron navigator NAV1 and the
MHC class 2 transcription regulator RFX5 (Figure 9C). In relation to this network, IL27 (p = 10−4.4), IFNG (p = 10−2.6), and
NFkB (10−2.8) were retrieved as putative upstream regulators
(Figure 11A). The cDC vs. Mo/MP signature was enriched for canonical pathways such as “antigen presentation” (p = 10−9.6),
“DC maturation” (p = 10−4.6), and “T helper cell
differentia-tion” (p = 10−6.2) (Figure 11B). The cDC vs. pDC signature
includes a main regulatory network encompassing PIK3CB,
ICAM1, CLEC7A, HLA-DRA, IL1B, and LGALS3 (Figure 9D)
and is enriched for “functions of antigen-presenting cells” (p = 10−11.1), “inflammatory response” (p = 10−8.9), “bacterial
infection” (p = 10−7.9), “migration of cells” (p = 10−11.4), and
“clathrin-mediated endocytosis signaling” pathway (p = 10−4.6)
(Continued)
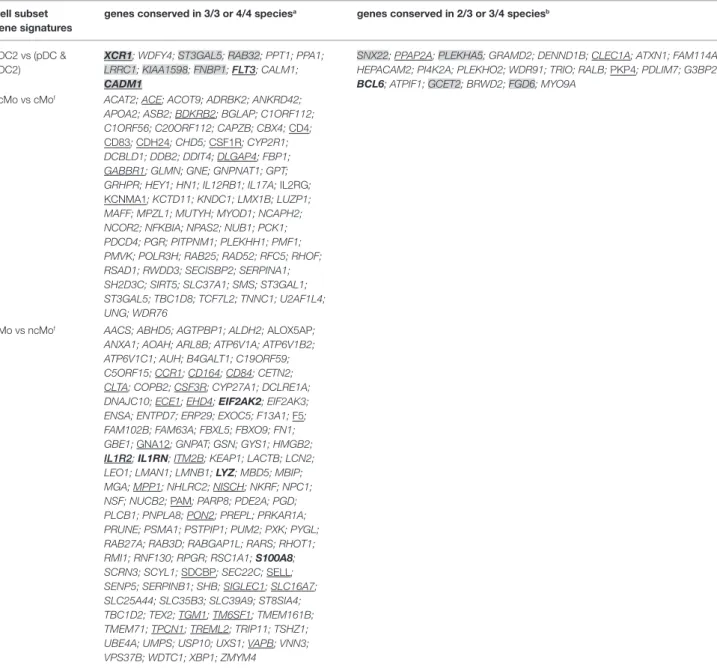
TaBle 1 | conserved gene signatures for mammalian mononuclear phagocytic cell subsets. cell subset
gene signatures
genes conserved in 3/3 or 4/4 speciesa genes conserved in 2/3 or 3/4 speciesb B cell TRAF5; SP140; RAD17; MEF2C; MBD4;
FCRL1c,d,e; CD19
VPREB3; RFX5; PAX5; BACH2; AFF3; SWAP70; PLEKHA2; MS4A1; DMXL1; CR2; CD79B; CD22; BLK; ELL3; STRBP; EBF1
cDC vs Mo/MP NAV1; MSI2; HLA-DMB; FLT3; BCL11A RFX5; PLEKHA5; HLA-DOA; BCAT2; AFF3; FAM149A; APOBEC3H; UVRAG;
SPINT2; PDXP; HLA-DOB; CD74; CD5; AP1S3; HLA-DRA
cDC vs pDC WDR41; WDFY3; TPM4; TLR2; SPI1; SNX14; SNX10; SERPINB1; SAMHD1; RIN3; REL; RAB32; NHSL1; NCOR2; NAV1; MARCKS; LYZ; LGALS3; KLF3; JAK2; ITGA5; IL4I1; IL1B; IFNGR1; IFI30; ID2; ICAM1; HLA-DMB; GCA; FGL2; F11R; ETV3; DOCK7; DENND4A; CXCL16; CLEC7A; CHSY1; BATF3; ATP2B1; ARRB1;
ARHGAP22; ANPEP; AIM1; AIF1; AHR; ADAM8
YWHAH; TPCN1; TDRD7; SNX21; SLC7A10; SIPA1L3; RGS12; MYO1D; MRC2; METRNL; MEA1; LRRK2; LRRC8C; LOXL3; HLA-DQB2; HAVCR2; FGF17; EHF;
DOK1; DGKH; ATXN1; ASB2; ARHGAP26; ACTR3; RNF144B; PLEKHO2; MYOF; LPCAT2; KANK1; FAM114A1; DENND5A; ZNF524; VASP; SULT1A1; SPRED1; SNX8; SH3BP1; SH3BGRL; RELB; RALB; RAC1; PTPN12; PLEKHO1; PIK3CB;
PAK1; NR4A1; NAB2; LFNG; JUNB; IFNGR2; IER2; HFE; FAM49B; EPSTI1; EGR1;
EFHD2; DHRS3; CTBP2; COTL1; CD74; CD63; CBFB; C9ORF72; C1ORF21; BCL6; BASP1; ANXA5; SR140; PKM2; HLA-DRA; RGS4; TMSB4X; GMIP; MAST2;
CXCL9; DNAJA4; KIF14; MTUS1; RABGGTA; RTN1; SYNJ1; TBX3 DCs vs (Mo/MP &
MoDC)
MSI2; BCL11A
TPI1; NDUFV2; FCGR2B; CD200R1; ALDOA
RAB34; PDCD1LG2; CHCHD7; CCL17; CARM1; AUH; VEGFA; UBA3; TUBA1A;
TSKU; TMEM159; SLC48A1; SIGMAR1; RNF181; PTGR1; NOS2; IKBIP; FAM162A; BHLHE40
MoDC
MoDC vs Mo/MP TPI1; SLC2A1; SLAMF1; PRNP; PPA2; POLR1D; PLAU; PALLD; NDUFV2; NARF; MRPL4; IL1R2;
FCGR2B; EGLN3; DGKA; CSNK2B; CISH;
CD200R1; AVPI1; ALDOA; ADAMTSL4
ZNF747; ZNF219; WIBG; VDR; SLC45A4; ROGDI; RASSF7; RAB34; RAB33A; PDE6D;
PDCD1LG2; PBX2; NAGS; KCNK6; ICOSLG; HRH1; GOLGA8B; GOLGA8A; ETHE1;
ERCC6; DVL2; DGUOK; CLEC10A; CHN2; CHCHD7; CD209; CCNG2; CCL17;
CARM1; C1ORF122; AUH; ANKRD37; ZEB1; VEGFA; UBA3; TUBA1A; TSKU; TMEM159; TCTEX1D2; STRA13; SPATA24; SNRNP27; SLC48A1; SIGMAR1; S1PR3; RNF181; RMND1; RAB7A; PTGR1; PIGU; PI4K2A; OST4; NSL1; NOS2; NAE1; MT1A; MORN4; LMF2; JKAMP; IKBIP; IFT46; HAUS4; GLTPD1; GATC; FAM162A; FAM13A; FAM134A; ESYT1; ERI2; EEPD1; DNLZ; DHRS11; DCTPP1; CENPW; BHLHE40; APOO; AKIP1; CD1B; CGREF1; NOSTRIN; OLFM4; GAS6; SLC27A3
(Mo/MP & MoDC) vs DCs
CEBPB; CCDC93; C5AR1 TLR8; FTL; DOK3; CD68
Mo/MP vs cDC TLR4; SOD2; RBMS1; LAMP2; GLUL;
FNDC3B; CYBB; CEBPB; CCPG1; CCDC93;
C5AR1
TLR8; SNX27; RHOQ; OSTM1; KIF1B; FTL; DUSP6; DOK3; CTSD; CTSB; CD68;
HERC5; IPMK; DPYD
Mo/MP vs MoDC WDR33; VPS13D; UBE2D2; TRA2A; STAG2; SFPQ; NSD1; NFKB1; NADK; ITPR1; CFLAR; ARFGEF1
ZNF407; VPS13C; USP31; SLC16A4; SKAP2; PRKCH; PPFIA1; PIAS2; MDN1; MAP3K5; LRRC8D; CHM; AKAP13; ACTR3; SFRS2IP; RAD51L1; NAT12; MYST3; CDC2L5; ZNF830; ZBED5; TPPP3; TMEM164; TGS1; TBC1D8B; SNRNP35; SMEK1; SLC38A10; SHISA2; RSRC2; REV1; RALGAPB; PWWP2A; PRRC2B; PBRM1; NLRC5; MOGS; MAP7D1; LUC7L3; LIMCH1; KDM4C; ISY1; IP6K1; HNRNPUL2; HNRNPU; HNRNPK; HNRNPH2; HNRNPH1; HNRNPD; HNRNPA1; FOXN3; FAM173B; FAM159B; ERVW-1; CELF2; C9; NUP210L; PDZK1; ALMS1; LAMB1; METTL3; PAIP1
pDC RUNX2 LRP8; INPP4A; TSPAN13; SLC30A5; GPM6B pDC vs cDC UBR2; UBE2H; TMED3; TCF4; TARBP1;
SYK; STT3B; SPCS3; SNX5; SLC39A7;
SIT1; SEMA4D; SEC61A1; SCYL3; SCAMP2; SAP30BP; RUNX2; RDH11; RASGRP2; RABAC1; PPAPDC1B; PGM3; PARN; PAG1; OGT; NUCB2; MSI2; MEF2C; LMAN2; IQCB1; IFT52; HBS1L; GPAM; GORASP2; FKBP2; FAM3C; EIF2AK3; DERL1; DDOST; DAD1; CYBB; COPA; CDC42SE2; CD4; CD164; BTRC;
BLNK; BCL7A; ATP2A3; ATG5
ZXDC; VPS13A; UEVLD; TNRC6B; TMEM63A; TAF9B; TAF1A; SUSD1; STOML1; ST6GALNAC4; SSR2; SRPRB; SPG20; SLC38A6; SLC38A1; SLC25A36; SGCB; SERPINI1; SEC24C; SAP130; RAPGEF2; RALGPS1; RAB28; RAB11FIP2; PTAR1; PIK3AP1; OSTM1; NRP1; MYB; MGAT4A; MCOLN2; MCOLN1; LRP8; KIF13B; KIAA0226; IRF7; INPP4A; IMPACT; HIVEP1; FKBP8; FANCD2; FAM122B; DMTF1; CSTF1; CREB3L2; COBLL1; CBX4; CANX; ATG4D; ANKRD28; ANKIB1; AGBL3; AFF3; TPRG1L; RNF144A; IFI27L1; FAM65B; ELMOD3; DCAF7; CARS2; ZMYND11; YPEL3; USP24; TUBGCP6; TSPAN13; TRAM1; TOE1; TMEM138; TM9SF1; TCTA; SURF4; STAMBPL1; SSR3; SPCS2; SPATA13; SNX9; SLC7A5; SLC44A2; SLC30A5; SEPP1; SCAND1; SCAMP3; RHOH; RHBDF2; RHBDD1; REXO2; QDPR; PYCR2; PTPRCAP; PRMT7; POLD1; PEX5; NSUN3; MTMR9; LPGAT1; INTS7; IFNAR1;
HM13; GRAP; GANAB; FNDC3A; FASTK; EXOC7; ELOF1; ELMOD2; CTCF; COPE; COMMD6; CNP; CIRBP; CDS2; CD79B; CARD11; C19ORF10; C16ORF80; C10ORF88; BTD; BET1; ARHGAP12; AHI1; WDR51B; SAPS3; MLF1IP; KIAA1370; CYBASC3; CEP110; CCDC111; ANUBL1; MME; PTPRS; ATF2; GPM6B; MON2; PPM1A; TM7SF3; TMCO1; UGCG; ZDHHC14; ZNF521; TMED10; PAIP1
cDC2 FCER1A
cDC1 XCR1; WDFY4; FNBP1; FLT3; CADM1 SNX22; GCET2 cDC2 vs (pDC &
cDC1)
TRPS1; STK24; SLC16A3; SIRPA; SIGLEC8;
S100A4; RIN2; REL; PILRA; NFAM1; NCF2; MAFB; LRP1; ITGAM; IL1R2; IL1B;
IGSF6; IFI30; FHL3; EPB41L3; DOCK4; DHRS3; CSF3R; CSF1R; CLEC4A; CD300A;
C19ORF59; ADRBK2; TREM1
TNFRSF1B; TLR8; TICAM2; STK10; SP2; SLFN12; SIGLEC9; SIGLEC7; RNASE2;
PHF21A; LST1; LIMD2; LILRB2; LILRB1; LILRA6; LILRA3; IFITM2; GNGT2;
GBP4; FAM111A; EMR1; DPP10; DENND1A; DDX58; CDKN2B; CD300LF; CD300LB; CD209; C10ORF11; ADAP1; CLEC6A; DAGLB; WDR45L; SIGLEC5;
SFRS5; S100A12; PLEC1; MYST1; MX2; MS4A8B; LRRC33; HSPA6; GK3P; GAPDH; FAM45B; CEBPD; CD1E; CD1B; FCER1A; KSR1; OAS2; PTGER3