HAL Id: hal-01693537
https://hal.archives-ouvertes.fr/hal-01693537
Submitted on 26 Jan 2018
HAL is a multi-disciplinary open access
archive for the deposit and dissemination of
sci-entific research documents, whether they are
pub-lished or not. The documents may come from
teaching and research institutions in France or
abroad, or from public or private research centers.
L’archive ouverte pluridisciplinaire HAL, est
destinée au dépôt et à la diffusion de documents
scientifiques de niveau recherche, publiés ou non,
émanant des établissements d’enseignement et de
recherche français ou étrangers, des laboratoires
publics ou privés.
Visual Variables in UML: a First Empirical Assessment
Yosser El Ahmar, Xavier Le Pallec, Sébastien Gérard, Truong Ho-Quang
To cite this version:
Yosser El Ahmar, Xavier Le Pallec, Sébastien Gérard, Truong Ho-Quang. Visual Variables in UML: a
First Empirical Assessment. Human Factors in Modeling , 2017, Austin, Texas, USA, United States.
�hal-01693537�
Visual Variables in UML: a First Empirical
Assessment
Yosser El Ahmar
∗ §, Xavier Le Pallec
§, Sébastien Gérard
∗and Truong Ho-Quang
¶∗CEA, LIST, Laboratory of Model Driven Engineering for Embedded Systems, P.C. 174, Gif-sur-Yvette, 91191, France
{yosser.ELAHMAR, Sebastien.GERARD}@cea.fr
§University of Lille, CRIStAL Lab UMR 9189, 59650 Villeneuve d’Ascq, France
Email: [email protected]
¶Chalmers, Göteborg University, Göteborg, Sweden
Email: [email protected]
Abstract—This paper presents results of an empirical research study of the Unified Modeling Language (UML) use in practice. We employed a selective range of research methodologies includ-ing in-depth semi structured interviews and quantitative analysis of > 3500 UML diagrams related to open source projects in GitHub. The aim of the study is to provide greater understanding about the use of UML and to particularly shed light on the use of the visual variables (i.e., color, size, brightness, texture/grain, shape and orientation) in practice. The theoretical perspective of the study is to explore the usefulness of the visual variables in UML. These latter are highly significant in reducing the cognitive load of human beings, when effectively employed. As with all qualitative study, findings should be carefully interpreted, they should be seen as providing better understanding about the aforementioned scopes. We conclude by discussions of the obtained results and lessons learned for future researches.
I. INTRODUCTION
By the 90s, numerous graphical modeling languages were used by the software engineering community. This is due to the increased acceptance of modeling and the emergence of Object Oriented systems. Each graphical modeling language uses its own graphic signs and meanings. That helped de-creasing intra-communities ambiguities but led to problems of interoperability between tool-vendors. Consequently, the Ob-ject Management Group (OMG) [1] standardized the Unified Modeling Language (UML) [2] as an attempt to resolve the latter interoperability issue. It has taken the advantages of the graphical representations and has defined UML as a visual lan-guage for specifying, constructing and documenting software intensive systems. The OMG exhaustively describes the UML graphic signs via a concrete syntax and their meanings (i.e., semantics) via an abstract syntax.
UML takes advantage of the high performances of the graph-ical system. This bi-dimensional system has a major interest compared to linear ones like the audio system or the textual one. In the audio system, there are two variations: the sound and the time. In a same time unit, the human ear hears only one variation: one sound. Whereas, in the graphical system, there are three possible variations: the X, Y planar dimensions and the visual aspect of a graphic sign like its color or its shape. In the same time unit, the human eye might perceive all the relationships between the three variations. [3] has subdivided
the variations of the visual aspects into six variables called retinal variables: Size, brightness, texture/grain, color, shape and orientation. X, Y planar axis (position) and the retinal variables are called visual variables [3]. The retinal variables are very significant in highlighting information. They are rapidly perceived because the reader’s eye can detect their variation without moving the visual brush, signals received on the retina are sufficient. The use of the retinal variables allow the human eye to perceive in a third dimension (i.e., depth perception). The depth perception does not require cognitive processing neither in the working memory nor in the long term memory (pre-attentive perception). Hence, it reduces considerably the cognitive load of human beings. UML mainly uses the shape visual variable to visually encode semantics (e.g., ellipses, rectangles, circles). The other visual variables are less employed, despite their aforementioned great performances. That leaves the opportunity to explore the usefulness of the other visual variables as a possible mean to enhance the UML use in practice. This possibility has been already recognized as advantageous in software engineering via the Cognitive Dimensions framework [4] and the Physics of Notations framework [5].
The exploration of the visual variables in UML requires understanding about; (i) Details about the situations of the use of UML in practice. (ii) Details about the actual state of use (or not) of the visual variables in UML. If numerous empirical studies treat the first scope (i) by investigating the use of UML in practice, less researches investigate the use of the visual variables (ii). These latter mainly focus only on the position visual variable to find effective layouts [6] [7] [8] with sometimes studies on colors [9]. (i) and (ii) are strongly related to each other and we deem that they have to be treated concomitantly. In fact, the use of the visual variables might depend on the way of the UML use by each practitioner. To fill this gap, we conducted a qualitative exploratory empirical study using interviews as strategy of inquiry. The purpose of the present study is to create more and better understanding about the situations of the UML use in practice. A situation refers to the activities, the stakeholders that are involved in each activity, the practices of UML users in employing UML and the purposes of such usages. In the captured situations,
the study aims at discovering the need for the visual variables in practice. If such need exists, we want to gain a great understanding about the kinds of visual annotation that UML practitioners perform, the purposes and the ways to do so. As a triangulation method, we analyzed the use of the visual variables in > 3500 diagrams related to open source projects in GitHub [10][11]. That aims at finding quantitative data that might reinforce the results of the interviews. Obtained results might help ongoing researches exploring the benefits of the visual system as a mean of resolving problems that the present study might reveal. They can also help studying the usefulness of the visual variables in enhancing the effectiveness of UML in the captured situations of use. Finally, they might help tool vendors enhancing the usability of their tools by making more ergonomic visual automation.
This paper presents results from the qualitative study that we have conducted with 8 experts and practitioners of UML. Then, it describes results of the analysis of the use of the visual variables in > 3500 UML diagrams from the models repository [11]. The study takes a deliberately broad interpretation of results from both methods, as it is meant to be exploratory.
II. DESIGN METHODOLOGY
We used a selective range of research techniques to gather data for our study. We used both qualitative study via in-depth interviews and quantitative study via the analysis of UML models related to open source projects in GitHub [11]. Such use of a variety of types of data helps us ensure a better coverage and a greater understanding about our aforemen-tioned and following two research questions: (i) What are the details about the situations of the use of UML in practice and particularly the information that practitioners need to visualize. (ii) what are the details about the actual state of use (or not) of the visual variables in the previously captured situations. The qualitative in-depth interviews with 8 experts and practitioners of UML help us gain understanding about the use of UML and the use of the visual variables in practice. It allows us to understand the relationships between both kinds of use. The analysis of the UML models related to open source projects helps us gather quantitative data, particularly, about the use of the visual variables. It allows us mainly to answer the second research question (ii). Conclusions about the amount of the visual variables use were calculated in a sample of > 3500 UML diagrams. That also enables us to build conclusions about the effectiveness (or not) of such usages based on existing theories [3]. The present study is conducted as an attempt to help us achieving our mid-term goal in exploring the high performances of the visual variables to enhance the effectiveness of UML in practice.
A. Interpretation of results
We need to be particularly careful about how we analyze the results of our study and the conclusions that will be drawn from it. In fact, the first intent of this work is to create better understanding about the use of UML and the use of the visual variables in practice. It is not meant to
verify hypothesis or generalize findings. It mainly serves as an exploratory study to help ongoing researches around UML. Analysis of our interview data has been carried out using the ‘grounded theory’ approach [12]. For that, we began by manually transcribing the interviews from audio to textual form. We read throughout the data and identified themes and descriptions. We tried to interrelate them using the grounded theory approach then we interpreted the findings. The analysis of the UML models related to open source projects involved some basic enumerations and simple statistical calculations to get overall sense about the use of the visual variables in UML. The major effort was spent on the manual classification of the different diagrams based on the different usages (or not) of each visual variable. That helped us reporting on the state of practices of UML modelers in using the visual variables. B. Data collection procedures
1) Interviews: We conducted a series of semi-structured
in-depth interviews with 8 participants (6 from industry and 2 researchers). 7 interviews have been carried out by phone and one face to face interview. As the first intent of the present work is to understand in depth the use of UML in practice, we were particularly interested by practitioners of UML. They come from a variety of backgrounds and with a range of expertise in UML. The interviews lasted approximately 30-60 minutes and began with a brief announcement of the goal of the study. We also introduced the fact that interviews will be anonymous and asked permission to record them. Then, we asked participants about their current position and level of experience with modeling using UML. We followed with questions about the situations of UML use in practice to answer our first research question. That included the purposes of the use of UML, the activities done with UML diagrams, the employed diagrams, the reasons of using a particular diagram, the sought information and the ways of using UML in a project from the beginning until the final steps. Then, we asked questions about their current use (or not) of the visual variables in practice. That concerned the identification of the utility of the visual variables in practice, the most used visual variables and the manners of their use in practice. As for any semi-structured interviews, we have identified a number of topics that have to be covered in each interview. But, we strongly encouraged participants to explain details of their claims by pointing out that the minor detail is very important for our study. All the interviews have been conducted in the form of a discussion where the interviewer followed the logic and the reasoning of the participants. Finally, the interviews were recorded and transcribed with the permission of the participants.
2) Models database analysis: We manually analyzed the
use of the visual variables in > 3500 UML models related to open source projects in GitHub [11] [10]. Most of these diagrams are class diagrams, exactly 3328 class diagrams, 392 are sequence diagrams (The models repository is already biased towards structural (class) models [11]). This aims at gathering quantitative data that might reinforce the interviews
results. To that end, we first began by identifying the visual variables that we will study, notably: the size, brightness, color, texture and orientation. Then, we manually classified the UML diagrams based on their containment of a particular visual variable (In case of two or more visual variables, we created a new dedicated folder). For each visual variable (i.e., for each folder), we classified the diagrams based on the nature of its use. In fact, we observed that each visual variable might be differently applied to UML elements: on the border, text, background, edges, heads and/or compartments. We also differentiated significant visual variables variations and non significant ones. In fact, a visual variable variation is considered as significant if there are different categories of this latter in a same diagram (e.g., blue, green, red are different categories of the color visual variable). The latter kind of variations is very important for our study. In fact, they mean that authors of the corresponding diagrams wanted to highlight information using a particular visual variation. We will further concentrate on their analysis to understand in depth their use and answer our second research question. Non significant variations refer to the use of a single category of a visual variable (e.g., all the classes are yellow).
III. INTERVIEWS
We have identified interviewees by focusing on their levels of experience in modeling using UML and by ensuring their practice of UML. We asked all our contacts in order to identify industrial practitioners who might be willing to be interviewed. We have first done an announcement on mailing lists contain-ing potential practitioners of UML: Papyrus tool developers and users community. We have received two answers to that announcement. The first one has been discarded because the corresponding profile did not match with our target population. The second one was retained because he had the adequate target profile: practitioner and UML expert. Then, we sent direct mails to industrial experienced practitioners in the MDE community. We asked them to participate in our study or ask other potential persons that might be interested and interesting for our study. We contacted 11 persons where: 6 persons accepted our request, one person suggested another one that he deemed more interesting for our study and who was retained, two persons have not answered to our mails and finally two indirect contacts have not accepted to participate to our study because they are not experts and practitioners of UML. In total, we have carried out 8 interviews with 8 participants all experts and practitioners of UML. Roles of the interviewees range from the requirement manager, software architect, software designer, consultants, and software engineers. They work on different domains: transportation, aerospace engineering and defense, avionics, telecommunication, E-commerce, insurance, banking, etc. 5.5 hours of interviews have been recorded and manually transcribed.
A. Analysis
1) Situations of UML use in practice:
a) Purposes of the use of UML: Results of the present
qualitative study revealed that communication is the first purpose of using UML in practice. All the 8 participants have confirmed their use of UML diagrams as a communication vehicle. Communications might be held internally within the project teams or with costumers. This finding is also confirmed by the previous empirical studies in this field [13][14]. The next paragraph further focuses on our results about UML use in communications. The second purpose of using UML is code generation. The latter finding is contradictory with previous empirical studies [15] where code generation generally appears in the last ranges. However, that seems logic in our case because most of our interviewees are practitioners of MDE approaches. They use models from early design steps until maintenance tasks. The third purpose of using UML is to draw the participants own understanding in an informal way where UML diagrams are considered as a “map of the system”. That might be done using a pen and paper or on a white board. In such kind of use, participants do not care about the conformity of their diagrams to the UML standard. Their goal mainly concerns the comprehension of the system to be built and its conformity to the clients needs. Finally, UML diagrams are less employed for model execution and model analysis.
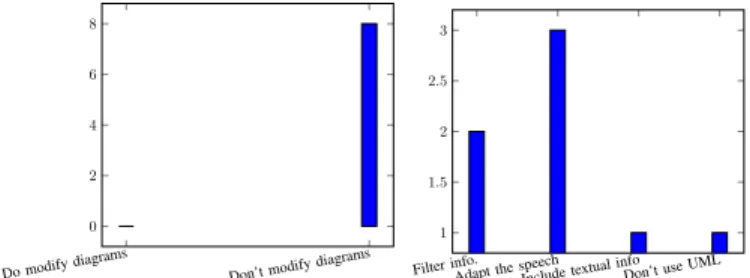
b) UML and communications: We asked our
practi-tioners about their practices of using UML diagrams for communications. We distinguished two types of audiences: persons who are familiar with UML (e.g., technical team) and non-familiars with UML (e.g. customers). We found out that all our practitioners don’t modify (i.e., contextualize) their diagrams for communications with persons who are familiar with UML (Figure 1). They argue that all the stakeholders
Do modifydiagrams Don’tmodifydiagrams 0
2 4 6 8
(a) Communication with familiars with UML
Filter info.Adaptthe speech Includetextual
info Don’tuse UML 1
1.5 2 2.5 3
(b) Communications with non-familiars with UML
Fig. 1: The need to contextualize UML diagrams for commu-nications
already know and understand the language. However, when it is about discussing with customers, they react differently. Most of the practitioners don’t modify their diagrams but try to adapt their speech to the audience. Following are two claims from our practitioners:
“. . . We kind of read the diagram to them then we say our interpretation and they just hear what we say and they agree or not with that. . . ” (Transcript 3)
“I didn’t ask him to learn all of UML but like for the class diagram I would explain the class you know what the class is,
the attributes and relationships that takes only a few minutes and then... the subject matter he is really familiar when he sees that these boxes as you know class called solution or column or pump and types of things that are easier to work with...” (Transcript 4)
Other interviewees would prefer filter some information from their diagrams to keep only those interesting for their commu-nications. To that end, they omit technical details that don’t really matter to their customers. They try to keep diagrams simple to better communicate.
“. . . we actually try to simplify as much as possible in our ... UML model because they aren’t UML experts so we try to filter out all. . . We try not to overload our diagrams with labels everywhere that non UML experts will not understand” (Transcript 7)
Finally, one practitioner prefers not using UML when dis-cussing with non-familiars with UML.
Generally, all our practitioners were aware of the unsuitability of UML for all types of communications. They try to find dif-ferent manners to facilitate such use. Rare of the practitioners has mentioned the recurrent use of the visual variables to adapt the diagrams to communications. This fact is mainly due to problems with tools (see Section 6).
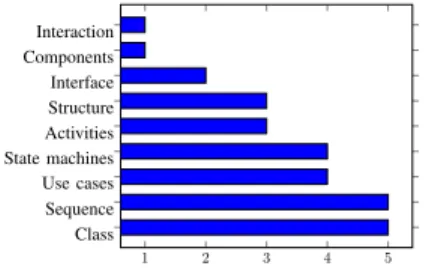
c) Used UML diagrams: Interviews showed that class
diagrams and sequence diagrams are the most used ones in practice (Figure 2). Different reasons are given to justify the choice of such particular diagrams. A software engineer argues that the class diagram is the most expressive notation in UML for modeling data. A software designer uses the class diagram to have a design of the database. A software architect pointed out that class diagram is used to divide the work among the different teams involved in a same project. Class diagrams are also employed to draw the business entities of the systems and to represent the functional relationships between these latter. Concerning the sequence diagrams, they are most used to define the interaction between the classes and interactions between users and the solution (i,e., the common definition of a sequence diagram). Sequence diagrams are also used
1 2 3 4 5 Class Sequence Use cases State machines Activities Structure Interface Components Interaction
Fig. 2: UML diagrams used in practice
in the definition of the white box part of a solution and to realize specific use cases. The use case diagrams and the state machines diagrams are ranked second among the most used UML diagrams in practice. The purpose of creating use case diagrams is to enumerate the functions to develop and to specify actors and the interactions between them. Eventually, that refers to the definition itself of a use case diagram. Our
requirement manager justifies his use of the use case diagrams by the fact that such use is recommended by the safety require-ment standard. Use cases are also used to drive our software engineer thinking then they will be part of the documentation. State machines are mostly used to design the behavior of the systems to be built or as an executable model. Activity and structure diagrams are the fourth most used diagrams by our practitioners. Activity diagrams are mostly seen as an elaboration of the use cases and a representation of the systems features. They are also used for the business process modeling and as a communication vehicle with customers. Then come the interface, component and interaction diagrams as less used ones. These findings are coherent with previous empirical studies in this area [15][14].
d) Pattern of UML use in practice: We asked the
inter-viewees to describe in detail their practices in using UML to build a system or a project. We analyzed the answers to this question and were able to identify a pattern of the use of UML by our interviewees. All our practitioners begin by gathering the requirements from the customer. That might be in a textual form or via a modeling session.
“The three people working on the project for example, we interview users who want the system and we understand from them what the requirements are, then we translate these requirements. It is like we have a modeling session, we sit with them the three of us and we interview that, what do you imagine blablabla. And then we capture the use cases and we
start populating a use case diagram...”(Transcript 3)
At this level, the models serve as a support of communication with the customer and within the technical team members. This step allows our participants to draw the big picture of the systems to be built. One interviewee mentioned the advantages of representing the system in a visual form instead of text. “Drawing the system instead of writing is a good tool to communicate and share mind viewpoint. The vision goes more quickly, we can decide more quickly about the architecture, the architecting stuff.” (Transcript 6)
Then, participants move to an understanding session where they review and check the requirements of the customer to ensure they correspond to their needs.
“We want to represent the system as it is and we want to understand the needs may be to understand the way to go to the system to be. So we used different diagrams offered, provided by UML to draw the big picture of the – context to
deeply understand what is the need.” (Transcript 6)
To that end, they might need to go back to the customer and review the requirements in another modeling session. Once ensured that their models match well with the requirements of the customer, they split the work among the persons involved in that project. To that end, UML might be employed as a discussion vehicle via the class and use case diagrams. Finally, each participant continue using UML for his particular needs: model simulation and execution where the models represent the code. They might generate code from them or continue coding the system and keep the created models in the documentation. In all cases, the models will populate
the documentation that describes each project or system. To these ends, most of our practitioners use a modeling tool in their practice. One interviewee pointed out that the use of a modeling tool depends on his needs. If it is about gaining his own understanding, he settles for a pen and paper. Otherwise, if it is about automation, he do use a modeling tool.
e) Searched information: We asked our practitioners
about information that they need to visualize in practice. We distinguish two types of information. First, we find the semantic information (i.e., what is modeled in a diagram). Following are examples of semantic information mentioned by our interviewees: Input and output statements for the requirements, to see the communication in a sequence diagram to understand the logic, to see which system does what, to search the across functions, to see the interactions of a practitioner own system, to search for references for specific signals or events in the model, specific signal in a specific protocol or interface that trigger a state machine. Second, we find what we called extra-semantic information. It consists in non-semantic information but that can be extracted from a UML model. Examples of extra-semantic information are: level of implementation of the classes, bugs in the model in the case of model execution.
We observe that practitioners need to visualize information on their diagrams. Before going to the documentation, UML diagrams are subjects of many visualizations where practition-ers need to search for important information to accomplish their tasks. If we link this finding to the previous results about the purposes of using UML in practice, most of the searched information belong to the “drawing of understanding” purpose. Practitioner visually navigate in their diagrams to find accurate information to build the mental map of their systems or projects.
2) Visual variables in practice:
a) Color: We asked our practitioners about their need
for colors in practice and about examples of information they needed to highlight using them. Again, we distinguish two types of information: semantic information and extra-semantic information. Only two semantic information were mentioned by one single practitioner: Important features like inheritance or interface and elements that have the same semantic. Most of the interviewees used color to highlight extra-semantic information. The progress of the implementation of classes has been mentioned by three practitioners. They want to visualize the progress of the development of their classes directly on the diagrams. Examples of extra-information mentioned are:
• Role in the design (criticality, parts of patterns (especially MVC), parts of layers, levels of security).
• Status in development (progress in implementation,
test-ing, execution).
• Distribution of tasks between the stakeholders (ownership
of each class).
Besides, one practitioner mentioned that colors must not be used to highlight semantic information. He argues that the diagram should be understood without coloring which might disappear in case of the use of black and white printers.
“We have discussed and said that we should avoid coloring. At least if the colors have a specific semantic I mean you should be able to understand the diagram without the colors we can’t put any semantic meaning into the colors because if you lose the colors when you print into black and white printers I mean it is pretty fundamental to still have the same semantic of the
diagram”. (Transcript 5)
Furthermore, we observe that most of the examples of high-lighted information using colors are “selective” information: Practitioners want to highlight UML nodes belonging to a same group (e.g., MVC elements, elements that have the same semantics) together. They also need to highlight “ordered” information (e.g., progress of implementation, important fea-tures).
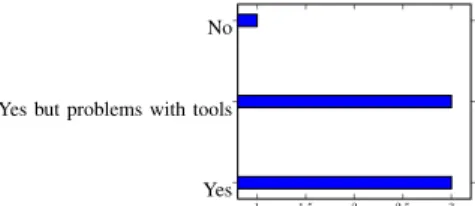
1 1.5 2 2.5 3
Yes Yes but problems with tools No
Fig. 3: Utility of colors in practice (Were colors helpful?) b) Utility of colors in practice: We asked our practition-ers if the previously mentioned use of colors has been helpful. We found out that most of them agree on the added value of colors and that their use was helpful in practice. Figure 3 details the answers of the participants. 3 interviewees totally agree on the utility of colors in practice. The same number of interviewees confirm that colors are helpful in practice but there are problems with modeling tools that deteriorate such use. Besides, they express their need for an automatic and efficient tool and propose some recommendations that will be discussed in Section 6. One interviewee stresses that colors are helpful but only for communications.
c) How to use colors? : In case of the use of colors,
we wanted to understand how practitioners do chose colors. We found out that only two practitioners use some internal conventions of their companies. Following are examples of conventions used within two different companies:
“Non-tested functions: Blue; safety functions: yellow. . . ” (Transcript 1)
“To communicate the green means we have it, yellow means
in progress, red means we –“ (Transcript 3)
The majority of interviewees do not have internal conventions, they follow their own tastes.
“In my domain which are in general embedded systems we can use blue for that software functional related, I use orange for everything that software platform related to framework system, drivers, etc and red for everything that is material, hardware related.”(Transcript 7)
“I avoid red because red means mistake and green is nice
because it means correct.”(Transcript 1)
One practitioner says that they have internal conventions but are used in an ad-hoc manner.
an ad-hoc manner. We have just documents to follow but no
body follows them in a formal manner.”(Transcript 6)
Then, we wanted to know if practitioners add legends/keys when they use colors. We found out that the majority of practitioners do add legends or would like to do so: 2 practi-tioners confirm that if they use color, they add keys. Two other practitioners would like to add keys but there are limitations in the used modeling tools (Figure 4).
At this level, we observe that most of the practitioners neither
2 2.5 3 3.5 4
No
Yes/ would like to add them
Fig. 4: The need for keys in practice
follow internal conventions nor add keys when they use color. Such behavior is non effective because keys are primordial if at least one visual variations does exist [3]. That might create ambiguities to understand the diagrams in question (e.g., by the author himself after a long time or another team member who might need to read it while maintenance tasks).
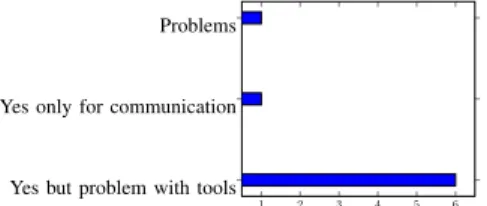
d) The other visual variables: We asked an open ended
question about the utility of the other visual variables (i.e.; size, brightness, texture/grain and orientation) in practice. The majority of our practitioners confirms that the use of the visual variables might help using UML in practice (Figure 5). In
1 2 3 4 5 6
Yes but problem with tools Yes only for communication Problems
Fig. 5: The need for the visual variables in practice parallel, they stressed on the effectiveness and usability of the employed tools for that purpose. The utility of the visual variables directly depends on the efficiency and usability of the tools. One interviewee argues that these visual variables might be helpful only for communications. If it is about understanding or using his own diagrams (i.e.; that he creates), he will not use them.
“If I have to model a function, I AM the designer, I am modeling this function, so I don’t see how I should use visual
annotations.”(Transcript 1)
Another interviewee thinks that the use of the visual variables might create a mess. The size visual variable might make big diagrams less readable. Texture also might create problems of readability and printing issues.
“Size: No because most of the time, the models are so complex. So having classes bigger than others make the diagram less
readable.” (Transcript 8)
“Texture: The diagrams are printed and stuck in the wall so using texture... to me it is making the model less readable... it could be more beautiful for business people. For technical
people I don’t think it will be added value.”(Transcript 8)
The use of the visual variables depends also on the size of the working teams. In large organizations, the use the different visual variables might create a mess.
“In smaller teams, probably they are perfectly well where you can align and decide the coloring rules and so on but as long as get a little bit bigger, then going and using different visual variables... just creates a mess.” (Transcript 5)
Ongoing researches about the use of the visual variables in UML should take into account these claims and provide effective material (i.e., via theories and convenient tools) to handle the aforementioned problems.
IV. MODELS REPOSITORY ANALYSIS
Fig. 6: Analysis of the visual variations in the models reposi-tory.
As mentioned in Section 3, we distinguish significant vari-ations of a particular visual variable and non significant ones. In that context, results of the analysis of the models database show that 22% of the diagrams present a significant visual variation (Figure 6.1). That means that modelers did need to highlight information and used the visual variables to that end. As depicted in Figure 6.2, color, brightness and size are the three most used visual variables. We found out that only one diagram is using the texture visual variable and the orientation is never used. 67 % of the diagrams present non significant variations (Figure 6.1). Such non-significant variations refer to the default configurations of the used modeling tools (e.g., by default, all the classes might be yellow, blue, green, gray, etc,.). 11% of the diagrams are purely black and white and do not present visual variations.
A. color
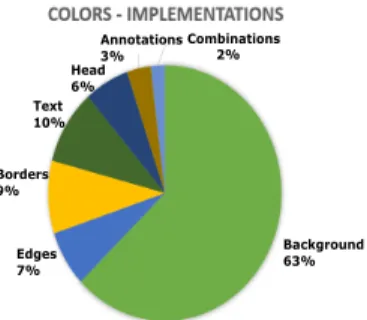
Color is the most used visual variable to express significant visual variations by 80% (Figure 6.2). We analyzed details about the use of colors and observed that they are differently applied to UML elements: background, borders, edges, text, heads and compartments. We found out that colors are applied to the background of the UML elements in 57% of the diagrams that present significant color variations (i.e., classes or lifelines) (Figure 7). 10% of the diagrams present a color variation of the contained text of an UML element: class name,
Combinations 2% Annotations 3% Head 6% Text 10% Borders 9% Edges 7% Background 63%
Fig. 7: How are colors applied to UML elements?
attributes, methods or even text related to comments. 9% of the diagrams present color variations of the borders of UML elements. Modelers vary only the border of packages and classes. Finally, we observed that modelers add information in their diagrams using colored text or arrows. We looked further into detail to find out the information that modelers wanted to highlight in the UML diagrams. However, it was difficult to identify them. The latter difficulty is due to the lack of keys or any information that designate the meaning each color variation. In fact, only 4% of the diagrams that present a color variation do contain keys or simply meanings of the applied visual variations (Figure 8). 14% of these keys are not up-to-date with the corresponding diagram. That might occur because the used tool does not automatically update the keys. This finding joins the interviews results where practitioners have raised their need to add keys and pointed out the limitations of tools to add these latter. We analyzed the
No keys 96%
Present Keys 4%
Fig. 8: Do modelers add keys/legends?
highlighted information when keys are available. 28% of the diagrams present the Model, View and Controller elements as highlighted information. They use the following sets of colors: (pink, yellow and mauve), (green, yellow and mauve), (blue, orange and green) and (yellow, green and red). All the highlighted information are selective ones where different groups of elements can be visually grouped together.
B. Brightness and size
As mentioned above, the brightness is the second used visual variable. As colors, brightness is mostly employed to highlight selective information. Modelers chose different levels of brightness of a particular color or ranges of white and gray. Brightness is always applied to the background of UML elements. For the size variations, significant ones are mostly applied to text. Modelers change the thickness of the text that
they want to highlight (e.g., attributes, methods or just a part of them). Once, the different sizes of the text have been used.
V. STATE OF THE ART
A. UML use in practice
Several empirical studies investigating the use of UML in practice do exist in the literature. [16] evaluates the costs and benefits of modeling in practice via discussions with 38 professionals at a developer-community meeting. The authors found out that the three main advantages of UML are: the ability to handle the growing complexity of software develop-ment by working at higher levels of abstraction, traceability from requirements to low level design and more efficient communications. They pointed out problems that should be addressed. In fact, participants claimed the need to efficiently communicate using UML diagrams. They emphasized the importance of keeping diagrams focused and as simple as possible. They also pointed out the difficulty to perform a research to find relevant occurrences, spacial layout problems and other issues. [13] presents results of a survey of 113 software practitioners that studied the motivations of using code centric versus modeling centric approaches. They found out that UML is the most used notation in practice and quality of generated code is one of the biggest problems with modeling tools. [13] Wojciech and al. conducted a controlled experiment to assess the benefits and costs of using UML particularly while maintenance tasks. They showed that UML diagrams helped participants fixing changes but increased the development time due to the overhead of updating the UML diagrams. [15] discusses results of a web survey with analysts that are familiar with UML. It investigates the purposes of us-ing UML in practice, the used diagrams for each purpose and the degree of success UML has in facilitating communications within development teams. All of these works gather different kinds of data (i.e., quantitative and/or qualitative) to explore the UML use in practice. They try to answer diverse initially fixed research questions about UML. They analyze data from different angles/perspectives. However, no work has attacked the angle of investigating the situations where practitioners need to visualize information, the sought information and eventually the use of the visual variables in practice. We deem inescapable to conduct the present empirical research to further study the usefulness of the visual variables in UML.
B. The visual variables in practice
If some works study the impact of the visual variables use on UML, they focus only on the following two visual variables: position via layouts and colors. The impact of the other visual variables has not been studied, despite their great performances in reducing the cognitive load of human beings. A lot of researches aiming at finding effective layouts have been conducted. Finding the effective layouts was and still is an important topic in software engineering field. [6] [7] [8] aim at finding effective layouts based on diagram comprehen-sions (i.e., ask comprehension questions about diagrams with different layouts) and user preferences (i.e., ask participants to
mention their preferences on diagrams with different layouts). The use of colors has been less investigated. [17] evaluates effective layouts based on class diagrams comprehension via an experiment. It uses colors to highlight information on the diagrams. The authors found out that color helped participants to answer questions. [9] uses eye tracking to evaluate the use of colors, layouts and stereotypes in the comprehensions of UML class diagrams. The latter experiments showed that colors were helpful for participants. However, all of these works are quantitative studies. No qualitative research have been conducted to present better understanding about the actual state of use of the visual variables in practice. They are all controlled experiments, they don’t reflect the practices of UML users and their opinions about such usages. No exploratory filed study does exist in this area.
VI. DISCUSSION AND LESSONS LEARNED
Results of the interviews show that UML diagrams are employed in several situations (e.g., communication, drawing of understanding, analysis) using different diagrams (e.g., classes, activities, state machines). These situations involve many visualization tasks where practitioners need to research information important to accomplish their work. These infor-mation might be semantic or extra-semantic ones. Interviews also show that colors are sometimes used in practice. Such use has been recognized as helpful when used by our practitioners. Concerning the other visual variables (i.e., size, brightness, texture/grain and orientation), practitioners do not actually use them but deem that they might be helpful and useful in practice. However, such usefulness directly depends on the usability of modeling tools. To reinforce their claims, practitioners mention recommendations about effective ones. First, they express the need to an automatic tool that updates the visual variations in case a highlighted information does change or evolve. In the extra-semantic information about the progress of the implementation, classes should automatically be updated when a class status moves from in progress status to implemented. Practitioners have also raised the need to add keys when they use colors. They pointed out that not all modeling tools present such feature. In that context, they suggest to have an interactive legend that enables, for instance, the possible update of the visual variations in the UML diagram directly in the keys and vice versa. They also recommended the possibility to define rules that map the information to highlight and the corresponding visual variables. Furthermore, practitioners stress on the subtlety of the used visual variations. The visual variables have to be associated to particular meanings. They also stress on the necessity to consider large organizations where a big number of persons collaborate on the same models: the tool should handle the conflicts that might appear.
As with the interviews, results of the quantitative analysis of the UML models show that color is the most used visual variable. But, concerning the other visual variables, it shows that brightness and size are also used to highlight information. In the models repository, only 4% of the diagrams present keys
and sometimes, they are not up-to-date with the corresponding diagrams. The latter finding confirms the interviews results about the need to an automatic tool. Existing theories like [3] prove that keys are mandatory when at least one visual variation does exist in a graphical representation. It helps reading and understanding the meanings of such variations. Indeed, when we tried to analyze the models in the repository [11], we encountered problems to understand the meanings of the visual variations applied by modelers. That might be problematic in practice when modelers want to understand the diagrams containing some significant visual variations. In addition, we observed that the used visual variables are differently applied to UML elements: border, background, text, etc. In that context, there are absolutely implementations that are more effective than others. Ongoing researches should better explore the effective ones [18].
Via both research methods, we observed that colors are mostly employed to express selective information. Based on [3], such use is effective. Selectivity is one of the perceptive properties of colors, the human eye can rapidly select groups of elements having the same color together. However, we also noticed that practitioners use colors to express ordered information (e.g., the progress of the implementation of a project). Such use is non effective [3]. In fact, the human eye can not order colors but it can spontaneously and rapidly order different levels of brightness (i.e., from dark to light and vice versa).
VII. CONCLUSION
The present empirical study provides understanding about the use of UML and the visual variables in practice. 8 interviews have been carried out with experts and practitioners of UML. In addition, + 3500 UML diagrams were analyzed to discover the employed visual variables and discuss the ways of their usages. Interviews show that UML diagrams are used in different situations where practitioners need to visualize infor-mation. Results from both research methods show that color is the most used visual variable. It is differently employed (borders, text, edges, compartment, etc,.) to express selective information. But, it is also employed to express ordered infor-mation which is not effective based on [3]. Furthermore, keys are primordial when at least one visual variation does exist [3]. However, our practitioners and the analysis of the UML models show that they are not often added. This is mainly due to problems with modeling tools. These results might help ongoing researches providing theories to effectively employ the visual variables (e.g., effective implementations, rules of efficiency to map information to the most adequate visual variable). Second, effective tools, that respect the practitioners recommendations for instance, must be provided. Besides, we begun developing such tool in Papyrus [19].
In the future, other empirical studies should be held to rein-force the findings of the present research. That might be done via surveys, experiments or discussion panels. The contexts of the use of the visual variables in the models repository might be collected to further link the performed visual variations to the real situations of use.
ACKNOWLEDGEMENT
We would like to gratefully thank all the practitioners who have accepted to participate to the interviews.
REFERENCES
[1] “Object management Group, howpublished= http://www.omg.org/.” [2] “UML specification, howpublished= http://www.omg.org/spec/uml/.” [3] J. Bertin, “Semiology of graphics: diagrams, networks, maps,” 1983. [4] T. R. G. Green and M. Petre, “Usability analysis of visual programming
environments: a cognitive dimensions framework,” Journal of Visual Languages & Computing, vol. 7, no. 2, pp. 131–174, 1996.
[5] D. L. Moody, “The physicss of notations: toward a scientific basis for constructing visual notations in software engineering,” Software Engineering, IEEE Transactions on, vol. 35, no. 6, pp. 756–779, 2009. [6] K. Wong and D. Sun, “On evaluating the layout of UML diagrams for program comprehension,” Software Quality Journal, vol. 14, no. 3, pp. 233–259, 2006.
[7] B. Sharif and J. I. Maletic, “An empirical study on the comprehension of stereotyped UML class diagram layouts,” in Program Comprehension, 2009. ICPC’09. IEEE 17th International Conference on. IEEE, 2009, pp. 268–272.
[8] H. C. Purchase, L. Colpoys, D. Carrington, and M. McGill, “UML class diagrams: an empirical study of comprehension,” in Software Visualization. Springer, 2003, pp. 149–178.
[9] S. Yusuf, H. Kagdi, and J. I. Maletic, “Assessing the comprehension of UML class diagrams via eye tracking,” in 15th IEEE International Conference on Program Comprehension (ICPC’07). IEEE, 2007, pp. 113–122.
[10] R. Hebig, T. Ho-Quang, G. Robles, M. Fernandez, and M. R. V. Chaudron, “The quest for open source projects that use uml: mining github,” in Proceedings of the ACM/IEEE 19th International Conference on Model Driven Engineering Languages and Systems. ACM, 2016, pp. 173–183.
[11] “UML repository,” http://oss.models-db.com/.
[12] F. Shull, J. Singer, and D. I. Sjøberg, Guide to advanced empirical software engineering. Springer, 2007.
[13] A. Forward, T. C. Lethbridge, and O. Badreddin, “Perceptions of Software Modeling: A Survey of Software Practitioners,” University of Ottawa, Tech. Rep., 2010.
[14] W. J. Dzidek, E. Arisholm, and L. C. Briand, “A realistic empirical evaluation of the costs and benefits of UML in software maintenance,” Software Engineering, IEEE Transactions on, vol. 34, no. 3, pp. 407– 432, 2008.
[15] B. Dobing and J. Parsons, “How uml is used,” Commun. ACM, vol. 49, no. 5, pp. 109–113, May 2006. [Online]. Available: http://doi.acm.org/10.1145/1125944.1125949
[16] M. R. V. Chaudron, W. Heijstek, and A. Nugroho, “How effective is uml modeling?” Software & Systems Modeling, vol. 11, no. 4, pp. 571–580, 2012.
[17] O. Andriyevska, N. Dragan, B. Simoes, and J. I. Maletic, “Evaluating uml class diagram layout based on architectural importance,” in Visual-izing Software for Understanding and Analysis, 2005. VISSOFT 2005. 3rd IEEE International Workshop on. IEEE, 2005, pp. 1–6. [18] Y. El Ahmar, X. Le Pallec, and S. Gérard, “Empirical activity: Assessing
the perceptual properties of the size visual variation in uml sequence diagram.”
[19] S. Gérard, C. Dumoulin, P. Tessier, and B. Selic, “19 papyrus: A uml2 tool for domain-specific language modeling,” in Model-Based Engineering of Embedded Real-Time Systems. Springer, 2010, pp. 361– 368.