HAL Id: hal-02998085
https://hal.archives-ouvertes.fr/hal-02998085
Submitted on 14 Dec 2020
HAL is a multi-disciplinary open access
archive for the deposit and dissemination of
sci-entific research documents, whether they are
pub-lished or not. The documents may come from
teaching and research institutions in France or
abroad, or from public or private research centers.
L’archive ouverte pluridisciplinaire HAL, est
destinée au dépôt et à la diffusion de documents
scientifiques de niveau recherche, publiés ou non,
émanant des établissements d’enseignement et de
recherche français ou étrangers, des laboratoires
publics ou privés.
F. Damay, J. Sottmann, F. Lainé, L. Chaix, M. Poienar, P. Beran, E. Elkaim,
F. Fauth, L. Nataf, A. Guesdon, et al.
To cite this version:
F. Damay, J. Sottmann, F. Lainé, L. Chaix, M. Poienar, et al.. Magnetic phase diagram for Fe
3 – x Mn x BO 5. Physical Review B, American Physical Society, 2020, 101 (9),
�10.1103/Phys-RevB.101.094418�. �hal-02998085�
F. Damay,1 J. Sottmann,2 F. Lain´e,2 L. Chaix,3 M. Poienar,4 P. Beran,5, 6 E.
Elkaim,7 F. Fauth,8 L. Nataf,7 A. Guesdon,2 A. Maignan,2 and C. Martin2
1
Universit´e Paris-Saclay, Laboratoire L´eon Brillouin, CEA-CNRS UMR 12, 91191 Gif-sur-Yvette, France
2
Normandie Univ, ENSICAEN, UNICAEN, CNRS, CRISMAT, 14000 Caen, France
3
Laboratoire L´eon Brillouin, CEA-CNRS UMR 12, Universit´e Paris-Saclay, 91191 Gif-sur-Yvette, France
4National Institute for Research and Development in Electrochemistry and Condensed Matter,
Str. Dr. A. P˘aunescu Podeanu, nr.144, 300569 Timi¸soara, Timi¸s, Romania
5
Nuclear Physics Institute, 25068 REZ NEAR PRAGUE, Czech Republic
6European Spallation Source ERIC, Box 176, SE-221 00 Lund, Sweden 7
Synchrotron Soleil, Saint-Aubin BP 48, 91192 GIF-sur-YVETTE Cedex, France
8
CELLS ALBA Synchrotron, Carrer de la Llum 2-26, 08290 Cerdanyola del Vall`es, BARCELONA, Spain
(Dated: December 14, 2020)
The heterometallic ludwigite system Fe3−xMnxBO5recently investigated for its ferroelectric
prop-erties has been studied using synchrotron and neutron diffraction, combined with XANES and mag-netisation measurements. The results show that the Pbam crystal structure is preserved with little structural distortions up to x = 1.5, and that divalent Mn is substituted preferentially on the 3LL2 sub-lattice unit. As x increases, and up to Fe2MnBO5, the decoupled magnetic sub-lattices
charac-ter of Fe3BO5is preserved : magnetic order on 3LL1 (k1= (0 0 12), moments along b) survives with
reduced magnetic moment, while the correlation length of the magnetic order on 3LL2 (k2= (0 0 0),
moments along a) decreases. In contrast, for x = 1.5, a new k = (0 0 0) magnetic ordering, coupling both sub-lattices, is observed, with all moments aligned along c. These results provide new insight on the physical properties of the system, which are discussed in terms of three main parameters : (i) non-linear evolution of the substitution on each sub-lattice, (ii) changes in the direct-exchange and super-exchange couplings as Mn2+(3d5, isoelectronic with Fe3+) is introduced in the structure, and (iii) competing easy-axis anisotropy and magnetic exchanges along the 3LL legs in the decoupled sub-lattice regime. These three parameters are at the origin of an extremely rich (x, T) magnetic phase diagram in the Fe3−xMnxBO5 system.
I. INTRODUCTION
Ludwigite oxyborates correspond to the M2M’BO5
for-mula (where M and M’ are transition metals), as a refer-ence to the mineral Mg2FeBO5[1]. Vonsenite Fe3BO5[2]
is one of the most studied ludwigites [3], [4], [5] ; it crys-tallizes at room temperature in the Pbam (# 55) space group (a = 9.462 ˚A, b = 12.308 ˚A, and c = 3.075 ˚A), with four non-equivalent iron sites, Fe1 (2a), Fe2 (2d ), Fe3 (4g) and Fe4 (4h) (Figure 1a), following a commonly used labeling [6], [7], [8]. Its structure may be viewed as FeO6 octahedra sharing edges and corners, to build five
octahedra long and three octahedra wide zig-zag walls parallel to the c direction (Figure 1a). These walls de-limit triangular tunnels, also running along the c axis, occupied by boron atoms in triangular BO3
coordina-tion (O1, O3 and O5 in Figure 1a). Another structural description is also used in the literature [9], with two types of three-leg ladder (3LL) sub-lattices, consisting of three edge- or corner-sharing octahedra units, or triads, stacked along c : Fe4-Fe2-Fe4 (3LL1) and Fe3-Fe1-Fe3 (3LL2) (Figures 1b and 1c).
Fe3BO5 presents interesting physical properties,
ow-ing to the mixed valency 2 Fe2+ : 1 Fe3+, and the fact
that Fe3+ species (S = 5/2) occupy 3LL1 sites, while
sites 1 and 3 (3LL2) are occupied by Fe2+ (S = 2) only
[4], [10]. Below 290 K, charge ordering (CO) on 3LL1 leads to a supercell with a doubling of the c parameter, as evidenced by single crystal X-ray and electron diffrac-tion [6], [8], [11]. These unusual features also impact magnetic properties, with two magnetic transitions, cor-responding to the independent orderings of 3LL1 (TN 1
= 112 K) and 3LL2 (TN 2= 70 K) [8]. Fe3BO5was also
recently shown to exhibit magnetodielectric and multi-ferroic properties [11], and was also explored as a poten-tial anode for lithium-ion batteries [12]. A number of interesting features can therefore be found in ludwigites : low-dimensional magnetic units, coexistence of param-agnetism and magnetic order, or mixed valency with a non-random distribution of the species on different crys-tallographic sites. Although the ludwigite structure is able to incorporate various elements, including tetrava-lent cations, as shown by the long list of known minerals exhibiting this structure (e.g. fredrikssonite [13], bonac-cordite [14], azoproite [15], chestermanite [16], etc.), few reports deal with homometallic [17] or heterometallic ludwigites containing Mn, the latter focusing mostly on Cu2MnBO5 [18], [19], [20], or Mn3−xNixBO5 [21], [22].
ludwig-ite system Fe3−xMnxBO5, Maignan et al. report very
distinct dc susceptibilities for the x = 0 and x = 1 mem-bers, in addition to superparamagnetic-like spin dynam-ics for x = 1, in spite of the close spin configurations of Mn2+ and Fe3+, both being d5 cations [11].
More-over, the pyroelectric current measurements performed on these compounds reveal a larger polarization value at 5 K for Fe2MnBO5 than for Fe3BO5, coupled with the
disappearance of CO features, urging for a better under-standing of the general impact of Mn substitution on the vonsenite properties, also supported by the known impor-tance of CO and Fe octahedral geometry in explaining the physical properties of Fe3BO5 [23]. To this end, an
in-vestigation of the Fe3−xMnxBO5system was undertaken.
Synchrotron X-ray and neutron diffraction experiments, combined with magnetic susceptibility vs. temperature and X-ray absorption spectroscopy measurements were carried out. A complex magnetic phase diagram emerges, underlining the role of preferred substitution and its im-pact on the magnetic exchanges and anisotropy, and sub-lattices coupling.
II. EXPERIMENTAL
Fe3−xMnxBO5(0 ≤ x ≤ 3) samples were prepared by
solid state reaction at high temperature. Amounts of precursors were calculated to respect the O5
stoichiome-try. Mixtures of (Fe, Fe2O3, MnO and B2O3) or (Fe2O3,
MnO2, MnO and B2O3) were used for 0 ≤ x ≤ 1.75 and
2 ≤ x ≤ 3, respectively. Powders were pressed in the shape of bars or pellets and heated in evacuated quartz ampoules during 48 hrs at 950◦C or 1000◦C, respectively. For neutron diffraction experiments, specific samples (x = 0.5, 0.75, 1 and 1.5) were made from 11B enriched
B2O3.
The quality of the samples was checked by X-ray powder diffraction (XRPD) at room temperature (RT), using a PANalytical diffractometer (using Co or Cu Kα radia-tions). Small amounts of impurities are difficult to avoid in this system, mainly Fe3O4 and Mn3B2O6 for smaller
and larger x values, respectively. The samples were of poorer quality for 2 ≤ x ≤ 3, and their analysis was lim-ited to XRPD measurements only.
Direct current (dc) magnetic susceptibility (χ) was de-rived from magnetization data recorded in a field of 100 Oe, on warming from 5 to 300 K after a zero-field (zfc) or field (fc) cooling (MPMS, Quantum Design). Alter-nating current (ac) susceptibility was measured in the frequency range 101 – 104 Hz (h
dc = 0 Oe and hac = 10
Oe) (PPMS, Quantum Design).
X-ray absorption near edge structure (XANES) mea-surements were performed on the ODE beamline at the SOLEIL synchrotron for the 0.25 ≤ x ≤ 1.5 composi-tions. The X-ray absorption spectra were measured in a transmission configuration and recorded at RT with an
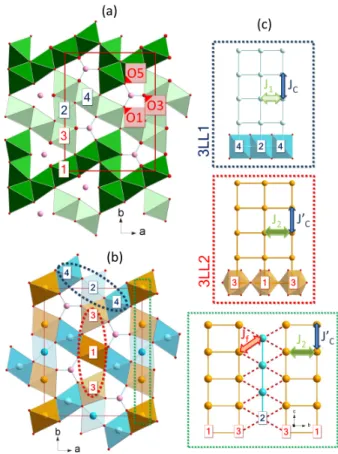
FIG. 1. (color online) : (a) Representation of the vonsenite Fe3BO5structure (projected along the c direction),
highlight-ing the FeO6octahedra sharing edges and corners to build five
octahedra long and three octahedra wide zig-zag walls (dark and light green ribbons). O1, O3 and O5 label oxygens of a triangular BO3 unit (boron atoms in pink). (b) Same
projec-tion of the structure highlighting the two types of three-leg ladders Fe4-Fe2-Fe4 (3LL1, in blue) and Fe3-Fe1-Fe3 (3LL2, in orange). (c) 3LL1 and 3LL2 ladders with corresponding first-neighbor magnetic exchange paths (JCalong the legs, J1
and J2along the 3LL1 and 3LL2 rungs, respectively), and
tri-angular topology of the Jf coupling between 3LL1 and 3LL2.
energy resolution of 0.5 eV. The spectra were calibrated in energy using Fe and Mn foil references, and normal-ized using the Larch package [24].
Samples with x = 0.75, 1 and 1.5 were characterized by synchrotron X-ray powder diffraction (SXRPD) on the CRISTAL beamline at the SOLEIL synchrotron (λ = 0.6694 ˚A) at RT and on BL04-MSPD at the ALBA syn-chrotron (λ = 0.4421 ˚A) in the 80 K to 300 K range. The powders were 20 µm sieved and filled in borosilicate capillaries (Ø 0.5 mm).
Neutron powder diffraction (NPD) vs. temperature was performed on the G4.1 diffractometer (λ = 2.426 ˚A) from 1.5 to 300 K, at LLB-Orph´ee, for x = 0.75, 1 and 1.5, and on the Meredit diffractometer (λ = 1.4618 ˚A), at the Nu-clear Physics Institute, in the same temperature range, for x = 0.5, 0.75, 1 and 1.5. Rietveld refinements were performed with the Fullprof program [25]. Symmetry
analysis was carried out using the FullprofSuite software [25] and the Bilbao Crystallographic Server [26], [27].
III. RESULTS
A. Crystal structure study of Fe3−xMnxBO5
1. Evolution of the crystal structure of Fe3−xMnxBO5 with
x at room temperature
a. Cell parameters
All samples within the series exhibit the ludwigite crystal structure with Pbam space group. This agrees with the electron diffraction study performed at RT for x = 0 and 1, which confirmed the Pbam cell with no superstructure [11]. The evolution of the lattice parameters, obtained from Rietveld refinements of the XRPD data for 0 ≤ x ≤ 3, is shown in Figure 2. For x = 0, the obtained cell parameters are in good agreement with those previously reported [4]. This is, however, not the case for Mn3BO5
(x = 3), for which the published single-crystal data [17] reports smaller cell parameters than for Fe3BO5, in
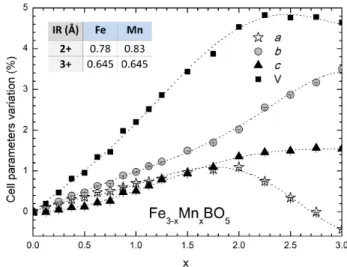
con-trast with our observation of a volume increase of ≈ 5% from x = 0 to 3. As shown in Figure 2, the cell vol-ume increases with x from x = 0 to 2, and then remains roughly constant. The lattice parameters all increase ac-cordingly with x from x = 0 to 2, above which (x > 2), c becomes nearly constant, while b increases and a de-creases. Comparing ionic radii (IR) of di- and tri-valent iron and manganese (IR are given in the inset of Figure 2 [28]), this behavior suggests that manganese is divalent up to x = 2. For x > 2, Mn3+ (with similar size to Fe3+)
may be present, and could be at the origin of the plateau observed in the evolution of the cell volume as a func-tion of x. This will be further confirmed in the light of the cationic distribution and species on each ladder, in section III A 1 d.
b. Cationic distribution
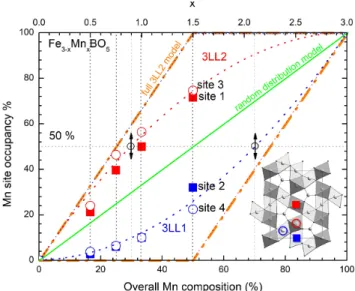
The analysis of the RT NPD data for x = 0.5, 0.75, 1 and 1.5 allows one to quantify the Fe and Mn distribution on the four cationic sites of the ludwigite structure, owing to the significant difference in the Fe/Mn neutron scat-tering lengths (0.954 and -0.373 10−12 cm, respectively). From the comparison of the refinements performed on different neutron diffraction datasets for a given sample, the site occupancy is estimated to be known with a pre-cision of the order of 5% for the four sites (see Table I). The Fe/Mn ratios determined from the refinements are in good agreement with the nominal compositions. The results are summarized in Figure 3, which represents the evolution of the Mn occupancy (in %) on each site vs. the overall Mn composition. The occupancies of sites 1 and 3 (3LL2) are roughly equal (red full squares and empty circles, respectively), an observation that holds for sites 2 and 4 (3LL1) as well (blue full squares and empty circles,
FIG. 2. : Variation (in %) of the lattice parameters a (white stars), b (grey circles), c (black triangles) and cell volume V (black squares) with x in the Fe3−xMnxBO5 series (from
Rietveld refinements of XRPD data at RT). Cationic sizes of high-spin Fe2+/3+ and Mn2+/3+ in octahedral environments are given in the inset [28]. Lines are guide to the eye.
respectively), which means that cationic distribution is nearly homogeneous within each ladder. In contrast, the Mn content in 3LL2 is systematically larger than that in 3LL1. Thus the 3LL2 ladder, which is the one contain-ing only Fe2+ for x = 0, is preferentially affected by the
Mn substitution, but only to some degree, as Mn also substitutes partially 3LL1 before all 3LL2 sites are filled with Mn. This preferred substitution also implies that the 1Fe : 1Mn threshold occurs for different x values de-pending on the ladder which is considered : x = 0.9 for 3LL2, and x = 2.1 for 3LL1 (black arrows on Figure 3). Another consequence of the Fe/Mn distribution on the transition metal sites is the presence of diffuse scatter-ing of non-magnetic origin (also called Laue monotonic scattering [29]), centered on Q = 1.15 ˚A−1on all neutron diffraction patterns, from x = 0.75 to 1.5 (inset of Figure 5b, shown for x = 1).
c. Fe and Mn valences
Mn K-edge XANES spectra are presented in Figure 4a, along with two reference spectra, MnO (Mn2+ species)
and Mn2O3 (Mn3+ species). Similar absorption
pro-files are observed for all the samples, independently of x, with the white line centred around 6550 eV (lower panel of Figure 4a), likewise to the MnO reference (see upper panel of Figure 4a). Thus, the Mn valence in the Fe3−xMnxBO5 series, up to x = 1.5 (highest x value
in-vestigated by XANES in this work), is confirmed to be 2+. The amount of Fe2+ species decreases with
increas-ing x (Figure 4b), confirmincreas-ing the gradual replacement of Fe2+ by Mn2+, which was found to occur preferentially
on the 3LL2 ladders (section III A 1 b). Indeed, the com-parison with the Fe K-edge XANES reference spectra of FeO (Fe2+species) and Fe
FIG. 3. (color online) : Evolution of the Mn distribution on 3LL1 (sites 2 and 4 drawn as full blue square and empty blue circles) and 3LL2 (sites 1 and 3 drawn as full red square and red blue circles) with x. The green line represents the case of a random distribution of Fe/Mn over both 3LL1 and 3LL2, which thereby become equivalent. The orange dashed line shows the extreme case where Mn is substituted on 3LL2 only, up to an overall composition of 50% of Mn (corresponding to x = 1.5), before gradually substituting 3LL1. The black circles on the horizontal 50% Mn occupancy line correspond to compositions (given by the small arrows) for which the Mn:Fe ratio is 1 in the chosen ladder. Inset : ab projection of the ludwigite structure emphasizing the preferred substitution of Mn on the dark grey octahedral sites 1 and 3 of 3LL2.
for x = 0, the absorption edge is close to that of FeO, in good agreement with the expected 2Fe2+:1Fe3+ ratio. Upon Mn-substitution, the Fe absorption edge shifts to higher energies and smoothly meets the Fe2O3
absorp-tion edge posiabsorp-tion at x = 1.5.
d. Evolution of interatomic distances and angles The evolution of the interatomic distances in Fe3−xMnxBO5 was obtained from combined Rietveld
refinements using NPD and SXRPD data for x = 1 and 1.5 (Figure 5) and from the literature for x = 0 [8]. The results are summarized in Tables I and II. In Fe3BO5,
the average <FeO> distance depends on the ladder which is considered : the Fe2O6 and Fe4O6 octahedra
forming 3LL1 are the smallest (with <FeO> = 2.09 ˚A and 2.06 ˚A, respectively), while iron octahedra in 3LL2 (Fe1O6 and Fe3O6) are bigger (<FeO> = 2.15 ˚A), in
agreement with preferred occupation of Fe2+ on 3LL2.
A similar observation can be made when increasing x up to x = 1.5, with a slight increase of the <(Fe/Mn)O> distances in all the octahedra, in agreement with the fact that Mn is only present as Mn2+ (see sections III A 1 a
and III A 1 c). With regards to octahedral distortion, in Fe3BO5, Fe1O6 and Fe2O6 (which are in the middle
of the triads forming 3LL2 and 3LL1, respectively) are
compressed, with one short apical Fe-O distance (x 2) of 2.04 ˚A and 2.06 ˚A, respectively, and one (x 4) long distance in the basal plane, of 2.20 ˚A and 2.11 ˚A, respectively. The Fe3O6 and Fe4O6 octahedra are more
distorted, with three sets of Fe-O distances, ranging between 1.95 ˚A and 2.21 ˚A. In all octahedra, the O-Fe-O angles also clearly deviate from 90◦.
Comparison with Fe1.5Mn1.5BO5shows that, although
the (Fe/Mn)2O6octahedron of 3LL1 is more regular than
in Fe3BO5, there is actually little evolution of octahedral
distortions with x (Table II). This particular behavior probably originates from the fact that there is no possi-ble atomic displacement along the c-axis (all atoms be-ing on (x y 0) or (x y 12) sites), and that the transition metal octahedra are more flexible than the BO3 units
with their short B-O distances (≈ 1.4 ˚A). This underly-ing rigidity of the BO3triangles could also be the reason
why high levels of Mn substitution (x ≥ 2) seem difficult to achieve in the series. It should be underlined further that O4 has a systematically “underbonded” character (short (Fe/Mn)3-O4 and (Fe/Mn)4-O4 distances), which is likely correlated with its specific position, linking both types of ladders and two zig-zag walls, while not being involved in a BO3 triangle. It leads to a clear
displace-ment of atoms on sites 3 and 4 of the ludwigite structure from the center of their O6 octahedra.
2. Crystal structure of the Fe3−xMnxBO5 series at low
temperature
For x = 0.5, 0.75, 1 and 1.5, the Pbam crystal struc-ture is observed down to 4 K from high resolution NPD, and further confirmed by SXRPD data at 122 K for x = 1. The lack of charge-ordering (CO) superstructures re-ported earlier by electron microscopy for x = 1 down to 90 K [11] supports the fact that Mn substitution suppresses charge ordering at least for x ≥ 1, but this remains to be confirmed for x = 0.5 and 0.75. For all samples up to x = 1.5, the contraction of the cell parameters with temperature is regular within the experimental error, and similar along a, b, and c. Table III summarizes the re-sults of NPD data Rietveld refinements performed at 180 K and 4 K for x = 1. It shows that there is a general decrease, with decreasing temperature, of the distances between transition metal sites, with the exception of the distance between sites 1 and 3 (d1−3) in 3LL2, and sites
1 and 4 (d1−4), which slightly increases or stays constant
within the standard deviation. Similarly, the contraction of the (Fe/Mn) octahedra is only slight, and the octahe-dral distortion remains almost constant when tempera-ture decreases.
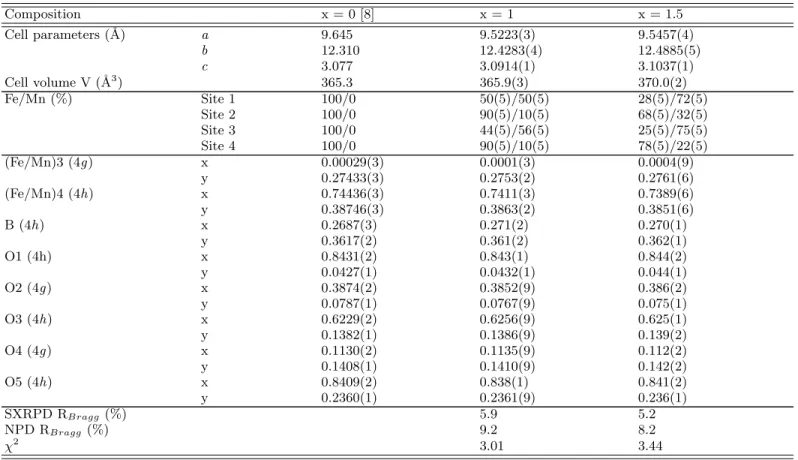
TABLE I: Results of combined SXRPD and NPD Rietveld refinements of Fe2MnBO5 and Fe1.5Mn1.5BO5 at 300 K (space
group Pbam, # 55). (Fe/Mn)1 and (Fe/Mn)2 are on Wyckoff sites 2a (0 0 0) and 2d (1 2 0
1
2) respectively. All other atoms are
on sites 4g (x y 0) or 4h (x y 12). Cell parameters and atomic positions in Fe3BO5(x = 0) at 320 K (from single-crystal X-ray
diffraction data [8]) are given for comparison. Isotropic thermal displacements parameters B were constrained to be identical for a given element. The B values obtained from SXRPD data are (in ˚A2) : B
F e/M n= 0.4(1), BB = 0.3(1); BO = 0.3(1) for x
= 1, and BF e/M n = 0.7(1), BB = 0.2(1); BO = 0.8(1) for x = 1.5.
Composition x = 0 [8] x = 1 x = 1.5 Cell parameters (˚A) a 9.645 9.5223(3) 9.5457(4) b 12.310 12.4283(4) 12.4885(5) c 3.077 3.0914(1) 3.1037(1) Cell volume V (˚A3) 365.3 365.9(3) 370.0(2) Fe/Mn (%) Site 1 100/0 50(5)/50(5) 28(5)/72(5) Site 2 100/0 90(5)/10(5) 68(5)/32(5) Site 3 100/0 44(5)/56(5) 25(5)/75(5) Site 4 100/0 90(5)/10(5) 78(5)/22(5) (Fe/Mn)3 (4g ) x 0.00029(3) 0.0001(3) 0.0004(9) y 0.27433(3) 0.2753(2) 0.2761(6) (Fe/Mn)4 (4h) x 0.74436(3) 0.7411(3) 0.7389(6) y 0.38746(3) 0.3863(2) 0.3851(6) B (4h) x 0.2687(3) 0.271(2) 0.270(1) y 0.3617(2) 0.361(2) 0.362(1) O1 (4h) x 0.8431(2) 0.843(1) 0.844(2) y 0.0427(1) 0.0432(1) 0.044(1) O2 (4g ) x 0.3874(2) 0.3852(9) 0.386(2) y 0.0787(1) 0.0767(9) 0.075(1) O3 (4h) x 0.6229(2) 0.6256(9) 0.625(1) y 0.1382(1) 0.1386(9) 0.139(2) O4 (4g ) x 0.1130(2) 0.1135(9) 0.112(2) y 0.1408(1) 0.1410(9) 0.142(2) O5 (4h) x 0.8409(2) 0.838(1) 0.841(2) y 0.2360(1) 0.2361(9) 0.236(1) SXRPD RBragg (%) 5.9 5.2 NPD RBragg (%) 9.2 8.2 χ2 3.01 3.44
B. Magnetic properties and magnetic structures of Fe3−xMnxBO5
Mn for Fe substitution has a strong impact on the mag-netic properties of the system. Qualitatively, two types of behaviors are observed depending on x, which are de-scribed below. For all compounds, the inverse of the susceptibility curve does not reach a linear regime up to 300 K, which indicates magnetic interactions at high temperature.
1. Magnetic properties and magnetic orderings for x ≤ 1.0
The TN 1 and TN 2 values used in the following are
derived from susceptibility measurements (Figure 6) and are also listed in Table IV for four selected compositions. The χ(T) curve of Fe3BO5 (x = 0, Figure 6a) shows two
magnetic transitions, at TN 1≈ 112 K and TN 2≈ 70 K,
with a strong zfc/fc effect for T < 70 K, which extends up to TN 1. All those features are in good agreement
with those published earlier [10], in which TN 1and TN 2
values of 114 K and 74 K, respectively, were reported. These two magnetic transitions correspond perfectly to
the independent orderings of the 3LL1 (below 112 K) and 3LL2 (below 70 K) ladders described in [8]. For x = 0.25 and x = 0.5 (Figure 6b and 6c), both transitions are still present, but the kink characterizing TN 1 is
hardly visible (Figure 6f), while the hysteresis below TN 2 persists. TN 1 and TN 2 values are seemingly not
affected by Mn substitution in this range of x. The main difference with x = 0 is the fact that the 5 K value of the fc susceptibility is negative, with the fc susceptibility curve crossing the zfc one below a crossing point temperature Tcross. This is a well-known feature
of magnetic compounds with two magnetic sub-lattices [30] and confirms the fact that small levels of Mn substitution preserve the distinct orderings of 3LL1 and 3LL2 units, a rare observation in heterometallic ludwigites, to the best of our knowledge. For higher x (e.g. x = 0.75, Figure 6d), the peak shape of the fc χ(T) below TN 2 disappears, while the difference between zfc
and fc curves persists. A small kink at TN 1 is still
observed. TN 1 and TN 2 are reduced with respect to 0
≤ x ≤ 0.5 : for x = 0.75, TN 1 ≈ 100 K and TN 2 ≈
55 K. Increasing the Mn content further, a drop of the susceptibility maximum, by a factor 10 compared to x = 0, is observed (x = 1, Figure 6e). Two magnetic
FIG. 4. (color online) : (a) Upper panel: Mn K-edge absorp-tion spectrum of Fe1.5Mn1.5BO5, the measured spectrum is
compared to the reference spectra of MnO (black solid lines) and Mn2O3 (black dashed lines). Lower panel: Mn K-edge
absorption spectra of Fe3−xMnxBO5 samples (x = 0.25 to
1.5). The data are shifted vertically for clarity. The two black dashed lines are guide to the eyes to highlight the constant energy position of XANES features for all samples. (b) Fe K-edge absorption spectra of Fe3−xMnxBO5 samples (x = 0
to 1.5). The measured spectra are compared to the reference spectra of FeO (black solid lines) and Fe2O3 (black dashed
lines).
FIG. 5. (color online) : Combined Rietveld refinements of the (a) SXRPD (λ = 0.6694 ˚A) and (b) NPD (λ = 1.4618 ˚A) data of Fe2MnBO5 at 300 K. Inset of (b) : Low Q enlargement of
the NPD pattern, to show the diffuse scattering due to Fe/Mn distribution (λ = 2.426 ˚A) at 300 K.
FIG. 6. (color online) : Temperature evolution of the zfc and fc magnetic susceptibility χ in 100 Oe in the Fe3−xMnxBO5
system, for x = 0 (a), 0.25 (b), 0.50 (c), 0.75 (d) and x = 1 (e). (f) shows an enlargement of the χ(T) for x = 0.50 around TN 1. Arrows show for each composition TN 1 (in blue) and
TN 2(in red).
transitions are still identified, but at lower temperatures with respect to smaller x values (see Table IV). The difference between zfc and fc curves is also present, like for smaller x values, but starts between TN 1and TN 2.
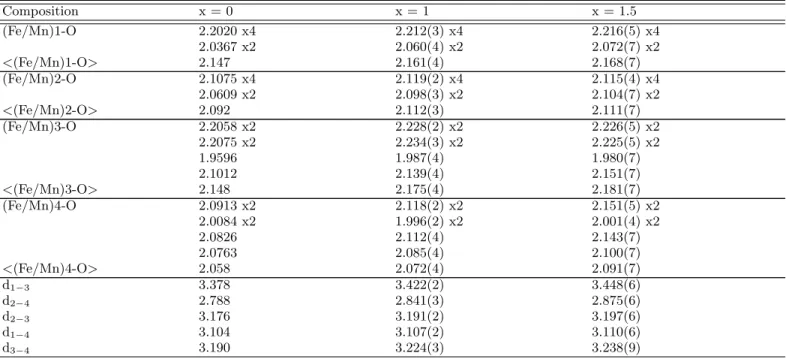
TABLE II: Selected atomic distances (in ˚A) at 300 K (with multiplicity) in Fe2MnBO5 and Fe1.5Mn1.5BO5 at 300 K. For
simplicity, the distance between (Fe/Mn) sites is written using only the site number, e.g. the distance between (Fe/Mn)1 and (Fe/Mn)3 is noted d1−3. Atomic distances in Fe3BO5(x = 0) at 320 K (calculated from [8]) are given for comparison purposes.
Composition x = 0 x = 1 x = 1.5 (Fe/Mn)1-O 2.2020 x4 2.212(3) x4 2.216(5) x4 2.0367 x2 2.060(4) x2 2.072(7) x2 <(Fe/Mn)1-O> 2.147 2.161(4) 2.168(7) (Fe/Mn)2-O 2.1075 x4 2.119(2) x4 2.115(4) x4 2.0609 x2 2.098(3) x2 2.104(7) x2 <(Fe/Mn)2-O> 2.092 2.112(3) 2.111(7) (Fe/Mn)3-O 2.2058 x2 2.228(2) x2 2.226(5) x2 2.2075 x2 2.234(3) x2 2.225(5) x2 1.9596 1.987(4) 1.980(7) 2.1012 2.139(4) 2.151(7) <(Fe/Mn)3-O> 2.148 2.175(4) 2.181(7) (Fe/Mn)4-O 2.0913 x2 2.118(2) x2 2.151(5) x2 2.0084 x2 1.996(2) x2 2.001(4) x2 2.0826 2.112(4) 2.143(7) 2.0763 2.085(4) 2.100(7) <(Fe/Mn)4-O> 2.058 2.072(4) 2.091(7) d1−3 3.378 3.422(2) 3.448(6) d2−4 2.788 2.841(3) 2.875(6) d2−3 3.176 3.191(2) 3.197(6) d1−4 3.104 3.107(2) 3.110(6) d3−4 3.190 3.224(3) 3.238(9)
To go further in the understanding of these complex magnetic behaviors, neutron diffraction vs. temperature was performed for x = 0.75 and x = 1. Similar behaviors are observed for both compounds. Below TN 1, additional
peaks appear on the NPD patterns (x = 1, Figure 7), which can be indexed by the commensurate propagation vector k1= (0 0 12), as in the model proposed for Fe3BO5
[8]. Rietveld refinements supported by symmetry analy-sis (Table V) indicate that only the 3LL1 sub-lattice or-ders below TN 1. As there is no evidence of a structural
transition in Mn substituted samples, a simple Pbam cell was considered for the symmetry analysis. Magnetic or-dering of symmetry nonequivalent sites 2 and 4 (which form 3LL1) follows the irreducible representation (irrep) Γ6, with two basis vectors ψ1 = (1 0 0) and ψ2 = (0 1 0). Interestingly, for the Γ6 irrep, magnetic ordering is also allowed on sites 1 and 3 (3LL2), but only with moments parallel to c, which is not compatible with the observed magnetic intensities. The best refinement results there-fore correspond to a magnetic ordering, below TN 1, on
the 3LL1 sub-lattice only, and can be described as FM ladder rungs, arranged AFM along c, with spins paral-lel to b (Figure 7b). The magnetic space group is then Pbnma (BNS #62.451) in a cell doubled along c. This
group is not compatible with ferroelectricity or any mag-netoelectric effect [26]. The moments on site 2 and site 4 are not equivalent symmetry-wise and can be refined independently : for x = 1 at 2 K, values of 3 µB and
2.2 µB are obtained on site 2 and 4, respectively (Table
IV and Figure 7e). This is only slightly lower than the values reported for Fe3BO5 [8] (3.9 µB and 2.7 µB at 10
K, respectively, which were already distinctively smaller
than the 5 µB and 4 µB expected for spin-only values of
Fe3+ and Fe2+), but the tendency to have a larger mo-ment on site 2 (which has the least distorted octahedral environment) than on site 4 is confirmed for both x = 0.75 and x = 1 (Table IV). These moments values, close to those observed for x = 0, are also in good agreement with the fact that 3LL1 is little impacted by Mn substi-tution up to x = 1 (Figure 3).
Below TN 2, the ordering of the second sub-lattice leads
to additional magnetic intensity (x = 1, Figures 7a and 7d) on existing Bragg peaks (k2 = (0 0 0)), likewise to
Fe3BO5 [8]. For x = 0.75, the corresponding magnetic
Bragg peaks are only slightly broader than the crystal ones (whose width is limited by instrumental resolution), whereas for x = 1, broad magnetic scattering is observed, as highlighted on the inset of Figure 7a for the (0 2 0) Bragg peak. Rietveld refinements, performed using symmetry analysis, indicate that the magnetic ordering of this 3LL2 sub-lattice follows irrep Γ5, that is, AFM configuration within the rungs, with a FM arrangement along c (Figure 7c). Moments are aligned along a, there-fore inferring a magnetic anisotropy on 3LL2, like on 3LL1, of the easy-axis type, but orthogonal to the lat-ter. For x = 0.75 at 2 K, the ordered moment values on sites 1 and 3 are 2.9 µBand 2.8 µB, respectively. For x =
1, the ordering is only short-range, with a magnetic cor-relation length estimated about 120 ˚A, and the maximal ordered moment remains low, around 1.6 µB(Figure 7e).
This value was constrained to be equal for both sites 1 and 3, since the refinement did not allow for a meaningful distinction between the two. This short-range magnetic ordering is in good agreement with the preferred
substitu-TABLE III. Selected atomic distances (in ˚A) at 180 K and 4 K in Fe2MnBO5 (from Rietveld refinement results in the
Pbam space group using high resolution NPD data).
180 K 4 K Cell parameters (˚A) a 9.5147(3) 9.5064(3) b 12.4146(4) 12.4065(4) c 3.0870(1) 3.0845(1) Cell volume V (˚A3) 364.6(2) 363.8(2) (Fe/Mn)1-O 2.218(8) x4 2.202(9) x4 2.03(1) x2 2.02(1) x2 <(Fe/Mn)1-O> 2.16(1) 2.14(1) (Fe/Mn)2-O 2.110(6) x4 2.095(7) x4 2.08(1) x2 2.09(1) x2 <(Fe/Mn)2-O> 2.10(1) 2.09(1) (Fe/Mn)3-O 2.23(1) x2 2.24(2) x2 2.21(2) x2 2.18(2) x2 2.06(2) 2.03(2) 2.10(2) 2.12(2) <(Fe/Mn)3-O> 2.17(2) 2.16(2) (Fe/Mn)4-O 1.993(7) x2 2.001(7) x2 2.113(8) x2 2.118(8) x2 2.06(1) 2.07(1) 2.12(1) 2.12(1) <(Fe/Mn)4-O> 2.06(1) 2.07(1) d1−3 3.44(2) 3.47(2) d2−4 2.824(7) 2.814(7) d2−3 3.17(1) 3.14(1) d1−4 3.114(6) 3.122(6) d3−4 3.17(2) 3.09(2)
tion of Mn2+on 3LL2, which leads to a Fe:Mn ratio close
to 1 on 3LL2 for x = 1. At 2 K, the magnetic space group of the cell is therefore lowered to Pb’am’ (BNS #55.358), whose point group is not compatible with ferroelectric or magnetoelectric effects, although the Mn for Fe substi-tution could actually lower the symmetry locally. Two representations are thus mixed below TN 2 (Γ6 ⊕ Γ5),
which means that the magnetic phase transition at TN 2
is first-order, while the transition at TN 1is second-order.
This should also apply to Fe3BO5, and is in good
agree-ment with specific heat data [31].
For both x = 0.75 and x = 1, signatures of magnetic dis-order are also seen on the ac susceptibility curves (Figure 8), which becomes frequency dependent below 30 K for both compositions. As a final remark, in contrast to what was reported for Fe3BO5 [8], the ordering of 3LL2 does
not seem to influence the 3LL1 ordered moment value.
2. Magnetic properties and magnetic ordering for 1.0 ≤ x < 2.0
For larger x values (1 < x < 2) the χ(T) curves still display two transitions, as shown in Figure 9a for x = 1.5, corresponding to the splitting of the zfc and fc curves at TN ≈ 100 K, and to the downturn of the zfc
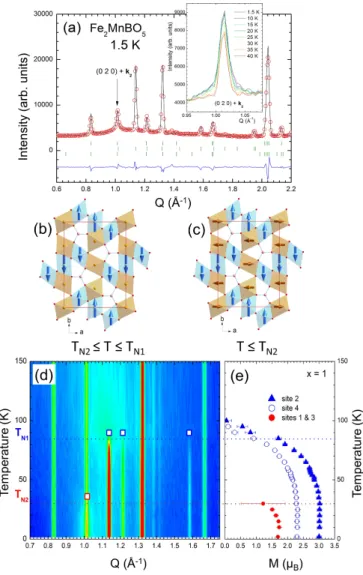
FIG. 7. (color online) : (a) Rietveld refinement of the NPD data for x = 1 at 1.5 K. Inset : enlargement of the (0 2 0) peak to illustrate additional magnetic intensity below 35 K. Right panel : Magnetic ordering on 3LL1 (blue) and 3LL2 (orange) depending on the temperature range considered (TN 2 ≤ T
≤ TN 1 (b) and T ≤ TN 2 (c)). (d) Temperature evolution
of the NPD patterns of Fe2MnBO5 (left) and corresponding
evolution of the refined magnetic moment on each (Fe/Mn) site (e). Blue (red) empty squares indicate the main magnetic Bragg peaks observed below TN 1(TN 2) in (d).
curves at Tdown ≈ 30 K. Neutron diffraction performed
on Fe1.5Mn1.5BO5 shows a unique transition at TN =
100 K, corresponding to the appearance of magnetic in-tensity, with the propagation vector k = (0 0 0). Rietveld refinements (Figure 10) based on symmetry analysis indi-cate that the magnetic order follows one single represen-tation, Γ1, for the four different sites. This imposes mo-ments along c, and the magnetic space group is therefore Pbam (BNS #55.353, not compatible with ferroelectric or direct magnetoelectric effects). For sites 1 and 2, this couples the components of (x, y, z) and (-x+12, y+12, -z) AFM along c. For sites 3 and 4, the coupling within (x,
FIG. 8. (color online) : ac susceptibility measurements vs. temperature as a function of frequency f (10 Hz to 104 Hz)
for x = 0.75 and x = 1 in the Fe3−xMnxBO5 system (in 10
Oe).
y, z) and (-x, -y, z), as well as (-x+1 2, y+
1
2, -z) and (x+ 1 2,
-y+12, -z) pairs is FM, and the pairs are coupled together antiferromagnetically (Figure 10a). The comparison of Figure 7c and 10a (also summarized in Figure 11) shows how most couplings have been reversed, especially within the triads of former 3LL subunits.
There is no symmetry constraint between the moment values on each sites and the refinement is improved sig-nificantly by refining them independently. While the mo-ments on sites 2 and 4 are almost identical, 2.7 µB,
there is a significantly lower magnetic moment on site 1 (1.7 µB), with respect to site 3 (2.5 µB), despite
simi-lar Fe/Mn ratios (Table IV). In addition, the magnetic peaks are resolution limited, in contrast to x = 0.75 and x = 1, but a frequency dependence of the ac suscepti-bility curves (inset of Figure 9a) is still observed around 30 K, like for x = 0.75 and x = 1. It does not seem to be linked with any feature on the NPD patterns, except for a slight decrease of the observed ordered moment on all sites (Figure 9b), which coincides with the decrease in the zfc magnetization curve (Figure 9a) below 30 K.
3. Fe3−xMnxBO5 magnetic phase diagram
From the susceptibility curves, such as those shown in Figures 6 and 9, a (x, T) magnetic phase diagram was built, and is displayed in Figure 11. TN 1(blue squares)
and TN 2(red squares), corresponding to the ordering of
3LL1 and 3LL2, respectively, are plotted up to x = 1. TN 2corresponds to the maximum of the peak of the zfc
susceptibility curve up to x = 1, which is also in agree-ment with the TN 2determined from NPD data. For x >
1, TN is defined as the temperature where zfc and fc χ
curves split markedly. In the phase diagram are also re-ported Tcross (crossing point temperature of the zfc and
fc curves, white up triangles) and Tdown, which
corre-sponds for x > 1 to the temperature of the maximum on the zfc susceptibility curve (white down triangles). The temperature at which ac frequency effects are observed
FIG. 9. (color online) : (a) Magnetic susceptibility (zfc and fc) measurements for x = 1.5 in 100 Oe ; the inset shows corresponding ac susceptibility measurements in the range 10 Hz-104Hz in 10 Oe. (b) Temperature evolution of the ordered
magnetic moment on each site for Fe1.5Mn1.5BO5 (from NPD
data). TN and Tdownare shown by black arrows.
FIG. 10. (color online) : (a) Illustration of the magnetic ordering for x = 1.5 and (b) corresponding NPD data Rietveld refinement at 1.5 K. Stars indicate the main magnetic Bragg peaks. In (a) the moments are along c and symbolised by + or – signs depending on their direction.
TABLE IV. Evolution of TN with x (from susceptibility measurements and [8] for x = 0), and of the ordered moment on each
transition metal site (from Rietveld refinement of NPD data) in the Fe3−xMnxBO5 series. The ordered moments for x = 0
were measured at 10 K and are taken from reference [8], while the values for the other compositions were obtained at 2 K.
x = 0 x = 0.75 x = 1.0 x = 1.5 TN 1= 112 K TN 1= 104 K TN 1= 90 K TN = 100 K TN 2= 70 K TN 2= 51 K TN 2= 30 K 3LL1 Site 2 My = 3.9(1) µB My = 3.6(1) µB My= 3.0(1) µB Mz = 2.7(1) µB Site 4 My = 2.74(7) µB My = 2.9(1) µB My= 2.2(1) µB Mz = 2.7(1) µB 3LL2 Site 1 Mx = 3.3(2) µB Mx = 2.9(2) µB Mx= 1.6(4) µB Mz = 1.7(1) µB Site 3 Mx = 4.0(1) µB Mx = 2.8(2) µB Mx= 1.6(4) µB Mz = 2.5(1) µB
on susceptibility curves is also shown in Figure 11 (white stars).
The main feature of the phase diagram is the existence of two main types of magnetic orders, with a boundary between x = 1 and x = 1.5, characterized by the exis-tence of either two independent magnetic sub-lattices (x ≤ 1) or by a single magnetic network (1 < x ≤ 1.75). Up to x = 0.5, there is little change with x of the magnetic ordering temperatures, which remain roughly constant ≈ 110 K and 70 K, before a sharp decrease is observed for x ≥ 0.75. A decrease of the ordered magnetic moment (Ta-ble IV) and the appearance of frequency effects on the ac susceptibility below 30 K are also observed for x ≥ 0.75, likely owing to magnetic disorder. Based on this phase diagram, x ≈ 1.25 should correspond to the absence of ordering on 3LL2, while TN 1 should be reduced to ≈ 70
K. Further increasing x (x ≥ 1.5), one reaches the single magnetic lattice regime, with TN increasing from 100 K,
for x = 1.5, up to 115 K for x = 1.75. Low temperature ac susceptibility frequency effects are still observed up x = 1.5, but could be expected to decrease with increasing Mn content, as TN increases and magnetic disorder
van-ishes.
This experimental study proves the originality of the magnetic properties of the Fe3−xMnxBO5 ludwigite
bo-rates, coming from an unusual crystal structure, with the addition of preferred Fe/Mn distribution. The differ-ent properties which can be impacted when varying x in Fe3−xMnxBO5are now discussed in more details below.
IV. DISCUSSION
a. Charge ordering
From [11], it is known that there is no CO in Fe2MnBO5,
in contrast with Fe3BO5, a result that can be linked with
previous reports on other CO systems [32], in which even minute amounts of substitution destroy any ordering of the charges. In Fe3BO5, the schematic picture of charge
ordering concerns 3LL1 only : the extra electron on each triad of 3LL1 (which contains 2Fe3+ for 1Fe2+)
is delocalised at high temperature, and then localizes onto a Fe-Fe pair, to form a dimer. The ordering of
FIG. 11. (color online) : (x, T) phase diagram of the Fe3−xMnxBO5 system. TN 1 and TN 2 (x ≤1) or TN (x >
1) are shown as blue squares, red squares, and green circles, respectively. Tcrossand Tdownare also shown as white
trian-gles pointing up or down, respectively. White stars indicate the onset of ac frequency effects in the susceptibility curves. Arrows indicate x values for which neutron diffraction exper-iments have been performed. The composition range can be separated into decoupled and coupled magnetic sub-lattices, as highlighted by the blue and green areas, respectively. The grey area shows the x range in which the nature of the mag-netic ordering changes. The dark green area remains unex-plored. Corresponding magnetic orders are illustrated (see also text).
the dimers along the ladder is zig-zag like, probably as a mean to minimize structural distortions [8]. In Fe3−xMnxBO5, because of the preferred substitution
of Mn2+ on 3LL2, CO could have been expected to
withstand sizeable levels of substitutions ; 10% of Mn on 3LL1, as evaluated in Fe2MnBO5, is high enough to
destroy CO features at least down to 90 K, however. Interestingly, in spite of the absence of CO on 3LL1, the 3LL1 triad remains ferromagnetic up to x = 1, showing
TABLE V. Basis functions for axial vectors associated with irreducible representation Γ6 for Wyckoff site 2d (site 2) and 4h (site 4) of the Pbam space group, with the propagation vector k1 = (0 0 0.5).
Γ6 (x y z) (-x+12 y+12 -z+1) (x y z) (-x+1 -y+1 z) (-x+32 y+12 -z+1) (x-12 -y+12 -z+1)
ψ1 1 0 0 1 0 0 1 0 0 1 0 0 1 0 0 1 0 0
ψ2 0 1 0 0 ¯1 0 0 1 0 0 1 0 0 ¯1 0 0 ¯1 0
that CO dimers do not control the magnetic structure, as it had been suggested in [33], and that their existence has probably less impact on the magnetic ordering than the presence of Fe3+ on 3LL1 only. This promises to be a very interesting theoretical issue to investigate. In a similar fashion, based on the importance of octahedral distortions in vonsenite [23], [34], [35], the origin of the preferred substitution, as well as the impact of Mn2+
on the magnetism of the 3LL2 units, would also be key points to study theoretically.
b. Understanding magnetic exchanges
A preliminary step is to check whether the changes induced by Mn2+ can be explained by the
Goodenough-Kanamori rules [36] going from x = 0 to x = 1.5. In Fe3BO5, the FM triad (of edge-sharing octahedra) in
3LL1 is simply explained by a d5-d6 ferromagnetic
direct-exchange (with short Fe2-Fe4 distances ≈ 2.78 ˚A), J1 (Figure 1c). Along c, FeO6 octahedra are also linked
by edges but the Fe-Fe distance is larger (≈ 3.08 ˚A), thus close to the limit for a direct-exchange mediated JC. With a Fe-O-Fe angle of about 94◦, a weak d5-d6
super-exchange JC would actually support the observed
AF configuration. The coupling between 3LL1 units is mediated by more complex paths, involving super-super exchange, possibly through BO3 units, which cannot
be decided unequivocally at that stage, considering the crystal structure. Within 3LL2 units, as d6-d6
interactions only are present, the strongest interactions should correspond to AFM super-exchange J2within the
triad (octahedra sharing corner), and to ferromagnetic direct-exchange along c, corresponding to J’C (Figure
1c). The Fe-Fe distance along c is the same as 3LL1 (≈ 3.08 ˚A), but the Fe-O-Fe angle is actually less distorted, > 90◦ in 3LL1 for < 90◦ in 3LL2, which explains why d5-d6 interactions are of different signs depending on the ladder, and hence the distinction between JC and
J’C. The coupling between 3LL1 and 3LL2 units has a
triangular topology. The corresponding exchange path Jf (Figure 1c) is through larger Fe-Fe distances (≈ 3.17
˚
A) between edge-sharing octahedra, and presumably leads to a weaker super-exchange interaction than within a sub-lattice unit. In the Fe3−xMnxBO5 system, it is
necessary to consider Mn2+, isoelectronic to Fe3+ (d5)
in addition to Fe3+ and Fe2+. Adding Mn2+ to 3LL2
should lead to similar characteristics to those of 3LL1 along c in Fe3BO5, that is, antiferromagnetic J’C. The
exchange along c in 3LL1 and 3LL2 is ferromagnetic,
however, as exemplified in x = 1.5. The fact that, in x = 1.5, FM JC and FM J’C is observed, rather supports
the idea that, in the decoupled sub-lattice regime, antiferromagnetic JC in 3LL1 is weak, and likely lies at
the threshold between AFM super-exchange and FM (d5-d6) direct-exchange.
c. Magnetic sub-lattices coupling
The coupling of both ladders for x = 1.5 is concomitant with the observation of ferromagnetic JC and J’C
exchange along c for both 3LLs. Arguably, it can be proposed that, for x ≤ 1, the antiferromagnetic ordering along c, of the 3LL1 spins at TN 1, prevents the
order-ing of 3LL2, as the triangular pathways couplorder-ing the ladders through Jf frustrate the J’C magnetic exchange
(whether FM or AFM) [5]. Assuming a strong easy-axis magnetic anisotropy of Fe2+ [37] [38], the 3LL2 spins
cannot order into a non-collinear structure (such as the 120◦ magnetic ground state observed in frustrated com-pounds with triangular ladder topology [39], [40]), and remain idle down to TN 2. 3LL2 spins eventually order
at TN 2 << TN 1, perpendicularly to the 3LL1 spins :
the release of the frustration is here performed through a magnetic decoupling of both lattices. Although unusual, idle spin behavior linked with topological frustration has been reported in other mixed valence systems, like Fe2+Fe3+
2 F8(H2O)2 [41], [42]. This coexistence of
three-dimensional (3D) order and frustration remains the main feature of the magnetic ordering of the system Fe3−xMnxBO5 up to x = 1. Other examples of ladders’
coupling in the ludwigite system are scarce or difficult to assess, as there are very few published neutron diffraction studies, which mostly concentrate on Fe3BO5
([8],[5]), and the interpretation of magnetization data is not straightforward, as exemplified by this study. From a literature survey, decoupled ladders could be expected in Co2FeBO5, or Ni2FeBO5 [43], [44], whereas
coupled ladders would be likely in Co3BO5 [45] and
Co2.5Sn0.5BO5[46], but this would have to be confirmed
by appropriate experiments.
d. Magnetic disorder
The ludwigite system also offers a very interesting ap-proach to study magnetic disorder : preferred substitu-tion can be seen as an addisubstitu-tional degree of freedom to adjust the composition of each ladder, concentrating dis-order effects on one sub-lattice at a time. Up to x = 1.5, which represents 50% Mn in the system, 3LL1 remains
ordered, with a TN varying between 112 K (x = 0) and
85 K (x = 1), increasing again to 100 K for x = 1.5. For x ≤ 1, the ordering of 3LL1 occurs through super-exchange pathways that are not sensitive to the magnetic state of 3LL2 (i.e., disordered or ordered), and it could be possible by adjusting x to achieve complete disorder on 3LL2, while preserving order on 3LL1, with potentially interesting applications, such as magnetocaloric effects. A more detailed investigation of the composition range 1 < x < 1.5, which lies at the threshold between two dis-tinct magnetic ground states, will also be an interesting perspective, with unusual effects being expected, such as non collinear magnetic ordering resulting from compet-ing anisotropies or exchange disorder. In this context, substitution of 4+ species should also be of interest, since 4+ species might preferentially substitute on 3LL1 rather than on 3LL2, and arguably prevent magnetic ordering altogether, a scenario that can be proposed to explain the spin-glass state of Co2.5Ti0.5BO5 [47]. An inelastic
neutron scattering study of the Fe3−xMnxBO5system is
now required to provide a better picture of the dominant magnetic exchange paths in the ludwigite structure, in particular to confirm the different hypothesis about the impact of Mn substitution on magnetic exchanges, mag-netic anisotropy and on the sub-lattice coupling.
V. CONCLUSION
This detailed study of the crystal and magnetic structures, and magnetic properties of the heterometallic ludwigite system Fe3−xMnxBO5, has established a rich
phase diagram, originating from its complex network of two crystallographically distinct three-leg ladders. The composition (x) controls both the (Fe/Mn)O6octahedral
distortions and orbital filling. For small x values (x ≤ 1), the ladders are decoupled and order independently. A reversal of the magnetic exchange signs inside the different triads is observed above a threshold of x ≈ 1.25. In parallel, magnetic exchange along all ladders’ legs becomes ferromagnetic, which removes the frustration at the origin of the decoupling of the ladders and leads to a single magnetic transition. Magnetic anisotropy also changes from easy-axis along a or b for x < 1.25, to easy-axis along c for x ≥ 1.5. Magnetic relaxation phenomena below 30 K and reduced ordered magnetic moments on the transition metal sites both attest to magnetic disorder, for 0.75 ≤ x ≤ 1.5. The ability to substitute Mn preferentially on only one of the two ladders is an original way to control both magnetic disorder and ladders’ magnetic coupling in this system.
The authors thank S. Dufourd and F. Veillon (CRISMAT) for technical support. This work was supported by the French-Romanian project ANR-UEFISCDI, contracts No. RO-FR/01.01.2013, code
PN-II-ID-JRP-2011-2-0056/ANR-12-IS08-0003, COFeIn and the Agence Nationale de la Recherche (ANR-16-CE08-0007-01 contract BORA-BORA). Neutron measurement were performed also at the CANAM infrastructure of the NPI CAS Rez and reactor LVR15 supported through MSMT project No. LM2015056 and LM2015074.
[1] Y. Takeuchi, T. Watanabe, and T. Ito, Acta Crystallo-graphica 3, 98 (1950).
[2] Y. Takeuchi, Mineralogical Jouranl 2, 19 (1956). [3] E. F. Bertaut, Acta Crystallographica 3, 473 (1950). [4] H. Steinfink and J. S. Swinnea, American Mineralogist
68, 827 (1983).
[5] J. P. Attfield, J. F. Clarke, and D. A. Perkins, Physica B 180, 581 (1992).
[6] M. Mir, R. B. Guimaraes, J. C. Fernandes, M. A. Conti-nentino, A. C. Doriguetto, Y. P. Mascarenhas, J. Ellena, E. E. Castellano, R. S. Freitas, and L. Ghivelder, Physical Review Letters 87, 147201 (2001).
[7] M. Mir, J. Janczak, and Y. P. Mascarenhas, Journal of Applied Crystallography 39, 42 (2006).
[8] P. Bordet and E. Suard, Physical Review B 79, 144408 (2009).
[9] R. B. Guimaraes, M. Mir, J. C. Fernandes, M. A. Con-tinentino, H. A. Borges, G. Cernicchiaro, M. B. Fontes, D. R. S. Candela, and E. Baggio-Saitovitch, Physical Re-view B 60, 6617 (1999).
[10] A. P. Douvalis, A. Moukarika, T. Bakas, G. Kallias, and V. Papaefthymiou, Journal of Physics: Condensed Mat-ter 14, PII S0953 (2002).
[11] A. Maignan, F. Laine, A. Guesdon, S. Malo, F. Damay, and C. Martin, Journal of Solid State Chemistry 246, 209 (2017).
[12] J. Sottmann, L. Nataf, L. Chaix, V. Pralong, and C. Mar-tin, Journal of Physical Chemistry C 122, 17042 (2018). [13] P. J. Dunn, D. R. Peacor, W. B. Simmons, and D. New-bury, Geologiska Foreningen i Stockholm Forhandlingar 105, 335 (1983).
[14] S. De Waal, E. Viljoen, and L. Calk, South African Jour-nal of Geology 77, 375 (1974).
[15] A. Konev, V. Lebedeva, A. Kashayev, and Z. Ushchapovskaya, International Geology Review 13, 1183 (1971).
[16] E. Foord and R. Erd, Canadian Mineralogist 26, 911 (1988).
[17] A. Utzolino and K. Bluhm, Zeitschrift Fur Natur-forschung Section B-a Journal of Chemical Sciences 51, 1433 (1996).
[18] S. Sofronova, E. Moshkina, I. Nazarenko, Y. Sery-otkin, S. A. Nepijko, V. Ksenofontov, K. Medjanik, A. Veligzhanin, and L. Bezmaternykh, Journal of Mag-netism and Magnetic Materials 420, 309 (2016). [19] E. Moshkina, C. Ritter, E. Eremin, S. Sofronova, A.
Kar-tashev, A. Dubrovskiy, and L. Bezmaternykh, Journal of Physics-condensed Matter 29, 245801 (2017).
[20] E. M. Moshkina, M. S. Platunov, Y. V. Seryotkin, A. F. Bovina, E. V. Eremin, S. N. Sofronova, and L. N. Bez-maternykh, Journal of Magnetism and Magnetic Materi-als 464, 1 (2018).
[21] L. Bezmaternykh, E. Kolesnikova, E. Eremin, S. Sofronova, N. Volkov, and M. Molokeev, Journal of Magnetism and Magnetic Materials 364, 55 (2014), cited By 12.
[22] E. Moshkina, S. Sofronova, A. Veligzhanin, M. Molokeev, I. Nazarenko, E. Eremin, and L. Bezmaternykh, Journal of Magnetism and Magnetic Materials 402, 69 (2016). [23] M. Matos, J. Terra, D. E. Ellis, and A. S. Pimentel,
Journal of Magnetism and Magnetic Materials 374, 148 (2015).
[24] M. Newville, Journal of Physics: Conference Series 430, 012007 (2013).
[25] J. Rodriguez-Carvajal, Physica B 192, 55 (1993). [26] E. Kroumova, M. I. Aroyo, J. M. Perez-Mato, A. Kirov,
C. Capillas, S. Ivantchev, and H. Wondratschek, Phase Transitions 76, 155 (2003).
[27] M. I. Aroyo, A. Kirov, C. Capillas, J. M. Perez-Mato, and H. Wondratschek, Acta Crystallographica Section A 62, 115 (2006).
[28] R. D. Shannon, Acta Crystallographica Section A 32, 751 (1976).
[29] B. Warren, X ray diffraction, (Addison-Wesley, 1969) p. 229.
[30] J. S. Smart, American Journal of Physics 23, 356 (1955). [31] J. C. Fernandes, R. B. Guimaraes, M. A. Continentino, L. Ghivelder, and R. S. Freitas, Physical Review B 61, R850 (2000).
[32] A. P. Ramirez, Journal of Physics-condensed Matter 9, 8171 (1997).
[33] E. Vallejo and M. Avignon, Journal of Magnetism and Magnetic Materials 310, 1130 (2007).
[34] M. Matos, Journal of Solid State Chemistry 177, 4605 (2004).
[35] M. H. Whangbo, H. J. Koo, J. Dumas, and M. A. Con-tinentino, Inorganic Chemistry 41, 2193 (2002).
[36] J. B. Goodenough, Magnetism and the Chemical Bond (Interscience, New York, 1963).
[37] G. Ferey, M. Leblanc, R. Depape, and J. Pannetier, Solid State Communications 53, 559 (1985).
[38] J. Bourgeois, G. Andre, S. Petit, J. Robert, M. Poienar, J. Rouquette, E. Elkaim, M. Hervieu, A. Maignan, C. Martin, and F. Damay, Physical Review B 86, 024413 (2012).
[39] F. Damay, C. Martin, V. Hardy, A. Maignan, G. An-dre, K. Knight, S. R. Giblin, and L. C. Chapon, Physical Review B 81, 214405 (2010).
[40] J. Villain, Journal Of Physics And Chemistry Of Solids 11, 303 (1959).
[41] M. Leblanc, G. Ferey, Y. Calage, and R. Depape, Journal of Solid State Chemistry 53, 360 (1984).
[42] M. Leblanc, G. Ferey, P. Lacorre, and J. Pannetier, Jour-nal of Magnetism and Magnetic Materials 92, 359 (1991). [43] J. C. Fernandes, R. B. Guimaraes, M. A. Continentino, H. A. Borges, A. Sulpice, J. L. Tholence, J. L. Siqueira, L. I. Zawislak, J. B. M. da Cunha, and C. A. dos Santos, Physical Review B 58, 287 (1998).
[44] D. C. Freitas, M. A. Continentino, R. B. Guimaraes, J. C. Fernandes, E. P. Oliveira, R. E. Santelli, J. Ellena, G. G. Eslava, and L. Ghivelder, Physical Review B 79, 134437 (2009).
[45] D. C. Freitas, M. A. Continentino, R. B. Guimaraes, J. C. Fernandes, J. Ellena, and L. Ghivelder, Physical Review B 77, 184422 (2008).
[46] C. P. C. Medrano, D. C. Freitas, D. R. Sanchez, C. B. Pinheiro, G. G. Eslava, L. Ghivelder, and M. A. Conti-nentino, Physical Review B 91, 054402 (2015).
[47] D. C. Freitas, R. B. Guimaraes, D. R. Sanchez, J. C. Fernandes, M. A. Continentino, J. Ellena, A. Kitada, H. Kageyama, A. Matsuo, K. Kindo, G. G. Eslava, and L. Ghivelder, Physical Review B 81, 024432 (2010).


![TABLE IV. Evolution of T N with x (from susceptibility measurements and [8] for x = 0), and of the ordered moment on each transition metal site (from Rietveld refinement of NPD data) in the Fe 3−x Mn x BO 5 series](https://thumb-eu.123doks.com/thumbv2/123doknet/13138735.388474/11.918.80.843.156.279/table-evolution-susceptibility-measurements-ordered-transition-rietveld-refinement.webp)

