HAL Id: cea-01834595
https://hal-cea.archives-ouvertes.fr/cea-01834595
Submitted on 18 Nov 2019HAL is a multi-disciplinary open access
archive for the deposit and dissemination of sci-entific research documents, whether they are pub-lished or not. The documents may come from teaching and research institutions in France or abroad, or from public or private research centers.
L’archive ouverte pluridisciplinaire HAL, est destinée au dépôt et à la diffusion de documents scientifiques de niveau recherche, publiés ou non, émanant des établissements d’enseignement et de recherche français ou étrangers, des laboratoires publics ou privés.
Using LiF:Mg,Cu,P TLDs to estimate the absorbed dose
to water in liquid water around an
192Ir brachytherapy
source
P. Avilés Lucas, Isabelle Aubineau-Lanièce, Valérie Lourenço, Didier
Vermesse, Dominique Cutarella
To cite this version:
P. Avilés Lucas, Isabelle Aubineau-Lanièce, Valérie Lourenço, Didier Vermesse, Dominique Cutarella. Using LiF:Mg,Cu,P TLDs to estimate the absorbed dose to water in liquid water around an 192Ir brachytherapy source. Medical Physics, American Association of Physicists in Medicine, 2014, 41, pp.011711. �10.1118/1.4851636�. �cea-01834595�
Using LiF:Mg,Cu,P TLDs to estimate the absorbed dose to
water in liquid water around an
192Ir brachytherapy source
P. Avilés Lucas, I. Aubineau‐Lanièce, V. Lourenço, D. Vermesse, D. Cutarella CEA, LIST, Laboratoire National Henri Becquerel, 91191 Gif-sur-Yvette, France
Abstract
Purpose
The absorbed dose to water is the fundamental reference quantity for brachytherapy treatment planning systems and thermoluminescence dosimeters (TLDs) have been recognized as the most validated detectors for measurement of such a dosimetric descriptor. The detector response in a wide energy spectrum as that of an192Ir brachytherapy source as well as the specific measurement medium which surrounds the TLD need to be accounted for when estimating the absorbed dose. This paper develops a methodology based on highly sensitive LiF:Mg,Cu,P TLDs to directly estimate the absorbed dose to water in liquid water around a high dose rate 192Ir brachytherapy source.
Methods
Different experimental designs in liquid water and air were constructed to study the response of LiF:Mg,Cu,P TLDs when irradiated in several standard photon beams of the LNE‐LNHB (French national metrology laboratory for ionizing radiation). Measurement strategies and Monte Carlo techniques were developed to calibrate the LiF:Mg,Cu,P detectors in the energy interval characteristic of that found when TLDs are immersed in water around an192 Ir source. Finally, an experimental system
was designed to irradiate TLDs at different angles between 1 and 11 cm away from an 192 Ir source in
liquid water. Monte Carlo simulations were performed to correct measured results to provide estimates of the absorbed dose to water in water around the 192 Ir source.
Results
The dose response dependence of LiF:Mg,Cu,P TLDs with the linear energy transfer of secondary electrons followed the same variations as those of published results. The calibration strategy which used TLDs in air exposed to a standard N‐250 ISO x‐ray beam and TLDs in water irradiated with a standard137Cs beam provided an estimated mean uncertainty of 2.8% (k = 1) in the TLD calibration
coefficient for irradiations by the 192 Ir source in water. The 3D TLD measurements performed in liquid
water were obtained with a maximum uncertainty of 11% (k = 1) found at 1 cm from the source. Radial dose values in water were compared against published results of the American Association of Physicists in Medicine and the European Society for Radiotherapy and Oncology and no significant differences (maximum value of 3.1%) were found within uncertainties except for one position at 9 cm (5.8%). At this location the background contribution relative to the TLD signal is relatively small and an unexpected experimental fluctuation in the background estimate may have caused such a large discrepancy.
Conclusions:
This paper shows that reliable measurements with TLDs in complex energy spectra require a study of the detector dose response with the radiation quality and specific calibration methodologies which model accurately the experimental conditions where the detectors will be used. The authors have developed and studied a method with highly sensitive TLDs and contributed to its validation by comparison with results from the literature. This methodology can be used to provide direct estimates of the absorbed dose rate in water for irradiations with HDR192Ir brachytherapy sources.
I. INTRODUCTION
The absorbed dose to water is the fundamental reference quantity for brachytherapy treatment planning systems, as it is closer to the absorbed dose in the biological soft tissue than other quantities such as air kerma. For high energy and high dose rate brachytherapy sources, an experimental estimate of the absorbed dose to water is one of the recommended routine methods to verify the single source dose distribution.1 Thermoluminescence detectors have found applications in brachytherapy for estimations
of the absorbed dose and have been recognized as the most validated1,2 detectors for measurement of the
absorbed dose to water by the Interstitial Collaborative Working Group3 due to their small size, high
sensitivity to measure relatively low doses with high accuracy, and dose linearity. However, the energy spectrum of 192Ir brachytherapy sources is complex and detector calibration has to account for possible
variations in detector energy response. Das et al.4 used LiF:Mg,Ti thermoluminescent dosimeters
(TLDs) to estimate the dose response in the energy range of interest for brachytherapy and concluded that it was independent of the beam quality. Davis et al.5 and Nunn et al.,6 however, highlighted with
experiments and calculations that neither the measured air kerma nor the TLD dose response of LiF:Mg,Ti or LiF:Mg,Cu,P dosimeters were constant for a wide range of photon spectra. These outcomes have been investigated in brachytherapy for lithium formate dosimeters7,8 and recently again
for LiF:Mg,Ti TLDs.9,10 Antonovic et al.7 started from the assumption that the dose response for lithium
formate dosimeters is independent of beam quality. A deeper investigation of this result,8 however,
demonstrated that lithium formate dosimeters show a significant under‐response for photon energies between 20 and 150 keV which needs to be accounted for by applying experimental and calculated corrections for measurements performed with brachytherapy sources. Recently, Carlsson et al.9,10 investigated this issue with standard LiF:Mg,Ti TLDs. They studied the measured air kerma
response, the dose response, and the application of microdosimetry models to explain the thermoluminescence energy dependence and the significant over‐response of LiF:Mg,Ti TLDs when used for brachytherapy dosimetry. As suggested by Olko et al.,11 this signal over‐response as a function
of energy, in the linear dose region, is affected by the existence of supralinearity in the nonlinear dose region and depends on the linear energy transfer (LET) of secondary electrons and the density of ionization clusters created in the TLD material during irradiations.11 They highlight that to understand
the macroscopic over‐ or under‐response of any type of TLDs with energy, one needs to account for a combination of factors such as characteristics specific to the solid state structure of the crystal (as for example, the dopant concentration) as well as aspects concerning radiation transfer and absorption processes and light emission (such as the annealing and read‐out schemes). As revealed by Carlsson et al.9,10 in brachytherapy applications, these potential factors of variation emphasize the need to account
for the dependence of the thermoluminescence signal on the energy in the TLD, particularly when these detectors are used to verify dose distributions involved in irradiations with a broad energy spectrum such as that of an 192 Ir source.
The LNE‐LNHB French national metrology laboratory for ionizing radiation has used LiF:Mg,Cu,P cubic TLDs of 1 mm side length in this work to estimate the absorbed dose rate around an 192Ir
brachytherapy source. LiF:Mg,Cu,P TLDs are about 25 times more sensitive12 to radiation than standard
LiF:Mg,Ti TLDs and they saturate without supralinearity at about 100 Gy.11 The under‐response of this
type of detector is well known in the literature13,14 and its behavior has been successfully explained from
microdosimetric radiobiological models such as Katz's one‐hit model of track structure.15 In this theory,
for a few hundred keV, secondary electrons have a relatively high ionizing potential (high LET) and there is a “local” saturation of trapping centers in the crystal leading to a macroscopic efficiency which is lower than that expected from a general‐purpose Monte Carlo calculation of the absorbed dose in a LiF crystal. The behavior of the detector response in different reference photon beams and geometry configurations specifically designed at the LNE‐LNHB was investigated with measurements. Monte Carlo calculations were also performed to estimate the dosimetric quantities needed to obtain the absorbed dose to water around an HDR 192 Ir source. The objective of these measurements and
calculations was also part of the Joint Research Project “Increasing cancer treatment efficacy using 3D brachytherapy”16 (work‐package 5) in which the LNE‐LNHB was involved. The ultimate objective of
this Joint Research Project was to investigate methods to decrease the uncertainty of the patient absorbed dose from the original 10% (k = 1) (Refs. 2 and 17) down to 5% (k = 1). In connection with this goal,
calibration methods were developed by the LNE‐LNHB to estimate and verify the 3D absorbed dose to water around an 192Ir brachytherapy source.
II. MATERIALS AND METHODS
II.A. Formalism
II.A.1. Calibration of TLDs
Thermoluminescent detectors were calibrated in different filtered photon beams of energies representative of those emitted by an 192 Ir source. To characterize each energy spectrum or beam quality
used, the mean energy of the photons arriving on the TLD, , weighted by their energy fluence was chosen. This energy descriptor can then be written as
= ∅∅ (1)
where ϕ(E) dE is the fluence of photons in the TLD in the energy interval between E and E + dE. To calibrate TLDs for each photon beam quality (referred hereafter with the descriptor ), the TLD absorbed dose calibration coefficient, , was determined for a given irradiation setup as
= ̅ (2)
where the mean corrected TLD experimental signal, ̅!" , is averaged for a given geometric position, r, of the sample of irradiated TLDs. ̅!" is related to the air kerma measured at the same geometric position, #$%& , with a calibrated ionization chamber. The quotient of both quantities, ̅!" / #$%& , is known in the literature as the TLD measured air kerma response. The term !" ) is the Monte Carlo calculated mean absorbed dose to the TLDs for a given beam quality
and geometric position of the set of TLDs. The ratio / !" is known as the TLD dose
response. Finally, the term #$%& is the Monte Carlo calculated air kerma at the position of interest for a given beam quality. All the Monte Carlo calculated quantities are obtained for a specific number of photons. Therefore, using Eq. (2), it is possible to calculate the calibration coefficient, , in gray per TLD reading units by measuring the air kerma free‐in‐air with a standard ionization chamber at the position selected for TLD irradiations. As discussed later in the paper, the TLD absorbed dose calibration coefficient, of Eq. (2), is dependent on the TLD irradiation geometry setup. Calibration techniques, based on irradiations of TLDs in air and water, have been developed to obtain energy fluences of primary and secondary photons and electrons reaching the TLDs similar to those obtained when they are surrounded by water and exposed to an 192 Ir source.
II.A.2. Absorbed dose to water distribution for TLDs irradiated in water around an 192 Ir
source
The mean absorbed dose rate to water in a surrounding water medium, (),)+& ,, - , at a radial distance r and a polar angle θ [as defined in the American Association of Physicists in Medicine (AAPM) TG‐43 protocol17] from an 192 Ir source, was determined from the experimental mean
signal per unit of irradiation time obtained for a TLD at the same position, (̅!" ,) ,, - , using the following relation:
(.,./, ,, - = 0 .,. ,,-,. ,,- 1
23
where ),) ,, - is the absorbed dose to water at a position (r, θ) in water calculated using the AAPM TG‐43 formalism17 and
!" ,) ,, - is the calculated mean absorbed dose to the TLD in water at the
same position. The term +& ,, - is the calibration coefficient for the weighted mean energy +& ,, - . This weighted mean energy is calculated within the TLD when irradiated in water by the 192 Ir source and varies according to its position relative to the source.
II.B. TLD dosimeters and performance
A group of 200 cubic LiF:Mg,Cu,P (TLD‐100H, manufactured by Harshaw) TLDs of 1 × 1 × 1 mm nominal volume and 2.48 g/cm3 density were used for all measurements. Detectors were individually
weighed with a calibrated electronic microbalance (model Mettler Toledo MX5) in order to account for possible differences during the experiments. The uncertainty on the measured masses was equal to 0.003 mg (k = 1). Each TLD signal was obtained by dividing the thermoluminescence reading by the mass of the chip.
As raised in recent publications,9,10 there is a concern about the effect of annealing and read‐out processes
on the TLD macroscopic response when TLDs are used in brachytherapy applications. As TLDs are reusable and their response is affected by previous irradiation and thermal history, careful and reproducible handling and annealing techniques were used. This strategy minimizes variations in the sensitivity of the sample and ensures long term stability of the TLD batch. As performed by Olko et
al.,11 LiF:Mg,Cu,P dosimeters were annealed before irradiation in a Fimel E.T.T. calibrated convection
oven at 240 ºC for 10 min. Afterwards, TLDs were allowed to cool down rapidly to room temperature. Dosimeters were read out 2 h after exposure to a photon beam and no fading correction was applied. A manual reader from the Fimel company allowed for a glow curve integration from the main dosimetric peaks using a temperature profile of 135 ºC for 10 s for preheat and 240 ºC for 20 s for the read‐out stage, both with a heating ramp of 6 ºC/s. After a given TLD was cooled down in the reader, a second consecutive reading was performed to check the percentage contribution of the residual reading, which amounted to about 2.0%. A light source was used to check the stability of the reader. TLDs, however, were always loaded in the reader in the same order to reproduce as closely as possible in all experiments the systematic variations that may appear from the photomultiplier tube or from the nitrogen gas flow during read‐out. Four TLDs were kept unexposed for each experiment to estimate the background contribution. Each TLD reading was corrected by an individual sensitivity factor to account for specific variations in individual TLD responses. The sensitivity of the TLDs was assessed from exposures to a reference 137Cs beam each time an experiment trial was carried out. The ratio of an individual TLD
response to the mean value of the sample, all corrected for background contribution, was defined as the sensitivity factor.9 This test was repeated for each TLD before each measurement to detect possible
variations of the response and to improve the accuracy of the measurements. The 137Cs beam and a 60Co
reference beam were used to evaluate the dose and dose‐rate linearity of the batch of LiF:Mg,Cu,P TLDs. Linearity with the dose deviated by less than 0.2% between 5 mGy and 10 Gy and by less than 4.7% with dose‐rates of 5, 100, 1000, and 104 mGy/h.
II.C. Measurements of the kerma response with LiF:Mg,Cu,P TLDs
II.C.1. TLD response when surrounded by air
The air kerma, #$%& , and the TLD signal, , were measured in air18 at the same reference position using a standard 137Cs beam and five highly filtered x‐ray ISO reference beams (N‐30, N‐60, N‐
80, N‐120, and N‐250) all available at the LNE‐LNHB. The x‐ray tubes had constant potential generators and a 2 mm thick Be window. The general characteristics of each photon beam are listed in Table I. For each beam quality, irradiation times (for the 137Cs beam) or the tube current exposure‐time product (for
the x‐ray beams) were adjusted to lead to values of the air kerma between 10 mGy and 1.5 Gy. The uncertainty of the air kerma value obtained with ionization chamber measurements was below 0.41% with k = 1 (including uncertainties in positioning, temperature, pressure, and irradiation times). These in‐air measurements in the x‐ray or in the 137Cs photon beam were described in Ref. 18. Briefly, they
depth drilled holes of a cylindrically shaped polymethyl methacrylate (PMMA) holder of 5 mm thickness and 40 mm diameter (Fig. 1). A thin Mylar layer (approximately 36 µm thick) was used to keep the TLDs in place during the experiments. An extra layer of 4 mm thickness of PMMA was used on the front of the TLDs for 137Cs irradiations to ensure charged particle equilibrium. For x‐rays,
measurements were performed at 80 cm. The “heel effect” caused a variation of the TLD signal between 1% and 2% in the anode‐cathode direction relative to the air kerma value at the central axis, but its influence was averaged when estimating the mean reading of the 10 exposed dosimeters.
Figure 1. PMMA holder designed to position cubic TLDs of 1 mm side length vertically during photon exposures in air. This configuration shows five dosimeters located in the central TLD wells.
II.C.2. TLD response when surrounded by water: A novel method to calibrate TLDs for brachytherapy applications
In TLD dosimetry, the detector calibration is often based on measurements in air. We, however, have designed an extra holder to perform measurements of , in water in electronic equilibrium in the 137Cs photon beam. This experimental setup aims to obtain energy fluences of high energy primary
and secondary photons and electrons reaching the TLD when surrounded by water. Indeed, the irradiation configuration will have an influence on the local ionization effects, and therefore, on the TLD macroscopic response. As for the in‐air experiments previously described, the TLD holder was also constructed from transparent PMMA, but all thicknesses were decreased to minimize the contribution in the TLD of radiation scattered in PMMA. The holder consisted of twenty five holes drilled through a PMMA disk of 1 mm thickness and 30 mm diameter. For the irradiation in water, 15 LiF:Mg,Cu,P chips were loaded in this support (see Fig. 2) which was sandwiched between two layers of 20 µm thickness and about 40 mm diameter constructed from Mylar and taped together in order to waterproof the assembly. An additional paper layer (of about 120 µm thickness) and a black painted Mylar layer were used to provide a nontransparent surface on the front of the TLDs. This allowed for distance measurement from the 137Cs effective source center with a laser measuring device. This distance (194.53
± 0.13 cm) to the central TLD was chosen to be about 2 m to avoid scatter contributions from the 137Cs
unit and to ensure, given the collimation aperture of the 137Cs photon beam, the irradiation of the whole
diameter of the plastic holder. The whole set of Mylar layers, PMMA, TLDs, and the paper circular disk were fitted to the bottom of a cylindrical PMMA rod of 12 cm length and 0.6 cm diameter, which kept the TLDs oriented vertically and provided adjustment of the TLDs depth in water. A rectangular expanded polystyrene foam block was used on the top of the water phantom to fix the TLD support. The TLD support was immersed in the center of a plastic conical water tank of 21 cm height. The tank is transparent and its shape is a truncated cone of 13 and 15 cm lower and upper circular diameters, respectively. The thickness of the plastic tank is 0.75 mm.
Figure 2. Illustration showing the experimental setup with 15 cubic LiF:Mg,Cu,P TLDs of 1 mm side length irradiated in liquid water by a 137Cs photon beam. The TLD support is positioned vertically with
its circular face perpendicular to the longitudinal axis of the photon beam. The circular TLD support is attached to the bottom of a cylindrical PMMA rod. The image on the right side is an illustration showing an enlarged 3D model of the transparent PMMA TLD holder used for irradiations of the crystals. The pink squares simulate the 15 loaded chips used for the experiment. The modelled three thin Mylar layers of 20 µm thickness (taped on the front and back of the PMMA disk) and the paper layer are not shown here for clarity.
II.D. The Monte Carlo code
The PENELOPE Monte Carlo computer program19 was used for all the simulations performed. This
code uses the EPDL97 (Ref. 20) cross‐section library. The code was modified to incorporate calculations
of the mean photon energy weighted with the photon fluence in a TLD [see Eq. (1)]. The code was also changed to include the scoring of electron energies in a TLD weighted with their energy deposited as
5 = ∑ ! ∆ ∑ ∆ (4)
where Ti is the initial kinetic energy of the ith electron when it first enters (or is created in) the TLD and
∆Ei is the total energy deposited by the ith electron inside the TLD (including the energy deposited if it
comes back in the TLD and the energy deposited in the TLD by the secondary particles created by this electron). As for the case of the photon energy descriptor referred to before, this quantity is believed to be indicative of the mean “effective” electron energy within the detector volume.
II.E. Monte Carlo calculations for TLD calibration
II.E.1. Photon spectra
N‐30, N‐60, N‐80, and N‐120 x‐ray spectra used in a previous work18 were modeled using the program
XCOMP (Ref. 21) for a given tube voltage, anode angle (20º), calculation distance and thicknesses of absorbing materials according to the Birch and Marshall model.22 The half‐value layers calculated by
XCOMP were in agreement with the measured values (within 0.3% for the N‐30 up to N‐80 spectrum and within 3.5% for the N‐120 spectrum). The program SpekCalc23 was used in a similar way as
XCOMP to generate the photon spectrum for the N‐250 beam quality. An additional filter of 2 mm of lead in the N‐250 x‐ray spectrum could not be simulated with SpekCalc to generate the incident spectrum and therefore, it had to be included ad hoc in the Monte Carlo simulation. All x‐ray beams were simulated as isotropic point sources collimated with a beam half angle of about 2.4º (corresponding to 6.7 cm of beam aperture at 80 cm distance from the x‐ray focal spot). The 137Cs irradiation system was
already simulated by Gouriou et al.24 and the output spectrum was simply adapted to the PENELOPE
II.E.2. Air kerma and TLD absorbed dose
The air kerma, #$%& , and the mean TLD absorbed dose, !" ) , were calculated for each photon beam used. For the air kerma, the modeled source symmetry helped to improve the calculation efficiency by defining a cylindrical ring‐shaped air detection volume of 5 mm thickness at the point of interest. Following TG‐43 recommendations,17 the air kerma was calculated along the perpendicular bisector, at
θ = 90°, at the reference distance of 100 cm and in a model of negligible photon scattering (all regions outside the air kerma detector volume were defined as vacuum). Volumetric averaging within the air detector volume contributed to an estimated uncertainty of the air kerma of less than 0.1%. No electron transport was simulated and an energy cut‐off of photons was set to 1 keV. Approximately 5 × 10⁹ photon histories were simulated yielding relative type A uncertainties less than 0.4%.
For the mean TLD absorbed dose, !" ) , no dopant concentration was simulated for the dosimeters as the calculated response with Monte Carlo general‐purpose transport simulations is very similar for TLD‐100 and TLD‐100H between 100 and 600 keV (Ref. 5) and Monte Carlo techniques do not show any significant difference between pure LiF and TLD‐100 for the energy range of interest of the spectrum of 192 Ir sources.25 An energy cut‐off of 1 keV for photons and electrons was set up for the TLD
absorbed dose calculation. The number of histories leads to relative type A uncertainties less than 3.2%.
II.F. Measurements and calculations in water for estimates of the absorbed dose to
water around an
192Ir source
LiF:Mg,Cu,P TLD detectors were immersed in water around a Nucletron mHDR‐v2 192Ir source
(Nucletron BV, Veenendaal, The Netherlands). The source was sent to a polystyrene catheter at the center of a 40 × 40 × 40 cm cubic PMMA tank of 1.5 cm thickness filled with water as described in Ref. 18. The reference air‐kerma rate of the 192Ir source was measured using the dosimetric standard of
the LNE‐LNHB.26 For the experiments with the 192Ir source, four irradiations with different positioning
configurations each using 28 TLDs were performed. In each of the four configurations, measurements were carried out for three radial positions (the set of 1, 3, or 5 cm or the set of 1.5, 2.5, and 3.5 cm). At a given radial position r and polar angle θ, four simultaneous TLD measurements were taken at azimuthal angle offsets of 90º. In each of the four configurations, the two positional variables (the radius and the polar angle) provided seven different distances away from the 192Ir source to
estimate (̅!" ,) ,, - (see Fig. 3). The exposure time of the TLDs to the 192 Ir source included the transit
time of the source from its shielded position in the MicroSelectron to the end of the polystyrene catheter at the phantom center and the actual time of full TLD irradiation. The overall irradiation time was estimated with a manual timer having an assumed negligible measurement uncertainty compared with the uncertainty on the TLD reading. An additional correction was applied to account for the source activity decay between irradiations using the four measurement configurations. The determination of the detector to source distance was carried out on the basis of the 3D scale drawings for the measurement designs with the TLD supports constructed from PMMA. This, however, does not account for possible displacements of the source within the polystyrene catheter, or possible deviations of the TLD detector positions (relatively small tilts of the PMMA TLD holders when dipped in water).
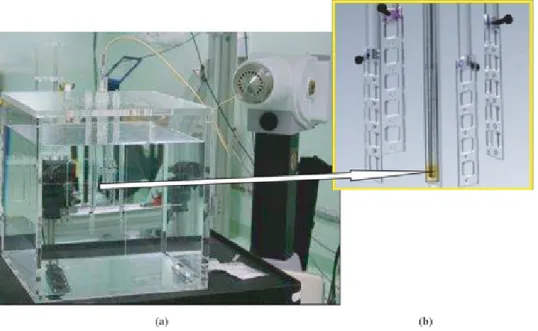
Figure 3. (a) Experimental setup with 28 LiF:Mg,Cu,P TLDs irradiated in liquid water with a HDR 192Ir
source. (b) The arrow points to the location of the source which is enlarged and shown along with the PMMA TLD holders.
The mean absorbed dose to the TLD when irradiated in water under the experimental conditions at TLD detector positions, !" ,) ,, -) , was calculated with the PENELOPE Monte Carlo code. This code was adapted to emit photons homogeneously within the active 192Ir source volume as well as to account
for the calculation of the weighted mean photon and electron energies in the TLDs for the experimental conditions simulated. Measurements were performed with the old mHDR‐v2 source (which uses the geometry previous to modifications published by Granero et al.27) and therefore, details on the geometry
of the Nucletron 192Ir source were taken from Daskalov et al.28 and the CLRP TG‐43 Parameter Database
for Brachytherapy.29 The source energy spectrum was simulated by including 37 energy lines of photon
emission.30 The photon and electron cut‐off energies were set to 1 keV for all calculations of absorbed
dose to water.
The distribution of absorbed dose to water, ),) ,, -) , was calculated using the same PENELOPE Monte Carlo code and a water phantom of 80 × 80 × 80 cm which approximates full scatter conditions for distances up to 20 cm from the center of the source.31,32 No source catheter was modeled and a 2 mm
long stainless steel cable having an effective density of 4.81 g/cm3 was included in the simulations. Each
calculated value of ),) ,, -) was scored for positions agreeing with those of TLDs but also included distances in the transverse plane at 0.75, 1, 1.5, 2, 3, 5, 7, and 10 cm from the source in order to provide extra values for validation of the radial dose function, g(r), against AAPM published results. Water interaction volumes for detection were modeled as source‐concentric water rings of varying thicknesses to account for the local gradient of the absorbed dose along the distance from the source. Thicknesses of the rings were taken to be equal to 0.2 mm for the detection volume at 0.75 cm away from the source, 0.5 mm for detectors simulated between 1 and 2 cm from the 192Ir source and 1 mm for detection
volumes at distances larger than 3 cm away from the source. Furthermore, for distances at 1 and 3 cm from the source, water interaction volumes were defined at polar angles between 0º and 180° in order to validate the calculated anisotropy function, F(r, θ), against published results. The number of histories was adjusted so as to give statistical uncertainties less than 0.8%.
III. RESULTS
III.A. LiF:Mg,Cu,P air kerma and dose response
The TLD air kerma and dose response results are shown in Table II and Table III. The 2nd row of Table II provides the Monte Carlo calculated values of the weighted mean photon energy for each beam quality. The third and fourth lines of Table II show the measured air kerma and dose responses, both normalised to the in‐air 137Cs results. The last row of the same table presents the dose response
normalized to the 137Cs results obtained in water. The combination of uncertainties is presented in
Table III. Uncertainties of the air kerma response normalized to the 137Cs result obtained in air are less
than 2.92% (k = 1). Uncertainties in dose responses relative to the in‐air and in‐water 137Cs values are
less than 3.14% and 4.71% (k = 1), respectively.
Table I. Characteristics of the photon beams used at the LNE‐LNHB for calibration of the TLDs.
Beam quality descriptor Tube voltage (kV)
Additional filtration (mm) 1st HVL +& ,, - (keV) Effective energy (keV) Pb Sn Cu Al N‐30 30 3.493 1.141 mm Al 24.5 23 N‐60 60 0.605 3.990 0.239 mm Cu 47.4 46 N‐80 80 1.901 3.990 0.579 mm Cu 64.0 64 N‐120 120 0.999 3.485 3.990 1.705 mm Cu 97.0 101 N‐250 250 2.0 2.037 3.990 5.165 mm Cu 202.5 209 137Cs … 613.8 662
Table II. Relative responses for the six photon beam configurations used.
Photon beam N‐30 N‐60 N‐80 N‐120 N‐250 137Cs in air 137Cs in water (keV) 24.5 47.4 64.0 97.0 202.5 613.8 528.4 1.077 1.140 1.012 0.870 0.925 1.0 … 0.773 0.820 0.798 0.770 0.867 1.0 … +& ,, - 0.719 0.763 0.742 0.716 0.807 … 1.0
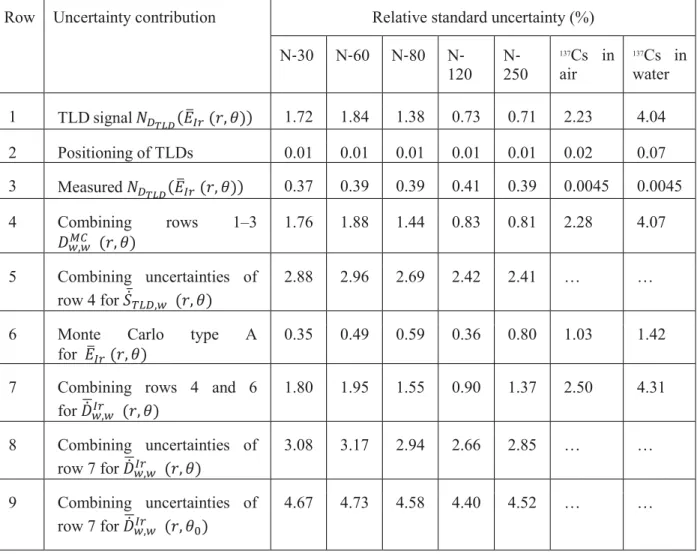
Table III. Relative standard uncertainties in percent (k = 1) for the TLD response.
Row Uncertainty contribution Relative standard uncertainty (%)
N‐30 N‐60 N‐80 N‐ 120 N‐250 137Cs in air 137Cs in water 1 TLD signal +& ,, - 1.72 1.84 1.38 0.73 0.71 2.23 4.04 2 Positioning of TLDs 0.01 0.01 0.01 0.01 0.01 0.02 0.07 3 Measured +& ,, - 0.37 0.39 0.39 0.41 0.39 0.0045 0.0045 4 Combining rows 1–3 ),) ,, - 1.76 1.88 1.44 0.83 0.81 2.28 4.07 5 Combining uncertainties of row 4 for (̅!" ,) ,, - 2.88 2.96 2.69 2.42 2.41 … …
6 Monte Carlo type A
for +& ,, -
0.35 0.49 0.59 0.36 0.80 1.03 1.42
7 Combining rows 4 and 6 for (),)+& ,, -
1.80 1.95 1.55 0.90 1.37 2.50 4.31
8 Combining uncertainties of row 7 for (),)+& ,, -
3.08 3.17 2.94 2.66 2.85 … …
9 Combining uncertainties of row 7 for (),)+& ,,
-8
4.67 4.73 4.58 4.40 4.52 … …
III.B. Estimation of the absorbed dose to water with LiF:Mg,Cu,P TLDs irradiated
in liquid water around an
192Ir source
III.B.1. Calibration coefficients to get the absorbed dose to the LiF:Mg,Cu,P TLDs The weighted mean photon energy estimated with Monte Carlo methods for the experimental TLD configuration in water, (),)+& ,,
-8 , ranged between 259 and 377 keV for all irradiated TLD positions.
The type A Monte Carlo uncertainties were less than 0.5% (k = 1). This energy interval falls between the weighted mean photon energies obtained from TLD exposures in air to the N‐250 x‐ray beam
( 9
,:
;< &,= > +& ,, - ? (̅!" ,) ,, - equal to 202.5 keV) and irradiations performed with
TLDs in water with the 137Cs photon beam ( (
),)+& ,, -8 = @/,A BCD&, equal to 528.4 keV).
Irradiations performed with the 137Cs photon beam using the in‐air geometry corresponded to a higher
weighted mean photon energy at the TLD (( 9
,:
;< &,= > +& ,, - ? (̅!" ,) ,, - equal to 613.8
keV). Therefore, the in‐air calibration coefficient was not selected for brachytherapy applications. Finally, the two calibration coefficients obtained using Eq. (2) for exposures in air to the N‐250 x‐ray
beam and irradiations performed with TLDs in water with the 137Cs photon beam can then be used to
estimate the calibration coefficients, , for the LiF:Mg,Cu,P TLDs irradiated by the 192Ir source in water
at the 28 different positions previously described. The estimation of can also be obtained as a function of the weighted mean electron energy in the TLD as defined by Eq. (4). Using the electron weighted mean energy instead of the photon one leads to a mean difference of 0.1% in the calibration coefficient, therefore the photon weighted mean energy was the final choice for the rest of the analysis. The
maximum uncertainty on the fitted calibration coefficient for the 192Ir irradiations, ̅ /
E ̅ / F<G,
was 2.8% (k = 1).
III.B.2. Absorbed dose rate to water for LiF:Mg,Cu,P TLDs irradiated around an 192Ir
source
To estimate the absorbed dose to water at a position (r, θ) in water calculated using the AAPM TG‐43 formalism,17 ̅ / ;<
H ̅ / ;< I<G, the radial dose function, g(r), was obtained showing an excellent
agreement (within 0.3%) against results published by the Carleton CLRP TG‐43 Parameter Database29 between 0.75 and 10 cm away from the source. The mean discrepancies against the CLRP
TG‐43 Parameter Database29 found for the anisotropy function, F(r, θ), at 1 and 3 cm away from the
source are 1% and 2%, respectively, and may be due to small differences in the geometry of the tip and the cable of the source modeled.
The 3D distribution as determined for the 192Ir source with TLDs in liquid water is measured using the
experimental configuration shown in Fig. 3. The maximum relative experimental uncertainty on the mean TLD signal per unit of irradiation time, ̅ / ;<
H ̅ / ;< I<G: JK , was 11% (k = 1) found at 1 cm
from the source. This uncertainty reflects the total uncertainty on the TLD signal (including the reader response but excluding the uncertainty on the sensitivity factor since TLD individual readings were corrected according to their sensitivity) as well as uncertainties arising from possible displacements of the source within the polystyrene catheter, and possible deviations of the TLD holders. As mentioned by Taylor et al.,33 an experimental technique to assess the relative source‐TLD distance in a liquid water
environment is challenging particularly for distances of about 1 cm or less. The precision of the source positioning within the catheter when the source is released from the MicroSelectron is ±1.5 mm and the source activity does not allow measurements with manual callipers with the source in place. All the contributions to the uncertainty on positioning were estimated indirectly from the variation of the mean TLD signal measured simultaneously at the four azimuthal offsets with four TLDs for a given value of r and θ and provided a relative uncertainty on the TLD positioning ranging from 1.4% up to 5.6%. For the simulations of TLD experiments in water, the weighted mean photon energy, ̅!" , had a
relative standard deviation of about 10%. This reflects the significant variation of the energy with the position of the detector relative to the iridium source. The maximum relative uncertainty on the mean absorbed dose rate to water, #$%& ), 11.6% (k = 1), was found at the closest distance (about 1 cm)
from the brachytherapy source, where the steepest gradient in the dose profile is found and the size of the TLD is too large to sample the absorbed dose with a lower uncertainty.
IV. DISCUSSION
IV.A. LiF:Mg,Cu,P air kerma response
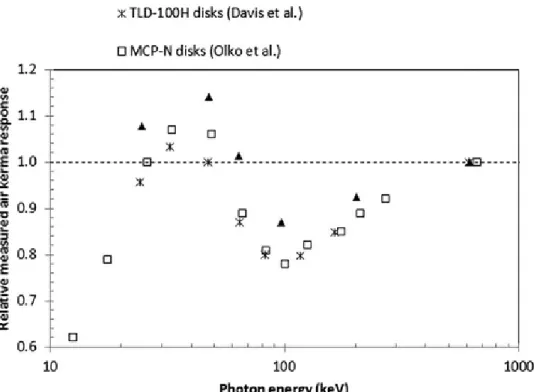
Measurements of the relative air kerma response as a function of the photon energy of each beam are compared with published results5,13 in Fig. 4 for the in‐air measurement geometry. Our results follow the
variation of published values. Figure 4 and results in the third row of Table II show that our values are less than unity for energies greater than 64 keV. Curve shapes shown in Fig. 4 should be compared independently of the uncertainty contributions as Davis et al.5 provided only type A uncertainties and
results of Olko et al.13 do not show their estimated uncertainties. Values of Davis et al.5 are below our
values by 10% to 13% between 25 keV and 64 keV and as seen from the trend of points displayed in Fig. 4, this difference decreases with increasing energy (down to 6% at about 200 keV). This result can be explained by the use of a PMMA layer of 1.63 mm by Davis et al.5 in front of the TLDs for all the x‐
ray exposures. The use of this PMMA layer may decrease the mean energy of photons and electrons reaching the TLDs and therefore increases the LET of secondary electron tracks within the LiF:Mg,Cu,P crystals. This phenomenon may result in a faster local saturation of the detector traps and therefore, in
a lower macroscopic response compared to our results, which only used 36 µm of Mylar in front of the TLDs when exposed in‐air to x‐ray photon beams. The influence of this PMMA thickness lessens with the increase in photon energy as shown by the closer agreement (6%) found at higher energies. For the case of values of Olko et al.,13 the lack of further information on the geometrical setup used does not
allow a similar explanation to justify the mean difference of 8% found with our relative measurements over the energies covered. Finally, it is important to emphasize that our detector thickness (1 mm) was also different than that used by Davis et al.5 (0.38 mm) or Olko et al.13 (0.65 mm). Carlsson et
al.9 mentioned, however, that the effect of the detector thickness on the mean absorbed dose is negligible
for photons above 40 keV. Relative differences with Olko et al.13 and Davis et al.5 may also arise from
the use of different annealing regimes as highlighted by Horowitz.34
Figure 4. Variation of the relative measured air kerma response for LiF:Mg,Cu,P TLDs exposed in air to different photon energies. Results are compared with those provided by Davis et al. (Ref. 5) and Olko et al. (Ref. 13).
IV.B. LiF:Mg,Cu,P dose response
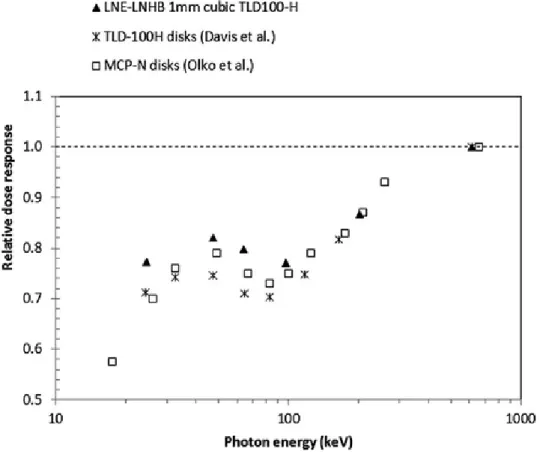
The variation of the TLD dose response for measurements performed in air as a function of the mean photon energy of the beam is illustrated in Fig. 5. As before, our results follow the variation of published values. All values are below unity and are interpreted as the result of an under‐response. This is explained from the microdosimetric theory as a consequence of saturation effects caused by deposits of high doses in small target volumes (on the 60 to 180 nm scale),11 i.e., even a few ionization densities
derived from low‐energy electron tracks can cause local saturation in LiF:Mg,Cu,P crystals. The known “anomalous” low energy response found around 100 keV is also observed in our experiments with a local minimum obtained at 97 keV (Olko et al.13,35 determined that it is between 83 and 90 keV). This
minimum is explained as the result of competition between the photoelectric and the Compton effects. Photoelectric processes are progressively replaced by Compton interactions above 30 keV (where electrons are ejected with about 3 keV in pure LiF) up to 120 keV (where electrons are ejected with about 38 keV). The frequency‐mean linear energy, yF, is directly related to the ionization density, and
Olko et al.13 used Monte Carlo calculations of electron tracks in microdosimetric distributions to
100 keV, which agrees with the local minimum found in our TLD dose response. Average differences of the relative dose response with published results,13,5 shown in Fig. 5, are between 5% and 8% higher
for all photon energies. For photon energies above 100 keV, mean differences decrease and range between 3% and 5%. Again, our values are higher than those included in the comparison and the reason may be due to the effect of different in‐air TLD irradiation geometries or annealing stages used by other authors.
Figure 5. Variation of the relative dose response for LiF:Mg,Cu,P TLDs exposed in air to different photon energies. Results are compared with those provided by Davis et al. (Ref. 5) and Olko et al. (Ref. 13).
The relative dose response normalized to the result obtained for TLD irradiations with the 137Cs beam in
liquid water is shown in the last line of Table II. Values differ by 7% from those obtained using the normalization from the in‐air 137Cs irradiations. This behavior was expected since the mean energy of
photons, and so that of electrons, within the TLD is lower in water. Since the ionization density locally increases with the decrease in energy, saturation effects become more likely to occur in this case.
IV.C. Estimation of the absorbed dose to water with LiF:Mg,Cu,P TLDs irradiated
in liquid water around an
192Ir source
To validate our methodology, the mean absorbed dose rate to water values ̅!" / #$%& were
corrected for the anisotropy using published results28,36 according to the AAPM TG‐43 formalism to
provide the mean absorbed dose to water in the transverse plane ̅ /
E ̅ / F<G. A potential
function is fitted to the final corrected quantity #$%& / !" (see dashed curve displayed in
Fig. 6) and the results provide a good regression coefficient (equal to 0.9898). This was compared with the Carleton University published “along‐away” dose values29 for radial position ranging between 1 and
10 cm, as shown in Fig. 7. Differences are less than 3.1% between 1 and 10 cm from the source and are not significant within uncertainties (4.1% k = 1). An exception occurs at 9 cm from the source where the difference between the AAPM and our value increases up to 5.8%. This could be due to the increase
in the measurement uncertainty in the estimate of the background contribution relative to the TLD signal, which is small at large distances from the source.
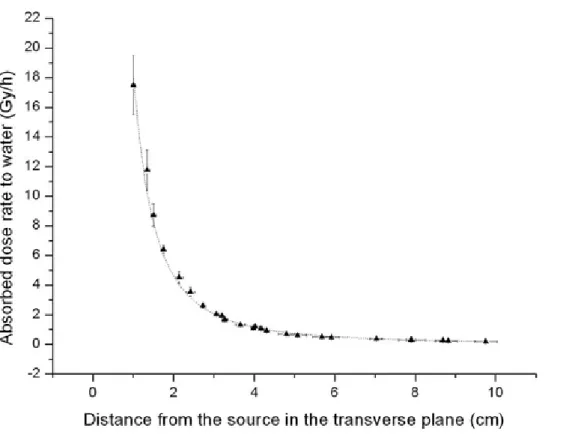
Figure 6. Variation of absolute dose rate to water values with LiF:Mg,Cu,P TLDs in liquid water as a function of the distance along the transverse axis of the 192Ir source. An exponential function of
type ̅!" / !" , with parameters B equal to (18.36 ± 0.45) (Gy cm2 h−1), and A equal to
(−0.0031 ± 0.0042) (cm−1) provided the best fit.
Figure 7. Comparison between along‐away dose values derived from our methodology and those
published by Carleton University (Ref. 29) for radial position ranging from 1 to 10 cm.
Another validation of our methodology to estimate the mean absorbed dose rate to water around a 192Ir
source can be carried out. For this purpose, the following factor:
̅ / ;< H ̅ / ;< I<G (5)
extracted from Eq. (3), was compared with unity. An exact equality with unity would mean that the estimated calibration coefficient takes into account accurately what is happening in the TLDs when irradiated around the 192 Ir source.
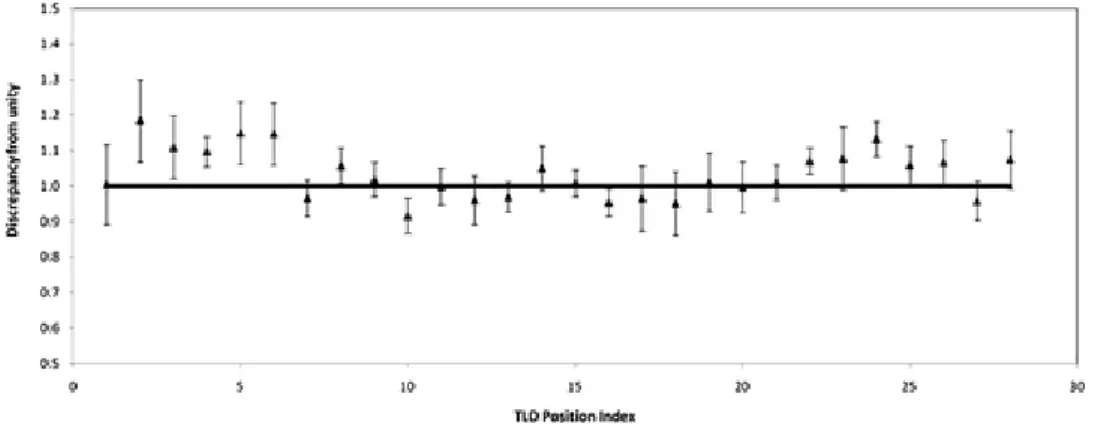
In order to compare Eq. (5) with unity, a scale factor which uses the measured LNE‐LNHB reference air kerma rate has to be introduced to obtain a dimensionless quantity. The results are shown in Fig. 8. The mean percentage difference with unity is within 3.5% and this difference is not statistically significant (the average uncertainty of the unity factor is 6.6% with k = 1) for all distances.
Figure 8. Test of the LNE‐LNHB TLD methodology to estimate the absorbed dose to water around
an 192Ir brachytherapy source. Values of ̅ / ;<
H ̅ / ;< I<G: JK are compared to 1.
V. CONCLUSIONS
This paper develops a methodology based on measurements and Monte Carlo calculations to directly estimate the absorbed dose in liquid water around an 192Ir brachytherapy source with highly sensitive
LiF:Mg,Cu,P TLDs.
Several experimental designs and Monte Carlo simulations were performed to study the air kerma and the dose detector response of LiF:Mg,Cu,P TLDs to photon beams of different energies. The LiF:Mg,Cu,P crystals show a LET dependence which follows variations of published values although a lower under‐response was observed in our work. Deviations from literature values are, however, expected due to the use of different irradiation setups and as a result of discrepancies in the annealing stages used to handle the TLDs. The LET dependence determines the real detector response depending on the photon and electron energy fluence arriving to the TLD and cannot be modeled or corrected by general‐purpose Monte Carlo techniques of radiation transport in the detectors. In order to account for this, a novel calibration method was developed for brachytherapy applications which uses Monte Carlo calculations and LiF:Mg,Cu,P TLD exposures in air to a standard N‐250 x‐ray beam, and in water, to a standard 137Cs photon beam. This method proved to be accurate leading to a maximum uncertainty of
2.8% (k = 1) for the TLD calibration coefficient found when detectors are irradiated in water around an 192Ir source.
The experimental design used to measure the 3D TLD signal in liquid water around a high dose rate 192Ir
source is challenging and positional deviations were compensated for at each position by repeated TLD measurements at four azimuthal angle offsets of 90º. These deviations lead to positional uncertainties ranging from 1.4% to 5.6%. The experimental setup which used TLDs in liquid water lead to a maximum experimental uncertainty on the mean TLD signal per unit of irradiation time of 11.0% (k = 1) found at about 1 cm from the source. The Monte Carlo model used to get the absorbed dose to water around a 192Ir
source was validated by comparison with calculations from the literature. Very good agreement was demonstrated. Finally, the TLD dosimetric method based on measurements and Monte Carlo calculations was used to obtain the absorbed dose in water around a high dose rate 192Ir source. The
closest distance (about 1 cm) from the brachytherapy source. In this region, the gradient in the absorbed dose profile is high and the size of the TLDs (1 mm) is too large to sample the absorbed dose with a lower uncertainty. The mean absorbed dose to water was also obtained in the transverse plane using published anisotropy corrections for comparison against validated published results using the AAPM TG‐43 formalism. Differences between our results and those from the published along‐away dose values were less than 3.1% for positions ranging between 1 and 10 cm away from the 192Ir source. These were
within uncertainties (4.1% k = 1) except for the result at 9 cm, where the discrepancy increases up to 5.8%, possibly due to the significant increase of the ratio of the background contribution to the main TLD signal. An alternative validation of the methodology was performed leading to an overall difference of 3.5% over all the positions of interest which was not significant (within a mean uncertainty of 6.6%, k = 1). Our study demonstrated that reliable results can be obtained when the relative detector response is taken into account depending on the beam quality.
The LNE‐LNHB TLD methodology can therefore be used to provide estimates of the absolute absorbed dose to water for an 192Ir source. The results show, however, the need to reproduce with accuracy
irradiation geometry configurations, annealing, reading, and handling TLD procedures in order to use properly the calibration coefficients estimated for the TLDs when irradiated with an HDR 192Ir source.
Otherwise, detector responses may vary from the expected behavior, affecting the final values of the absorbed dose to water.
ACKNOWLEDGMENTS
This study is part of the WP5 of the European JRP T2.J06 on “Increasing cancer treatment efficacy using 3D brachytherapy.” The authors would like to thank M. Denozière and E. Leroy for the experiments with x‐ray beams, F. Moignau for the irradiations with the 60Co and 137Cs photon beams,
and L. de Carlan for his comments and suggestions on the Monte Carlo simulations in water around the iridium source. The authors would like to specifically acknowledge the work of E. Leroy who also constructed the PMMA holders for the TLD irradiations in water with 137Cs. The authors are grateful to
D. R. Dance for his help in simulating the N‐250 x‐ray beam. The authors thank M. Avilés Lucas for valuable discussions on the statistical analysis of the data. The authors are indebted to F. Delaunay for extremely useful scientific talks.
REFERENCES
1 Z. Li, R. K. Das, L. A. DeWerd, G. S. Ibbott, A. S. Meigooni, J. Pérez‐Calatayud, M. J. Rivard, R. S. Sloboda, and J. F. Williamson, “ Dosimetric prerequisites for routine clinical use of photon emitting brachytherapy sources with average energy higher than 50 keV,” Med. Phys. 34, 37– 40 (2007). DOI 10.1118/1.2388155
2 L. A. DeWerd, G. S. Ibbott, A. S. Meigooni, M. G. Mitch, M. J. Rivard, K. E. Stump, B. R. Thomadsen, and J. L. M. Venselaar, “ A dosimetric uncertainty analysis for photon‐emitting brachytherapy sources: Report of AAPM Task Group No. 138 and GEC‐ESTRO,” Med. Phys. 38, 782– 801 (2011). DOI 10.1118/1.3533720
3 Interstitial Collaborative Working Group (ICWG), Interstitial Brachytherapy: Physical, Biological, and Clinical Considerations, edited by L. L. Anderson, R. Nath, K. A. Weaver, D. Nori, T. L. Phillips, Y. H. Son, S.‐T. Chiu‐Tsao, A. S. Meigooni, J. A. Meli, and V. Smith (Raven, New York, 1990).
4 R. K. Das, Z. Li, H. Perera, and J. F. Williamson, “ Accuracy of Monte Carlo photon transport simulation in characterizing brachytherapy dosimeter energy‐response artefacts,” Phys. Med. Biol. 41, 995– 1006 (1996). DOI 10.1088/0031‐9155/41/6/004
5 S. D. Davis, C. K. Ross, P. N. Mobit, L. Van der Zwan, W. J. Chase, and K. Shortt, “ The response of LiF thermoluminescence dosemeters to photon beams in the energy range from 30 kV x
rays to 60Co gamma rays,” Radiat. Prot. Dosim. 106, 33– 43 (2003). DOI 10.1093/oxfordjournals.rpd.a006332
6 A. A. Nunn, S. D. Davis, J. A. Micka, and L. A. De Werd, “ LiF: Mg, Ti TLD response as a function of photon energy for moderately filtered x‐ray spectra in the range 20‐250 kvP relative to 60Co,” Med. Phys. 35, 1859– 1869 (2008). DOI 10.1118/1.2898137
7 L. Antonovic, H. Gustafsson, G. Alm Carlsson, and Å. Carlsson Tedgren, “ Evaluation of a lithium formate EPR dosimetry system for dose measurements around 192Ir brachytherapy sources,” Med. Phys. 36, 2236– 2247 (2009). DOI 10.1118/1.3110068
8 E. Adolfsson, G. Alm Carlsson, J.‐E. Grindborg, H. Gustafsson, E. Lund, and Å. Carlsson Tedgren, “ Response of lithium formate EPR dosimeters at photon energies relevant to the dosimetry of brachytherapy,” Med. Phys. 37, 4946– 4959 (2010). DOI 10.1118/1.3475938
9 Å. Carlsson Tedgren, A. Hedman, J.‐E. Grindborg, and G. Alm Carlsson, “ Response of LiF:Mg,Ti thermoluminescent dosimeters (TLDs) at photon energies relevant to the dosimetry of brachytherapy (<1 MeV),” Med. Phys. 38, 5539– 5550 (2011). DOI 10.1118/1.3633892
10 Å. Carlsson Tedgren, R. Elia, H. Hedtjärn, S. Olson, and G. Alm Carlsson, “ Determination of absorbed dose to water around a clinical HDR 192Ir source using LiF:Mg,Ti TLDs demonstrates an LET dependence of detector response,” Med. Phys. 39, 1133– 1140 (2012). DOI 10.1118/1.3675401 11 P. Olko, P. Bilski, N. A. El‐Faramawy, H. Y. Göksu, J. L. Kim, R. Kopec, and M. P. R. Waligórski, “ On the relationship between dose‐, energy‐ and LET‐response of thermoluminescent detectors,” Radiat. Prot. Dosim. 119, 15– 22 (2006). DOI 10.1093/rpd/nci611
12 M. Moscovitch and Y. S. Horowitz, “ Thermoluminescent materials for medical applications: LiF:Mg,Ti and LiF:Mg,Cu,P,” Radiat. Meas. 41, S71– S77 (2006). DOI 10.1016/j.radmeas.2007.01.008 13 P. Olko, P. Bilski, E. Ryba, and T. Niewiadomski, “ Microdosimetric interpretation of the anomalous photon energy response of ultra‐sensitive LiF:Mg,Cu,P TL Dosemeters,” Radiat. Prot. Dosim. 47, 31– 35 (1993).
14 P. Olko, “ Microdosimetric interpretation of thermoluminescence efficiency of LiF:Mg, Cu, P (MCP‐N) detectors for weakly and densely ionising radiation,” Radiat. Prot. Dosim. 65, 151– 158 (1996). DOI 10.1093/oxfordjournals.rpd.a031610
15 M. Zaider, “ Microdosimetry and Katz's track structure theory 1. one‐hit detectors,” Radiat. Res. 124, S16– S22 (1990).DOI 10.2307/3577672
16 Joint research project, co‐funded in the 7th FP, according to the iMERA‐Plus Grant Agreement No. 217257 between the EC and EURAMET e. V. Project “T2.J06, Increasing cancer treatment efficacy using 3D brachytherapy” (short name T2.J06, “Brachytherapy”), July 2008–July 2011.
17 R. Nath, L. L. Anderson, G. Luxton, K. A. Weaver, J. F. Williamson, and A. S. Meigooni, “ Dosimetry of interstitial brachytherapy sources: Recommendations of the AAPM Radiation Therapy Committee Task Group No. 43,” Med. Phys. 22, 209– 234 (1995). DOI 10.1118/1.597458
18 P. Avilés Lucas, V. Lourenço, D. Vermesse, D. Cutarella, and I. Aubineau‐Lanièce, “ Absorbed dose to water distribution measured around an HDR 192Ir brachytherapy source by thermoluminescent dosimeters,” Metrologia 49, S228– S230 (2012). DOI 10.1088/0026‐1394/49/5/S228
19 F. Salvat, J. M. Fernández‐Varea, and J. Sempau, “ PENELOPE‐2008: A code system for Monte Carlo simulation of electron and photon transport,” (2009) (available URL: http://www.nea.fr/science/pubs/2009/nea6416‐penelope.pdf).
20 D. E. Cullen, J. H. Hubbell, and L. Kissel, “ EPDL97 The evaluated data library, 097 version,” Report UCRL‐50400, Vol. 6, Rev. 5, Lawrence Livermore National Laboratory, Livermore, CA, 1997. 21 R. Nowotny and A. Hofer, “ Ein program fur die berechnung von diagnostic Rontgenspektren,” Fortschr. Rontgenstr. 142, 685– 689 (1985). DOI 10.1055/s‐2008‐1052738
22 R. Birch and M. Marshall, “ Computation of bremsstrahlung x‐ray spectra and comparison with spectra measured with a Ge(Li) detector,” Phys. Med. Biol. 24, 505– 517 (1979). DOI 10.1088/0031‐ 9155/24/3/002
23 G. Poludniowski, G. Landry, F. DeBlois, P. M. Evans, and F. Verhaegen, “ SpekCalc: A program to calculate photon spectra from tungsten anode x‐ray tubes,” Phys. Med. Biol. 54, N433– N438 (2009). DOI 10.1088/0031‐9155/54/19/N01
24 J. Gouriou, “ Le calcul de spectre photonique issu de l'irradiateur césium 137 n°1 C à l'aide du code MCNP5,” Internal Report LNHB 08/93, Laboratoire National Henri Becquerel, CEA, Saclay, France, 1993.
25 P. N. Mobit, A. E. Nahum, and P. Mayles, “ A Monte Carlo study of the quality dependence factors of common TLD materials in photon and electron beams,” Phys. Med. Biol. 43, 2015– 2032 (1998). DOI 10.1088/0031‐9155/43/8/002
26 G. Douysset, J. Gouriou, F. Delaunay, L. DeWerd, K. Stump, and J. Micka, “ Comparison of dosimetric standards of USA and France for HDR brachytherapy,” Phys. Med. Biol. 50, 1961– 1978 (2005). DOI 10.1088/0031‐9155/50/9/003
27 D. Granero, J. Vijande, F. Ballester, and M. J. Rivard, “ Dosimetry revisited for the HDR 192Ir brachytherapy source model mHDR‐v2,” Med. Phys. 38, 487– 494 (2011). DOI 10.1118/1.3531973 28 G. M. Daskalov, E. Löffler, and J. F. Williamson, “ Monte Carlo‐aided dosimetry of a new high dose‐rate brachytherapy source,” Med. Phys. 25, 2200– 2208 (1998). DOI 10.1118/1.598418
29 See http://www.physics.carleton.ca/clrp/seed_database for CLRP TG‐43 Parameter Database, Carleton Laboratory for Radiotherapy Physics.
30 E. Browne, BNM‐CEA/LNHB Table of Radionucléides, LBNL, 30/06/1998–09/12/2003 (available URL: http://www.nucleide.org/DDEP_WG/Nuclides/Ir‐192_tables.pdf).
31 J. Perez‐Calatayud, D. Granero, and F. Ballester, “ Phantom size in brachytherapy source dosimetric studies,” Med. Phys. 31, 2075– 2081 (2004). DOI 10.1118/1.1759826
32 R. E. Taylor and D. W. Rogers, “ EGSnrc Monte Carlo calculated dosimetry parameters for 192Ir and 169Yb brachytherapy sources,” Med. Phys. 35, 4933– 4944 (2008). DOI 10.1118/1.2987676 33 R. Tailor, N. Tolani, and G. S. Ibbott, “ Thermoluminescence dosimetry measurements of brachytherapy sources in liquid water,” Med. Phys. 35, 4063– 4069 (2008). DOI 10.1118/1.2968097 34 Y. S. Horowitz, “ Letter to the editor‐update on AAPM Task Group No. 43 report‐brachytherapy and TLD,” Radiat. Prot. Dosim. 133, 124– 125 (2009).DOI 10.1093/rpd/ncp018
35 P. Olko, P. Bilski, M. Budzanowski, M. P. R. Waligórski, A. Fasso, and N. Ipe, “ Modelling of the thermoluminescence response of LiF:Mg,Cu,P (MCP‐N) detectors after doses of low energy photons,” Radiat. Prot. Dosim. 84, 103– 108 (1999). DOI 10.1093/oxfordjournals.rpd.a032695 36 F. Lliso, J. Pérez‐Calatayud, V. Carmona, F. Ballester, J. L. Lluch, M. A. Serrano, Y. Limami, and E. Casal, “ Fitted dosimetric parameters of high dose‐rate 192Ir sources according to the AAPM TG43 formalism,” Med. Phys. 28, 654– 660 (2001). DOI 10.1118/1.1359438