HAL Id: hal-03124926
https://hal.archives-ouvertes.fr/hal-03124926
Submitted on 1 Feb 2021
HAL is a multi-disciplinary open access
archive for the deposit and dissemination of
sci-entific research documents, whether they are
pub-lished or not. The documents may come from
teaching and research institutions in France or
abroad, or from public or private research centers.
L’archive ouverte pluridisciplinaire HAL, est
destinée au dépôt et à la diffusion de documents
scientifiques de niveau recherche, publiés ou non,
émanant des établissements d’enseignement et de
recherche français ou étrangers, des laboratoires
publics ou privés.
Glacial cycles: Toward a new paradigm
Didier Paillard
To cite this version:
Didier Paillard. Glacial cycles: Toward a new paradigm. Reviews of Geophysics, American
Geophys-ical Union, 2001, 39 (3), pp.325-346. �10.1029/2000RG000091�. �hal-03124926�
Didier Paillard
Laboratoire des Sciences du Climat et de
I'Environnement, CEA-CNRS
Centre d'Etudes de Saclay, Orme des Merisiers Gif-sur- Yvette, France
Abstract. The largest environmental changes in the recent geological history of the Earth are undoubtedly the successions of glacial and interglacial times. It has been clearly demonstrated that changes in the orbital parameters of our planet have a crucial role in these cycles. Nevertheless, several problems in classical astro- nomical theory of paleoclimate have indeed been iden- tified: (1) The main cyclicity in the paleoclimatic record is close to 100,000 years, but there is no significant orbitally induced changes in the radiative forcing of the Earth in this frequency range (the "100-kyr problem"); (2) the most prominent glacial-interglacial transition occurs at a time of minimal orbital variations (the "stage 11 problem); and (3) at ---0.8 Ma a change from a 41-kyr dominant periodicity to a 100-kyr periodicity occurred without major changes in orbital forcing or in the Earth's configuration (the "late Pleistocene transition prob- lem"). Additionally, the traditional view states that the climate system changes slowly and continuously together with the slow evolution of the large continental ice
sheets, whereas recent high-resolution data from ice and marine sediment cores do not support such a gradual scenario. Most of the temperature rise at the last termi-
nation occurred over a few decades in the Northern
Hemisphere, indicating a major and abrupt reorganiza- tion of the ocean-atmosphere system. Similarly, huge iceberg discharges during glacial times, known as Hein- rich events, clearly demonstrate that ice sheet changes may also be sometimes quite abrupt. In light of these recent paleoclimatic data the Earth climate system ap- pears much more unstable and seems to jump abruptly between different quasi steady states. Using the concept of thresholds, this new paradigm can be easily integrated into classical astronomical theory and compared with recent observational evidence. If the ice sheet changes are, by definition, the central phenomenon of glacial- interglacial cycles, other components of the climate sys- tem (atmospheric CO2 concentration, Southern Ocean productivity, or global deep-ocean circulation) may play an even more fundamental role in these climatic cycles.
1. INTRODUCTION
The first astronomical theory of paleoclimates is al- ready more than 150 years old (a detailed account of the history of this scientific adventure is given by Imbrie and Imbrie [1979]). The astronomical forcing is now well
known, at least for the late Pleistocene. Recent advances in geochemistry helped to quantify the geological record, and it is now evident that climatic cycles have frequen- cies nearly identical to the Earth's orbital frequencies. However, the story is not finished, since we still do not understand how the climate system works and how small changes in the insolation at the top of the atmosphere can be amplified by the Earth system to create the large cli- matic changes associated with glacial-interglacial cycles. Traditionally, ice age models have concentrated on the behavior of the large Northern Hemisphere ice sheets, the Laurentide and the Fennoscandian. In light of recent pa- leoclimatic data this approach now appears insufficient. Indeed, ice age cycles involve a reorganization not only of the ice sheets but also of the ocean-atmosphere system, the deep ocean and its sedimentary interface, ocean chemistry, the carbon cycle, the terrestrial and marine ecosystems,
and so forth. The whole Earth participates in the dynamics of ice ages in a complex fashion, and its components are tied together through a dense network of feedbacks. In particular, the atmospheric concentration of CO2 and the existence of climatic thresholds appear to have a funda- mental role in the glacial-interglacial cycles. In the current context of anthropogenic global warming, the understand- ing of the dynamics of ice ages, the largest recent changes in the climate system, is becoming a key scientific issue.
In section 2 I will briefly mention some important historic milestones in the discovery of ice ages and then present, in more detail, the astronomical theory and some simple conceptual models. In section 2.4 I will discuss how new observational and conceptual advances may help define a new paradigm for glacial cycles that
could solve the traditional difficulties associated with
classical astronomical theory.
2. ASTRONOMICAL THEORY OF PALEOCLIMATES
2.1. From Geology, to Astronomy, to Geochemistry The idea that the Earth experienced severe glacia- tions in the past originates at the beginning of the
Copyright 2001 by the American Geophysical Union.
8755-1209/01/2000RG000091 $15.00
ß 325 ß
Reviews of Geophysics, 39, 3 / August 2001 pages 325-346 Paper number 2000RG000091
326 ß Paillard: GLACIAL CYCLES 39, 3 / REVIEWS OF GEOPHYSICS
nineteenth century. Agassiz [1838] was among the first to recognize that glaciation was the most natural explana- tion for the erratic boulders, moraines, and deeply scratched bedrocks that could be found in many places in the Alps, Scotland, and North America. Though sev- eral others had suggested major glacial advances before, Agassiz widely promoted the idea of an ice age and started a scientific debate that lasted more than 30 years. A few years after Agassiz, Adh•mar [1842] suggested that the orbital variations of the Earth could be respon- sible for climatic changes. Adh6mar's theory was based on the known precession of the equinox and suggested that glaciations were caused by the change in the lengths of the seasons. Glaciations, caused by longer winters, would thus occur every 23 kyr in the Northern Hemi- sphere, with ice ages occurring in the Southern Hemi- sphere in opposite phase, as shown by the current pres- ence of the Antarctic Ice Sheet. This theory was rapidly proved to be incorrect since the annual mean solar heating at the top of the atmosphere does not change with precession. Nevertheless, the idea of cyclic glacia- tions forced by the Earth's orbital changes was taken further by Croll [1875], who elaborated the first astro- nomical theory of paleoclimate. Croll hypothesized that precessional forcing, though only seasonal, might be crucial and that winter insolation might be critical. Colder winters would produce larger areas covered with snow, which could lead to glacial age because of the snow albedo feedback. He also showed the importance of the modulation by the 100-kyr eccentricity changes for this precessional forcing. He further hypothesized that the changing tilt of the Earth should play a role, and being aware that the astronomical forcing is small, he tried to find some internal amplifying mechanisms in the
ocean circulation.
Interest in an astronomical theory of glacial cycles
was renewed with the work of M. Milankovitch between
1920 and 1941 [Milankovitch, 1941], in which he com- puted the solar radiation at the top of the atmosphere for different latitudes, taking into account the changes in eccentricity, precession, and tilt of the Earth. In contrast to Croll's theory, Milankovitch argued that the summer season was critical. Colder summers enable the persis- tence throughout the year of snowfields in some high- latitude regions, leading to a net accumulation of ice and to the building of ice sheets (Figure 1). The Milanko- vitch theory predicted that the climatic cyclicity should be mainly at 23 kyr, because of precession, and at 41 kyr because of obliquity (or tilt) changes.
The first continuous records of the ice ages from marine sediment cores came in the 1950s [Arrh•nius, 1952; Ericson et al., 1956], and Emiliani [1955] provided the first record of the isotopic composition of fossil shells of foraminifers in these cores. For the first time, cyclicity was demonstrated, and Emiliani assigned each individual cycle a "marine isotopic stage number." Shackleton [1967] and Duplessy et al. [1970] suggested that most of Emiliani's signal was caused by ice volume
changes, not by temperature changes. With the study of foraminiferal assemblages in marine sediment cores, Im- brie and Kipp [1971] could confirm these results and provide quantitative estimates of the glacial-interglacial temperature changes. Dating methods based on the ra- dioisotopes of uranium, thorium, and potassium were also developed at this time. When applied to fossil coral reefs [Broecker, 1966; Broecker et al., 1968], as well as to magnetic reversals [Cox et al., 1963, 1964], a cyclicity of 100 kyr was clearly demonstrated [Broecker and van Donk, 1970; Hays et al., 1969; Kukla, 1975]. However, the Milankovitch theory stated that the main cycles should be at 23 and 41 kyr. Careful spectral analysis of marine
sediment cores led to the clear confirmation of the
astronomical theory. Indeed, besides the 100-kyr cycle, three other cycles could be identified: 41, 23, and 19 kyr [Hays et al., 1976]. The computations of the astronomical time series were now made easier with the help of computers, and Vemekar [1972] and Berger [1977, 1978] showed that the precession frequency is split into a 23-kyr and a 19-kyr cycle. Ice age cycles are therefore undoubtedly linked in some fashion to Earth's orbital
variations.
2.2. Orbital Forcing
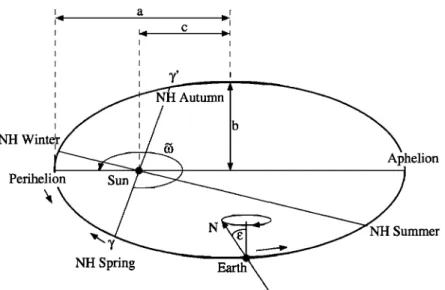
According to Kepler's laws, the Earth's orbit around the Sun is an ellipse, and one of its two foci is roughly the Sun. This orbit is also influenced by the motion of the other planets of the solar system. Among the geometri- cal characteristics of the Earth's orbit, only two have an influence on the solar heating received by the Earth: the ellipse semimajor axis a, which measures the size of the ellipse, and its eccentricity e (defined as e = c/a, where c is the distance from focus to center), which measures its elongation (Figure 2). There is no theoretical or experimental reason to think that a has changed in the past. In contrast, the eccentricity e changes significantly with 100-kyr, 400-kyr, and 2-Myr periodicities. When the eccentricity is large, the ellipse is more elongated, the annual mean Earth-Sun distance is slightly smaller, and the energy captured by the Earth is increased. The global mean annual solar radiation received by Earth is
S So
W'•
= 4X/1
- e2- 4'
where S is the solar radiation received at a distance a
from the Sun (S depends only on solar activity) and So, improperly defined as the "solar constant," also changes with the eccentricity. The variations in W.• are very small, as illustrated in Figure 3, and they cannot be directly responsible for the 100-kyr cycles observed in the paleoclimatic records.
However, the Earth is not a point. It is also not exactly a sphere, and the Sun and the Moon exert a torque on its equatorial bulge. This leads to a precession of the Earth's axis and to quasi-periodic changes in its tilt, or obliquity, œ (Figure 2). This obliquity defines the location
z
long NH winters (NH glaciations)
long SH winters (SH glaciations)
cold NH winters (NH
Interglacial epoch
cold SH winters (SH • clarions) Glacial epoch
coM
NH
summ%s
(NH
glacialions)
,
100
200
Time (kyr BP) Adh6mar's model Croll's model Milankovitch's modelFigure 1. The ice ages according to Adh•mar [1842], Croll [1875], and Milankovitch [1941]. Adh6mar was aware only of the precession of equinoxes, and he related the glacial ages to the lengths of the seasons. Croll benefited from the advances in astronomy and was aware of changes in the other astronomical parameters, though he could not compute the obliquity changes. In his view, the interglacial epoch is associated with small eccentricity and therefore with small precessional changes. Milankovitch was the first to integrate the effect of all astronomical parameters and to compute explicitly the insolation at the top of the atmosphere. He understood that summer, not winter, was the critical season. His insolation minima were associated with the major alpine glacier advances recorded by geological evidence.
of the tropics
and the polar circles,
and changes
in it will
clearly have some climatic effect. When the obliquity increases, the poles receive more solar energy in summer
but stay in the polar night during winter. The annual
mean insolation therefore increases symmetrically at the
poles and decreases
at the equator, since the global
Earth annual mean WA does not depend on e (see
above). In contrast
to eccentricity
changes,
obliquity
variations have a substantial effect on the local annual
mean
insolation
of several
W m -2 (Figure
4).
The precession of the Earth's axis moves the vernal
point • (see Figure 2) with a quasi-period
of 25,700
years. This is the well-known
precession
of the equi-
noxes. However, for climatic purposes, only the motion of • relative to the perihelion is of interest. This is the
climatic
precession,
measured
by the & angle.
More
precisely, it is usual to define the precessional parameter e sin &, which combines the climatic precession and the eccentricity. In particular, when e = 0, the perihelion is undefined and the precessional parameter e sin & van-
328 ß Paillard' GLACIAL CYCLES 39, 3 / REVIEWS OF GEOPHYSICS a i NH '
Wlnt
•,
Aphelion
Perihe•$n
S
mmerNH
Spring Earth•x•
Figure 2. The orbital parameters of the Earth. Eccentricity e is defined as e = c/a, where a is the semimajor axis and c is the distance between the focus and the center of the ellipse. The semiminor axis b is then given
by Pythagoras's theorem (a 2 = b 2 + c 2, which gives b = aX/1 - e2). The current eccentricity value is e =
0.0167, which means that the Earth's orbit is very close to a circle. The tilt of the Earth's axis with respect to the orbital plane is the obliquity œ (current value is œ = 23.44ø). This tilt implies that the Earth equatorial plane intersects with its orbital plane, the intersection defining the •/•/' line and the position of equinoxes and solstices. In the current configuration the Earth is closest to the Sun (perihelion) around January 3, just a few weeks after the Northern Hemisphere winter. This position, relative to the vernal equinox % is measured by the & angle.
ishes. In other words, when the Earth orbit is circular, there is no climatic effect associated with precessional changes. As can be seen in Figure 5, seasonal insolation changes are of the order of 10-20%. They are antisym- metric with respect to seasons and hemispheres. The insolation excess (deficit) received in summer is com- pensated by the deficit (excess) in winter, and the inso- lation excess (deficit) received in the Northern Hemi- sphere is compensated by the deficit (excess) in the Southern Hemisphere. Definition of the precessional parameter is not universal, and e sin (-rr + &), which only changes the sign of the precessional parameter, is widely used [cf. Berger, 1978].
A subtle detail in the astronomical forcing follows from Kepler's second law. The amount of energy re- ceived at a given latitude and between two given orbital positions measured from •/ (for example, between the summer solstice and the autumnal equinox) does not depend on the climatic precession &. However, the time necessary for the Earth to move between these two orbital positions (for example, the length of the summer season) does change with climatic precession. The inso- lation, defined as the amount of energy received per unit time, therefore changes with climatic precession, but only through the lengths of the seasons. In some sense, Adh•mar was right' It is indeed the changing speed of the Earth, and therefore the lengths of the seasons, that provides the main orbital forcing for glacial-interglacial cycles. In the present-day configuration, summer occurs near the aphelion, where the Earth moves slower and, for the same total amount of incoming solar energy,
summer is longer and therefore cooler. According to Milankovitch's ideas, this situation favors the start of a glaciation.
The computation of the insolation time series is now easier with the help of computers, but a major intrinsic difficulty is the strongly nonlinear character of the ce- lestial mechanical equations for the solar system. The solar system is, in fact, chaotic [Laskar, 1989], and a precise computation of the eccentricity e is impossible beyond a few tens of millions of years. The situation for the obliquity œ and precession & is even worse, since their evolution depends on the exact shape of the Earth and its possible changes induced by glaciations or inner mantle convection [Laskar et al., 1993; Forte and Mitrovica, 1997]. The precise computation of the insola- tion series beyond a few million years is therefore un- certain [Laskar, 1999]. Still, the main frequencies in orbital forcing were present in the remote geological past, and it is possible to build timescales up to several tens of millions of years [Shackleton, 1999].
2.3. Successes and Pitfalls of Astronomical Theory Numerous records of past environmental changes ob- tained in the last 20 years largely confirm the link be- tween insolation forcing and climate. A proxy for global ice volume, or sea level, is the isotopic composition of the oxygen in the carbonate from fossil foraminifera shells obtained from marine sediment cores. The spec- tral mapping and prediction (SPECMAP) record [Imbrie et al., 1984] (Figure 6) is often used as a stratigraphic
using marine cores in regions close to the fleezing point (so that glacial temperatures cannot be much colder
than at present
time),
the global
change
in marine
8•SO
can be estimated to be -1.0-1.1%o [Labeyrie et al., 1987]. This is confirmed by other methods [Schrag et al., 1996]. Since the oceanic mean depth is -4 km and the mean isotopic composition of the large ice sheets present at the glacial maximum was about -30 to -35%0 [Jouzel et al., 1994], the calculated sea level drop was of the order 115-135 rn (4 km x 1.0%o/30%o). A more direct estimate of 120 rn is obtained by fossil coral terraces [Chappell and Shackleton, 1986]. This implies an
ice sheet
volume
-45 x 10
6 km
3 larger
than
the volume
of today. This ice was located mainly in the Northern Hemisphere, over Canada (the Laurentide ice sheet) and Scandinavia (the Fennoscandian ice sheet). Postgla- cial rebound in these regions, measured by historical sea
level records and fossil shorelines or coral reefs terraces
records [Fairbanks, 1989], is used to estimate more pre- cisely the evolution of the height and shape of these ice sheets [Peltlet, 1994].
Spectral analysis of marine isotopic records (Figure 6) clearly reveals the characteristic astronomical frequen- cies. (The timescale for these records has usually been tuned to the astronomical forcing. Nevertheless, the same frequencies appear, though with smaller ampli- tude, using only the Brunhes/Matuyama magnetic rever- sal, dated with K/Ar methods, as a stratigraphic point.) In Figure 7a, the SPECMAP record is filtered in the 23-kyr precessional band and compared with the preces- sional forcing. It is remarkable that both time series have a quite similar modulation of their amplitude. This is probably one of the strongest arguments in favor of a simple causal relationship between the precessional forcing and the climatic response in this frequency band. Indeed, in contrast to other techniques, amplitude mod- ulation is not affected by tuning [Shackleton et al., 1995]. It is also remarkable that the relative amplitude of the 23-kyr and 19-kyr periodicities evolved during the last million years in a very similar fashion both in the forcing and in the paleoclimatic record. The climatic response in the 41-kyr frequency band is also almost linear, as illus- trated in Figure 7b for the Ocean Drilling Program (ODP) 659 record [Tiedemann et al., 1994]. All these observations strongly argue for a simple connection be- tween climate and the insolation forcing in the preces- sion and obliquity bands limbtie et al., 1992].
The main glacial-interglacial periodicity is the 100-kyr cycle for which there is no direct connection with the eccentricity forcing [Imbrie et al., 1993] (Figure 6). In particular, this 100-kyr cyclicity is considerably smaller before -0.8 Ma, where climatic variability is dominated by the 41-kyr periodicity [Pisias and Moore, 1981; Start and Prell, 1984]. Furthermore, the 100-kyr cyclicity is not
so well defined, as is illustrated in Table 1, since the time
between two terminations varies between 85 and -120
kyr. In contrast to the precessional and obliquity bands, it is therefore impossible to find a simple linear relation-
0.06 (a) • 0.04
'i 0.02'
Eccentricity e 343.1342.9
342.7 .... 342.5 0 200 400 600 800 1000 Time (kyr BP) (b) 412 kyr 95 kyrII 123
kyr
A
99
ky
2Myr
1;1
ky••
0 0.005 0.01 0.015 Frequency (cycle/kyr)Figure 3. (a) Changes in eccentricity e for the last million years and its small effect on the global annual mean insolation received by the Earth (assuming a constant solar activity). (b) Spectral analysis of the eccentricity changes, revealing major periodicities at -400 kyr and in the 100-kyr band (arbitrary vertical linear scale).
ship with the forcing for the 100-kyr periodicity. Further- more, the major periodicity of eccentricity changes is 400 kyr (see Figure 3), but such cyclicity is absent, or very weak, in most paleoclimatic records. Some more com- plex nonlinear relationships have been suggested be- tween climate and this 400-kyr periodicity (frequency modulation [Rial, 1999]), and some deep-sea dissolution records also exhibit cyclicity that could be related to the 400-kyr periodicity [Bassinot et al., 1994a]. Clearly, the presence in climatic records of a strong 100-kyr period- icity, without any obvious 400-kyr periodicity, is one of the major difficulties for classical Milankovitch theory. A closely related question is the "stage 11 problem." When the Earth's orbit is almost circular, the seasonal insolation changes due to precession are very small, and such a situation occurs at -400 ka B.P. (Figure 5). In contrast to Milankovitch theory, the recorded climatic changes at 400 ka B.P. are not weak. On the contrary,
330 ß Paillard: GLACIAL CYCLES 39, 3 / REVIEWS OF GEOPHYSICS • (a) • 25 • 24 • 23 • 22
420-
415410
Mean annual insolation at the equator0
2;0
4;0
6;0
8;0
1000 Time (kyr BP) 180 •'175
•
170 • 165 =(b)
41.0
kyr
. 0 0.01 0.02 0.03 0.04 0.05 Frequency (cycle/kyr)Figure 4. (a) Changes in obliquity œ for the last million years and the annual mean insolation received at the poles and at the equator. (b) Spectral analysis of the obliquity changes, revealing one major periodicity at 41 kyr (arbitrary vertical linear scale).
the glacial-interglacial transition between isotopic stages 12 and 11 is documented as probably the largest transi- tion, both in isotopic records (see Figure 6) and in other sea level proxies. A recent estimate of sea level for stage 12 is -140 rn below the present-day level [Rohling et al., 1998] and +20 rn for stage 11 [Kindlet and Hearty, 2000]. This obviously raises the question of which ice sheets grew and melted at that time [Chappell, 1998; Cuffey and Marshall, 2000; Scherer et al., 1998]. Stage 11 appears to be longer than the other interglacials, as illustrated by the Southern Ocean sea surface temperatures given in Figure 8. It is also a time of massive coral reef buildup [Droxler, 2000] and maximum deep-ocean carbonate dis- solution [Farrell and Prell, 1989; Bassinot et al., 1994a]. Knowing that the present and future eccentricity is also very small (see Figure 3), we see that all these peculiar- ities make stage 11 particularly interesting for the future of the Earth's climate [Howard, 1997; Droxler, 2000].
A symmetrical problem occurs for stage 7. Indeed, it is a period of maximum eccentricity and therefore a time
of maximum seasonal forcing. However, instead of a well-marked interglacial, stage 7 looks more like a mild glacial episode. A particularly intriguing question con- cerns the apparent decoupling of the maximum preces- sional forcing (which occurs at stage 7.3), the maximum temperature (which happens in many locations at stage
7.5), and the minimum
ice volume
(which
seems
to occur
at stage 7.1 (see Figure 8) or stage 7.3 [Martinson et al., 1987], depending on isotopic curves. All these observa- tions clearly point to a serious deficiency in classic Mi- lankovitch theory.
Some have suggested that the "apparent" 100-kyr cyclicity looks similar to a red noise process [Kominz and Pisias, 1979] or could be explained by stochastic reso- nance (random processes, together with the weak eccen- tricity changes, could switch climate from glacial to in- terglacial [see, e.g., Benzi et al. [1982]). However, one feature of the Vostok record is the similarity of stages 5 and 9. A natural explanation can be found in the astro- nomical forcing. Indeed, both the eccentricity and the
(a) 0.06 • 0.04 • 0.02 '• 0 • -0.02 a, -0.04 -0.06 550
500
450 400 350Precessional parameter e ' •
.Summer
solstice
insolation
at
90ø•!
•Summer solstice insolation at 45øN•
I 200 400 600 800 1000 Time (kyr BP)
600
•
550 g 500 z (b) I 0.03 23.7 kyr . kyr kyr I I I 0.04 0.05 0.06 Frequency (cycle/kyr)Figure
5. (a) Changes
in the precessional
parameter
e sin • for the last
million
years
and
the seasonal
insolation received at different northern latitudes. (b) Spectral analysis of the precessional parameter changes,
revealing
two
groups
of periodicities,
around
23 and
19 kyr (arbitrary
vertical
linear
scale).
phasing
between
obliquity
changes
and precessional
changes
are almost
identical
at these two periods
of
time. This looks like a clear demonstration that theEarth's
system
is, in fact, strongly
deterministic.
2.4. Conceptual
Models
of Glacial
Cycles
'In the nineteenth century and at the beginning of the
twentieth
century,
computation
of the variations
of the
Earth's orbital elements was a critical problem [see, e.g.,
Berger,
1988].
Similarly,
until advances
in geochemistry
in the 1960s,
reliable
quantitative
and well-dated
proxies
of past climatic
changes
were almost
nonexistent.
If
these
two problems
have
been in large part addressed,
we are now confronted with another tremendous chal-
lenge:
the modeling
of the Earth's
system.
A successful
model of glacial-interglacial
cycles
(the largest
recent
and well-documented
global changes)
will be a crucial
milestone in the understanding of the complex interac- tions of the many components of our planet. We are,
unfortunately,
quite far from achieving
this objective.
Up to the present,
models
of glacial-interglacial
cycles
have been limited, most of the time, to the modeling of the evolution of ice sheets. It is beyond the scope of this
paper
to make
an exhaustive
review
of all the efforts
that
have been performed
in this domain,
and I will only
332 ß Paillard: GLACIAL CYCLES 39, 3 / REVIEWS OF GEOPHYSICS -0.4 - -0.2 - 0- 0.2- 0.4- 0.6- 0.8- 0
Specmap
Stack 6•aO
i i i I
200 400 600 800
Time (kyr BP)
a
Spectral power estimation with b
the Blackman-Tukey method 100 _+ 30 kyr
•
_+
8
kyr
23 _+ 3 kyr
2 kyr
•error
(80% level)estimate
Spectral power estimation with
97•5 _+ 3 kyr the Multitaper method
41.0
_+
1
kyr 19.0
ñ
03
kyr
t ß _ 11.7 ñ 0•2 kyr 0.999 ' 0.998 - 0.997 0.996 0.995 0 0.01 0.02 0.03 0.04 0.05 0.06 0.07 0.08 0.09 0.1Frequency (cycles per 1000 years)
Figure 6. (a) The spectral mapping and prediction (SPECMAP) record [Imbrie et al., 1984]. (b) Spectral analysis of SPECMAP using the standard Blackman-Tukey method. (c) The same analysis with the multitaper method. In Figures 6b and 6c the astronomical frequencies are clearly visible. The first harmonic of the precessional frequency is also detected by the multitaper method.
Following Milankovitch (summer insolation at high northern latitudes is responsible for the glacial-intergla- cial cycles), many conceptual models have tried to de- duce ice volume changes from the summer insolation at 65øN. Calder [1974] simply states that below a given level of insolation, the ice sheets are growing, while above this level they are shrinking. The equation is
dV
dt = -k(i - io),
with t being time, k = k M if the insolation i is larger than i 0 (melting), and k = kA otherwise (accumulation of ice). In addition, the ice volume V is constrained to remain positive. The result is plotted in Figure 9, and the comparison with the data is quite poor. The precessional response is much too strong and the model comes back
to an interglacial stage almost every 23 kyr. Neverthe- less, this crude model predicts correctly all the major terminations, for the last 0.8 Myr. Note that in 1974 the timing of these transitions was still poorly known, since
the SPECMAP work and the calibration of timescales
onto the precessional forcing started only around 1980. A posteriori, Calder's model succeeds where many other models are still failing. The main drawback of Calder's model is its lack of structural stability: Any small changes in the input parameters i 0, kM, or kA will lead to very different, unrealistic results. This can be easily under- stood from the equation above. Indeed, the ice volume V is just the integral of relative insolation changes, and any small changes in parameters will induce an unrealistic growth in V.
(a) 1
••o
0.5
0-1
o
1•)o
3•0 4•0 5•0 6•0 7•0 8•0
Time (kyr BP) 0.04 0.02o
-0.02 -0.04900
(b)• 0.4
0.2 • -0.4 ! i ! i ! ! ! ! 0 500 - 25 1000 1500 2000 2500 3000 3500 4000 4500 5000 Time (kyr BP)Figure
7. (a) The SPECMAP
record
[Imbrie
et al., 1984]
(dashed
curve)
and
the Bassinot
et al. [1994b]
record
(bold
curve)
are
filtered
in the 23-kyr
band
and
compared
with
the precessional
parameter.
(b) The
5-Myr
long
Ocean
Drilling
Program
(ODP)
659
gx80
record
[Tiedemann
et al., 1994]
is filtered
in the 41-kyr
band
and
compared
with
obliquity.
The amplitude
modulation
of both
the 23-kyr
and
the 41-kyr
cyclicity
appears
very
similar
in the
astronomical
forcing
and
in the
paleoclimatic
record.
This
is probably
the
strongest
argument
in favor
of a simple
quasi-linear
relationship
between
the
climatic
system
and
insolation
forcing
in
these two frequency bands.
Imbrie
[1980].
The equation
is written,
in dimensionless
form, asdV (i- V)
dt ß
where, = %u if V > i (melting)
and, = %4 otherwise
(accumulation
of ice). In other
words,
the ice volume
is
simply
relaxed
to the forcing,
with a different
time con-
stant,
depending
on the sign
of ice volume
changes.
In
order to work properly
the accumulation
time constant
%4 needs
to be smaller
than the melting
time constant
•'3•,
which
is contradictory
to the often noted
idea that
glacial
cycles
are characterized
by slow accumulation
and rapid
melting
of the ice sheets.
The results
(Figure
10) show
a fairly good
agreement
with the data for the
last cycle but a poor agreement
for other cycles.
In
particular,
there is a strong
400-kyr
cyclicity,
without
a
clear 100-kyr
cyclicity.
This leads
to very small ice vol-
ume changes
during termination
V. This is another
illustration
of the "stage 11 problem." Though quite
imperfect,
the Imbrie
and Imbrie
[1980]
model
has
some-
times been used to establish the age scale of paleocli-
matic records
[e.g.,
Bassinot
et al., 1994b],
but the exact
fashion
by which
the record
is "tuned"
to the astronom-
ical forcing
does not significantly
change
the results,
within a "precessional
phasing
uncertainty"
of a few
thousands
of years [Martinson
et al., 1987].
In order to address the 100-kyr problem, several
models
with long
internal
time constants
have
been
built.
For example,
the isostatic
response
of the bedrock
under
the weight
of the ice sheets
was used to explain
the
apparent
asymmetry
of the 100-kyr
cycles,
with a slow
buildup of ice and a rapid deglaciation
[Oerlermans,
1982].
Indeed,
the summit
of a large
ice sheet
will easily
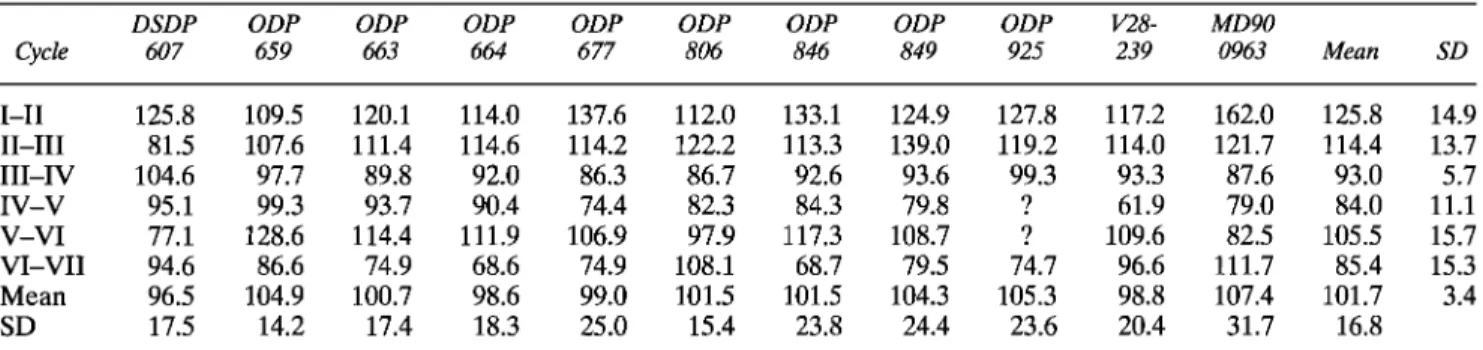
334 ß Paillard' GLACIAL CYCLES 39, 3 / REVIEWS OF GEOPHYSICS TABLE 1. Lengths of the Last Six Glacial Cycles, Measured From Termination to Termination (Glacial-Interglacial Transitions) a
DSDP ODP ODP ODP ODP ODP ODP ODP ODP V28- MD90
Cycle 607 659 663 664 677 806 846 849 925 239 0963 Mean SD I-II 125.8 109.5 120.1 114.0 137.6 112.0 133.1 124.9 127.8 117.2 162.0 125.8 14.9 II-III 81.5 107.6 111.4 114.6 114.2 122.2 113.3 139.0 119.2 114.0 121.7 114.4 13.7 III-IV 104.6 97.7 89.8 92.0 86.3 86.7 92.6 93.6 99.3 93.3 87.6 93.0 5.7 IV-V 95.1 99.3 93.7 90.4 74.4 82.3 84.3 79.8 ? 61.9 79.0 84.0 11.1 V-VI 77.1 128.6 114.4 111.9 106.9 97.9 117.3 108.7 ? 109.6 82.5 105.5 15.7 VI-VII 94.6 86.6 74.9 68.6 74.9 108.1 68.7 79.5 74.7 96.6 111.7 85.4 15.3 Mean 96.5 104.9 100.7 98.6 99.0 101.5 101.5 104.3 105.3 98.8 107.4 101.7 3.4 SD 17.5 14.2 17.4 18.3 25.0 15.4 23.8 24.4 23.6 20.4 31.7 16.8
aThe timescale of each record was established assuming a constant sedimentation rate between termination I (fixed at 13.5 ka) and the Brunhes-Matuyama magnetic reversal (fixed at 772.2 ka). It is interesting to note that the standard deviation of the cycle lengths is larger for a given record than for a given cycle. In other words, for each record the mean duration is indeed -100 kyr, but with quite a large dispersion, whereas for a given cycle the mean duration is variable, but with a significantly smaller dispersion. A natural conclusion is that the cycle length indeed varies from -85 to -120 kyr. Abbreviations are DSDP, Deep Sea Drilling Project; ODP, Ocean Drilling Project. From Raymo [1997].
culminate at ---3 km, with the bedrock below the ice lowered by ---1 km. Since Earth's mantle viscosity is quite large, there is a several thousand year delay between loading of the ice and reorganization of topography [Peltier, 1994]. The buildup of the ice sheet will thus be hampered by the still high altitudes of the growing ice sheet, while the melting will become easier because of the depressed altitude of a shrinking ice' sheet. Still, a time constant of 50-100 kyr is difficult, or almost impos- sible, to explain with such mechanisms. Another ap- proach was to look at the rapid, millennial-scale, internal variability of the climate system as a potential source for longer timescale variability, by the nonlinear combina- tion of frequencies [Ghil and Le Treut, 1981; Le Treut and Ghil, 1983]. This is certainly a promising approach, and millennial-scale variability, as outlined in section 3.1, probably has a crucial role in the problem of glacial- interglacial cycles.
The conceptual models described above illustrate some key mechanisms. More complex models have been used, with more realistic representations of the physics at work in the system, but also with larger sets of tunable parameters. Some energy balance models, coupled to simplified ice sheet models, have had some successes in reproducing the glacial-interglacial cycles [e.g., Pollard, 1983; Tarasoy and Peltier, 1997]. The Louvain-la-Neuve two-dimensional climate model (LLN-2D) [Gall•e et al., 1991], which couples a zonally averaged atmosphere with an ice sheet model, has been used extensively to investigate this problem in detail [see, e.g., Berger et al., 1999]. In contrast to these Earth models of intermediate complexity (EMICs), general circulation models (GCMs) are much too expensive in computer time to simulate climate over such long timescales. They have nevertheless been used for specific time periods, like the Last Glacial Maximum, in order to assess their ability to simulate very different climates, in particular within the Paleoclimate Modeling Intercomparison Project (PMIP) exercise [e.g., Pinot et al., 1999; Kageyama et al., 2001].
3. ABRUPTNESS OF CLIMATIC CHANGES
3.1. From Catastrophism, to Gradualism, to Abrupt Events
In the early nineteenth century the Earth's history was understood as a succession of cataclysmic events, with the Great Flood from the Old Testament being but the last one. Agassiz's statement that the ice age "must have led to the destruction of all organic life at the Earth's surface" was certainly in full agreement with this dominant catastrophism. It is interesting to note how geological philosophy has since been changed to gradu- alism: Geological changes must be very slow and grad- ual. The above dramatic statement from Agassiz would now be taken as a serious drawback of the theory, as illustrated in the context of the current controversy on the "snowball Earth theory," which suggests the occur- rence of a fully glaciated Earth just before the Cambrian life explosion [Hoffman et al., 1998]. The idea that gla- cial-interglacial cycles are a slow response of the climate system to slow insolation changes is therefore still wide- spread. Indeed, the original theory states that small insolation changes will induce slight changes in perma- nent snow and ice cover areas, which will induce further temperature changes because of the high albedo of ice.
This ice albedo feedback was assumed to be the main
amplifying mechanism. Since ice sheet changes are oc- curring only on the several thousand year timescale, climate variations should be very slow. However, new paleoclimatic data do not fit into the classical gradualism
scheme.
The last 10 years are marked by the discovery of widespread sub-Milankovitch variability in climate. The first clear indicators of such millennial-scale changes came from ice records in Greenland [Dansgaard et al., 1982, 1993]. These climatic warm excursions in glacial times have a typical duration of---1000-3000 years (Dansgaard-Oeschger events). In marine sediments from the North Atlantic, abrupt events corresponding to
Marine isotopic stage numbers
-2¸ ø•=
12-
:.
300
280
260
sto•
•
z4o
co
220
ZOO
I
.
0 100 200 300 400 S00 Age (kyr BP)Figure
8. An illustration
of the
pitfalls
of the
Milankovitch
theory.
Topmost
curve
is the
summer
solstice
insolation
at 65øN,
normalized
to zero
mean
and
unit
variance
[Laskar
et al., 1993].
According
to classical
Milankovitch
theory
this
represents
the
main
external
forcing.
Next
curve
is the
global
ice
volume
estimated
by the
isotopic
composition
of foraminifera
shells
[Bassinot
et al., 1994b].
Next
curve
is a Southern
Ocean
temperature
record
from
the
record
RCl1-120
[Hays
et al., 1976].
Next
curve
is air temperature
difference
from
the
present
over
Antarctica,
estimated
by
the
isotopic
composition
of the
ice
[Petit
et al., 1999].
Bottom
curve
is atmospheric
concentration
of CO2
from
the
Vostok
record
[Petit
et al., 1999].
It must
be emphasized
that
each
record
has
its own
independent
timescale
and
that
the
precise
relative
chronology
of events,
within
"precessional
phasing
uncertainty,"
is certainly
unrealistic.
The
last
climate
cycle
(the
last
120
kyr)
is quite
simple
and
correlates
well
with
the
forcing.
During
stage
11,
forcing
is
small
and
the
climatic
response
is large.
During
stage
7 the
maxima
of forcing,
temperature,
and
minima
of ice
volume
are
not
simultaneous.
At the
first
precessional
cycle
(stage
7.5)
the
temperatures
are
maximum
in the
Southern
Hemisphere,
as
well
as
in
many
other
places.
The
second
precessional
cycle
(stage
7.3)
corresponds
to the
strongest
seasonal
forcing.
In
this
isotopic
record
the
minimum
ice
volume
appears
to happen
at the
last
precessional
cycle
(stage
7.1).
massive
iceberg
discharges
were also discovered
[Hein-
rich, 1988;
Bond et al., 1992].
These Heinrich events
are
observed between 40øN and 55øN, from the Labrador
Sea
to the margins
of Portugal.
A correlation
with Dans-
gaard-Oeschger
events
was established
[Bond
et al.,
1993],
with each Heinrich
event associated
with the
coldest
phase
of a group
of several
Dansgaard-Oeschger
events
(Figure
11). This millennial-scale
variability
has
now been found in many different locations
and is
clearly
a global-scale
phenomenon.
The most
impressive
feature
of these
changes
is the abruptness
of the associ-
ated climate
changes
above
Greenland.
Indeed,
the tran-
sition from cold to warm occurs within only a few de-
336 ß Paillard: GLACIAL CYCLES 39 3 /REVIEWS OF GEOPHYSICS 0 100 200 300 400 5•)0 6•)0 700 800 900 lOOO Time (kyr BP) 100
o
o.•1
100 kyr:•:
41 kyr
23 kyr
.:;"h19kyr
½
itnation 0.02 0.03 0.04 0.05 0.06 0.07 Frequency (cycles per kyr)Figure 9. Results from the Calder [1974] model. The threshold i o is equal to 502 W m -2, and the ratio kA/k M is chosen equal to 0.22. The forcing i is the summer solstice insolation at 65øN [Laskar, 1990]. The result is very sensitive to these choices. The agreement with the record is quite poor, but this crude model still predicts the major transitions at the right time, a feature that many, more sophisticated models do not reproduce well. An isotopic record is given here for comparison [Bassinot et al., 1994b].
amplitude is about half a full glacial-interglacial change [Severinghaus et al., 1998; Jouzel, 1999]. Similar records clearly demonstrate this abruptness in Europe [von Grafenstein et al., 1999] and in the tropical Atlantic [Hughen et al., 1996].
Most of the temperature change associated with the last deglaciation in Greenland is just but one among these Dansgaard-Oeschger abrupt warming events. Such rapid changes are observed at each glacial-interglacial transition in the methane record from Vostok [Petit et al., 1999]. This highlights the close connection between sub-Milankovitch variability and glacial-interglacial cy- cles. Similarly, deep-ocean chemistry in the North At- lantic also appears to change abruptly, in association with both the last glacial inception [Adkins et al., 1997] and the last deglaciation [Adkins et al., 1998]. All these observations reveal one of the weak points in classical Milankovitch theory. Temperature, and more generally the whole ocean-atmosphere system, can change, and did change, much faster than did the global ice volume. Actually, the slow changes in the insolation forcing and the huge inertia of the ice sheets at glacial times do not imply slow climatic change, even in the context of astro- nomical theory.
Heinrich events are catastrophic releases of icebergs
in the North Atlantic from the Laurentide and Fen-
noscandian ice sheets. How large their effect is on global ice volume and sea level is still a matter of debate, but the possibility that it may be significant does exist. Sim- ilarly, the abruptness of the Dansgaard-Oeschger events may affect considerably the mass balance of the large Northern Hemisphere ice sheets. In both cases, these are clues that the ice sheets themselves may be quite reactive in the climate system. The Antarctic Ice Sheet seems also much more unstable in glacial time than previously suspected [Kanfoush et al., 2000]. A clear possibility is that the traditional SPECMAP curve in Figure 6 is only a smoothed version of what happened in reality to sea level. The fact that high sea level stands recorded by coral reefs are systematically above the estimations from isotopic records during glacial times [Chappell and Shackleton, 1986; Balbon, 2000] may also be an indication of a greater frequency of sea level changes. We still have no estimation of the rapidity and amplitude of such eventual rapid sea level variations. Still, to some extent, the possibility for rather abrupt changes exists not only for the ocean-atmosphere sys- tem, but also for the ice sheets themselves.
I
II
III
IV
V
VI
VII VIII
IX
• i •.:•:-• .?:.•v :.;•/ '/:7•.• ..o
300
soo
Time (kyr gP) 1000, 400 kyr 1 o41 kyr
23 kyr
.
..• l•yr
Tor
estimation
0.hi 0.b2 0.b3 0.b4 0.bs 0.0• 0.07
Frequency (cycles per kyr)
Figure 10. Same as Figure 9, but for the Imbrie model limbtie and Imbrie, 1980]. The forcing i is the summer solstice insolation at 65øN. The time constants are 'ra4 = 42 kyr and -r.q = 10 kyr.
3.2. "Decoupling" Ice Sheet and Temperature Changes
Beyond the abruptness of the recorded past environ- mental changes, the diversity among the different paleo- environmental records can also provide important clues. As illustrated in Figure 8, the most obvious feature of such a multiproxy comparison is the similarity between the different records. A much more interesting issue is the differences between them. As was already men- tioned in section 2.3, stage 11 and stage 7 are two
examples
where insolation
and ice volume
do not behave
in parallel, and during stage 7, ice volume and temper-
ature also seem to have different extrema. These differ-
ences emphasize the importance of looking at climate as a multidimensional dynamical system. In particular, tem- perature is not linked simply to ice volume. Temperature may change independently and abruptly, with leads or
lags
and with amplitudes
that do not necessarily
parallel
ice volume changes. In particular, there is a need to clearly define "glacial maxima" or "interglacial" as ex- trema either in the global ice volume, or in temperature, but not both at the same time, which is, unfortunately, common practice. For example, the Last Glacial Maxi-
mum (LGM), defined
as the maximum
volume of con-
tinental
ice (maximum
in benthic
foraminifera
•180),
occurs at ---21 ka B.P. between two much colder events,
Heinrich event 1 (17 ka B.P.) and Heinrich event 2 (23
ka B.P.). The LGM therefore
does
not correspond
to the
coldest conditions in the North Atlantic, and the mini-mal sea surface temperatures estimated by Climate: Long-Range Investigation, Mapping, and Prediction (CLI-
MAP) Project
Members
[1981] are often too cold to
represent
LGM conditions
[Sarnthein
et al., 1995]. Sim-
ilarly, it is misleading to call "deglaciation" the slow or
abrupt
warmings
observed
in the records
in association
with glacial-interglacial
cycles.
They may indeed not be
exactly
synchronous
with the melting
of continental
ice.
In Figure 8 it is clear that the terminations are sys- tematically associated with increases in temperature, at least in the Southern Hemisphere, and also with in- creases in the atmospheric CO2. On the contrary, as illustrated by stage 7, temperature maxima are not al- ways associated with minimal ice volume, or with maxi- mal Northern Hemisphere insolation. In other words, if the highest temperatures are inducing deglaciations, the ultimate cause for these temperature maxima probably cannot be found easily in the seasonal insolation forcing. A careful inspection of these curves in Figure 8 gives a
338 ß Paillard: GLACIAL CYCLES 39, 3 / REVIEWS OF GEOPHYSICS -33
-39
-41 -33 -:35 -37 -39 GRIP Byrd Vostok 7OO 600 5O0 4O0 300 0 5 10 15 20 25 30 35 40 45 50Age (kyr BP)
Figure 11. Climatic variability during glacial times from the Greenland and Antarctic ice cores. The precise correlation between these cores was possible through methane measurements [Blunier et al., 1998]. The full thermal amplitude between glacial and interglacial time is -20øC in Greenland (Greenland Ice Core Project (GRIP)) and -10øC in Antarctica (Byrd and Vostok). In Greenland, about half of this amplitude occurs abruptly at -14 ka B.P. The methane record is strongly correlated to the isotopic record, which reflects temperature changes. The Heinrich events (shaded bars labeled H1 to H5) correspond to the coldest episodes at GRIP and the warmest episodes in Antarctica.
crucial clue: The terminations are not associated with
the largest maxima in summer insolation but always
follow the smallest maxima in summer insolation
[Raymo, 1997; Paillard, 1998]. In other words, the small- est insolation maxima are favoring a major glaciation, which will then induce a rapid deglaciation, or termina- tion, at the next insolation maximum, independent of the insolation magnitude. This is precisely the idea that I followed when building a conceptual threshold model for the glacial-interglacial cycles [Paillard, 1998]. 3.3. Thresholds as an Integrating Concept
On the basis of the evidence of abrupt climatic changes and on the apparent "decoupling," at least for some episodes, of ice sheet and temperature variations, it is natural to elaborate a conceptual model able to switch abruptly between different climatic states, in re- lation to both astronomical forcing and ice sheet evolu- tion. The Paillard [1998] model assumes that climate has three different modes, or regimes, called i (interglacial), # (mild glacial), and G (full glacial). These climatic regimes have a (discrete) dynamics coupled to, but not strictly tied to, the slower evolution of the continental ice volume. In other words, climate is controlling ice sheet evolution, more than the opposite. The rules used to
switch from one mode to the other are illustrated in
Figure 12. The i --> # transition occurs when a threshold i 0 is crossed on the insolation forcing. The # --> G transition occurs when a threshold VM•.X is crossed on
insolation
i
ice volume•' m a x
G
Figure 12. The threshold model. Climate is assumed to have
three different regimes: i (interglacial), # (mild glacial), and G (full glacial). Transition between the regimes occurs when the insolation forcing crosses a given threshold i o or i•, or when the ice volume exceeds the value vMAX.
I II III IV V VI VII VIII IX I :• • •'• '• •.'"'-' ]; ! :::• •,' •:' ;:-• : ; 0 100 200 300 400 500 600 700 800 900 1000 Time (kyr BP) lOOO • lOO • lO 100 kyr 41 kyr 23 kyr
/e•
'
•..o.% :'"./• 19kyr
error estimation,
, , , , , , ,
0 0.01 0.02 0.03 0.04 0.05 0.06 0.07
Frequency (cycles per kyr)
Figure 13. Same as Figure 9, but for Paillard's [1998] model. Threshold values are i o Time constants are % = 10 kyr, 'rG = 're = 50 kyr, and 'rF = 25 kyr.
= -0.75 and i• = 0.
the ice volume. The G -• i transition occurs when a
threshold i• is crossed on the insolation forcing. For each mode the ice volume equation is linear:
dV (V•- V) F dt •R
where R is the current regime, volume V is relaxed to Va (equal to 0 if R - i, or equal to 1 if R - # or G), F is a slight truncation of the normalized summer insolation forcing, and •ra and •rv are the relaxation time constants. This model is robust with respect to changes in param- eter values. The results (Figure 13) compare well with the paleoclimatic record. In contrast to other simple models, ice volume is decoupled from temperature, ide- alized here as only three climatic states. In particular, the warmest episodes (i regimes) correspond to abrupt terminations and should be compared with the warm and high CO2 episodes recorded in the Antarctic Vostok record (Figure 8). In particular, all terminations are predicted at about the right time, up to precessional phasing uncertainty. At this point we understand why Calder's model (Figure 9) had such success in its timing
of terminations. Calder's model was good at predicting the glacial extremes associated with small insolation maxima. Just like Paillard's model, Calder's model was
also based on an insolation threshold mechanism that
requires that beyond a given value of the external forc- ing, the climate system behaves differently. This idea, though very crude in these conceptual models, appears to be crucial in the dynamics of glacial-interglacial cycles.
In addition to thresholds the Paillard model is also
based on multiple equilibria and hysteresis phenomena. In other words, once the threshold has been crossed, the
forcing needs to change substantially, and therefore the Earth's system needs a substantial amount of time in order to come back to the original state. This irrevers- ibility can be found in many components of the climate system, like the ocean thermohaline circulation [Rahm- storf, 1995], or more simply, in the ice sheet albedo feedbacks [Crowley and North, 1991].
To illustrate how this threshold concept affects the timing and shape of the next glacial cycle, the three simple models presented here [Calder, 1974; lmbrie and lmbrie, 1980; Paillard, 1998] are integrated for the next
![Figure 1. The ice ages according to Adh•mar [1842], Croll [1875], and Milankovitch [1941]](https://thumb-eu.123doks.com/thumbv2/123doknet/13039126.382294/4.903.203.631.112.785/figure-ice-ages-according-adh-mar-croll-milankovitch.webp)
![Figure 6. (a) The spectral mapping and prediction (SPECMAP) record [Imbrie et al., 1984]](https://thumb-eu.123doks.com/thumbv2/123doknet/13039126.382294/9.903.234.690.85.718/figure-spectral-mapping-prediction-specmap-record-imbrie-et.webp)
![Figure 8. An illustration of the pitfalls of the Milankovitch theory. Topmost curve is the summer solstice insolation at 65øN, normalized to zero mean and unit variance [Laskar et al., 1993]](https://thumb-eu.123doks.com/thumbv2/123doknet/13039126.382294/12.903.216.676.84.718/illustration-pitfalls-milankovitch-topmost-solstice-insolation-normalized-variance.webp)
![Figure 9. Results from the Calder [1974] model. The threshold i o is equal to 502 W m -2, and the ratio kA/k M is chosen equal to 0.22](https://thumb-eu.123doks.com/thumbv2/123doknet/13039126.382294/13.903.209.669.84.568/figure-results-calder-model-threshold-equal-ratio-chosen.webp)
![Figure 10. Same as Figure 9, but for the Imbrie model limbtie and Imbrie, 1980]](https://thumb-eu.123doks.com/thumbv2/123doknet/13039126.382294/14.903.218.668.80.615/figure-figure-imbrie-model-limbtie-imbrie.webp)

![Figure 13. Same as Figure 9, but for Paillard's [1998] model. Threshold values are i o Time constants are % = 10 kyr, 'rG = 're = 50 kyr, and 'rF = 25 kyr](https://thumb-eu.123doks.com/thumbv2/123doknet/13039126.382294/16.903.203.626.91.640/figure-figure-paillard-model-threshold-values-time-constants.webp)
![Figure 14. Model extrapolations for the future. The top curve is the forcing, the summer insolation at 65øN [Berger, 1978]](https://thumb-eu.123doks.com/thumbv2/123doknet/13039126.382294/17.903.240.690.86.595/figure-model-extrapolations-future-forcing-summer-insolation-berger.webp)
