PoS(MULTIF2017)019
Maria Victorovna Pruzhinskaya∗†Clermont Université, Université Blaise Pascal, CNRS/IN2P3, Laboratoire de Physique Corpusculaire, BP 10448, F-63000 Clermont-Ferrand, France
Lomonosov Moscow State University, Sternberg Astronomical Institute, Universitetsky pr. 13, Moscow 119234, Russia
E-mail:[email protected]
Pierre-François Léget
Kavli Institute for Particle Astrophysics and Cosmology, Department of Physics, Stanford University, Stanford, CA 94305
E-mail:[email protected]
Type Ia Supernovae (SNe) are excellent distance indicators in the Universe. Observations of dis-tant SNe Ia led to the discovery of the accelerating expansion of the Universe. The most recent
analysis of SNe Ia indicates that considering a flatΛCDM cosmology, the contribution of dark
energy in the total density of the Universe is ∼70%. Cosmological parameters are estimated from the “luminosity distance-redshift” relation of SNe. Currently a lot of attention is paid to stan-dardization of SNe, i.e. to increase of the accuracy of luminosity distance determination. The uncertainty on the redshift is quite often considered negligible. The redshift most often used cor-responds to the one of SN host galaxy relative to CMB frame. In fact the redshift observed on the Earth also includes the contribution from the Doppler effect induced by peculiar velocities related to the Hubble flow. The existing methods to correct redshift for peculiar velocity contribution do not work in clusters of galaxies, the biggest virialized systems in the Universe where peculiar
velocities can reach 1000 km s−1. To count for the effect of peculiar velocities in galaxy
clus-ters we studied 145 SNe from the Nearby Supernova Factory and found 11 objects that belong to the clusters. We used the galaxy cluster redshift instead the host galaxy redshift to construct the Hubble diagram. The applied technique allowed to improve the redshift measurements and to decrease the spread on the Hubble diagram. The peculiar velocity correction of galaxies inside galaxy clusters has to be taken into account in future cosmological surveys such as LSST.
XII Multifrequency Behaviour of High Energy Cosmic Sources Workshop 12-17 June, 2017
Palermo, Italy
∗Speaker.
PoS(MULTIF2017)019
1. Introduction
1.1 A brief story of supernovae
A hundred years ago our conception of the Universe was remarkably different from the mod-ern. The estimations of the Milky Way size spanned from 5 to 300 thousand light years, the location of the Solar System inside the Milky Way remained an open question, and there were no agreement whether spiral nebulae belong to the Milky Way or not. Devoted to these controversies, the Great Debate between Harlow Shapley and Doust Curtis took place in 1920 [1]. Objects, which today are known as novae and supernovae, were prominent actors in this dispute. However, at that time all new stellar-like bright objects, gradually fading in months, were called “novae”. Curtis supported the “Island Universe”, which consisted in the fact that “spirals” — nebulae that were observed in the sky — are other galaxies like ours. Shapley, on the contrary, thought that the Andromeda and other nebulae were only a part of the Milky Way. One of Shapley’s arguments was the fact that in the case of the “Island Universe” luminosity of some novae would reach the luminosity of the Galaxy. The existence of such objects at that time was in serious doubt. Curtis, in turn, based his argument on the fact that taking “spirals” as a part of our galaxy it will be necessary to intro-duce two classes of novae, because in the “spirals” novae were on an average 7mdimmer than the
others. The idea of the existence of a such duality under otherwise equal characteristics seemed implausible. In order to achieve agreement in absolute magnitudes of novae, it was necessary to put the “spirals” at much greater distances. Noteworthy is that in this case, as noticed by Curtis, the absolute size of the “spirals” matches the size of our galaxy. It turned out that Curtis was right. Finally the “Island Universe” hypothesis was confirmed by Edwin Hubble through observations of Cepheids in nebulae such as Andromeda.
Once the distances to the hosts of novae stars have been determined, it became possible to estimate their absolute magnitudes. It turned out that novae in nebulae are orders of magnitude brighter than others, and astronomers realized that novae should be divided into two subclasses. This division occurred in 1934, when Fritz Zwicky and Walter Baade suggested the term “super-novae”1 for exceptionally bright novae [2]. In 1938 Baade noticed that supernovae are a more
homogeneous class of objects than novae. He found the mean absolute magnitude at maximum light for 18 supernovae to be -14.3mwith a dispersion ∼1.1m. Thereby supernovae were
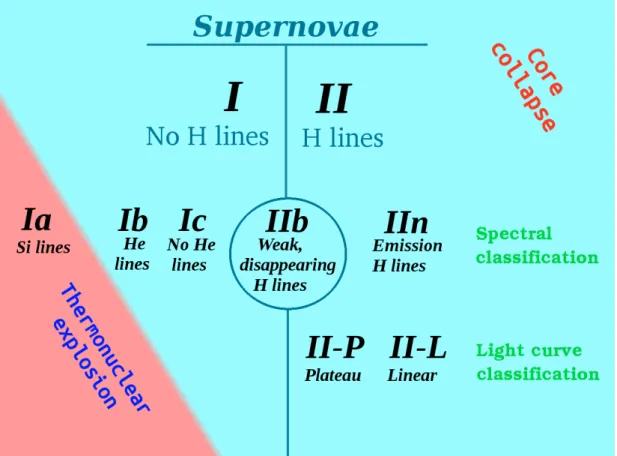
consid-ered as good distance indicators in the Universe [3,4,5]. In 1941 Rudolph Minkowski, obtained and analyzed the first spectra of supernovae, dividing them into two main types [6]. To the Type I he attributed the supernovae which had no hydrogen lines in their spectra and the entire spectrum consisted from broad maxima and minima which were not possible to explain2. Type II
super-novae, on the contrary, showed presence of hydrogen in their spectra. Over time, a more detailed classification appeared (Fig.1). Type I supernovae were divided into three subtypes: Ia, Ib and Ic. It was found that the SN Ia phenomenon arises from a thermonuclear explosion of a white dwarf, and SNe II and SNe Ib/c are the core collapse of a massive star at the final stage of its evolution. Thus, SN Ia explosions differ in the origin from the rest of supernovae.
1It took a couple of years to lose the hyphen.
2Type I SNe spectra were decrypted later by Soviet astronomer Yu.P. Pskovskii [7], however the first who tried to
PoS(MULTIF2017)019
Figure 1:Supernova classification.
Only when SNe were divided into types and subtypes the most homogeneous Type Ia began to be used as cosmological distance indicator. Studies of supernovae led to the one of the greatest dis-coveries in observational cosmology: the discovery of the accelerating expansion of the Universe. In 1998–1999, two international teams of astronomers, one of which was led by Brian Schmidt and Adam Riess and the other by Saul Perlmutter, reported that the cosmological expansion is accelerating [9,10]. The most recent analysis of SNe Ia indicates that considering a flatΛCDM cosmology, our Universe is accelerating withΩΛ=0.705 ± 0.034 [11]. However, this important
discovery would not have been possible without another discovery — the discovery of the relation between the peak luminosity of a Type Ia supernova and the shape of its light curve.
1.2 SNe Ia as “standardizable candles”
In the early studies it was widely assumed that SNe Ia have universal light curves and a con-stant absolute magnitude at maximum (“standard candles”). This was explained by the similarity of the physical processes that lead to the outburst phenomenon. Generally, the outburst is a ther-monuclear explosion of a C-O white dwarf whose mass has become close to or larger than the Chandrasekhar mass. In fact, after the detailed observations of a large number of supernovae had been accomplished, it became clear that the absolute magnitude at maximum can vary within 1m.
PoS(MULTIF2017)019
by white dwarf is not universal: it can be due to the matter accretion on the white dwarf fromthe companion star (so-called “single-degenerate (SD) scenario” [12]) or the merger of two white dwarfs (“double-degenerate (DD) scenario” or “merging scenario” [13,14]). Additionally there exist some alternative scenarios, like sub-Chandrasekhar, that is usually associated with weak ex-plosions. These scenarios have internal freedom that results in significant variations in observed light curves of SNe Ia: like point of deflagration-to-detonation transition (for SD scenario), or dif-ference in total mass (for DD scenario). Another important factor which could violate the “standard candle” hypothesis is dust. Dust around the supernovae, as well as in the host galaxy, surely affects light curve behavior. The distribution and properties of dust in host galaxies of supernovae could be different from that in the Milky Way. In addition, the initial chemical composition of the progenitor stars also complicates the picture. A lower metallicity involves an increase of the Chandrasekhar limit and could affect the explosion process. For example, in elliptical galaxies or in halo of spiral galaxies only old, i.e. metal-poor, stars with an age comparable to that of the Universe are located; on the contrary in the star formation regions of spiral galaxies there are young metal-rich stars. The above-listed factors (age, chemical composition of the region around SN, presence of dust) could be considered as environmental effects. In the epoch of large transient surveys, development of observational techniques, and further processing of the data, a study of environment is of high priority.
Fortunately, it was established that supernovae are “standardized candles”. SNe Ia whose lumi-nosity falls down slowly after the maximum light are brighter than supernovae with a fast decline rate (stretch correction; [15,16, 17]. Later it was shown that their absolute brightness depends on the color as well (color correction; [18,19]). However, the origin of this relation remains a big mystery of SN science and is not yet reproduced by radiation-hydrodynamical modelling. To take into account stretch and color corrections and, therefore, to determine the absolute magnitude of each SN Ia at maximum, different standardization methods have been developed (the ∆m15
-method [20, 21], the stretch-factor [22, 9], the Multicolor Light Curve Shape (MLCS) [23, 24], PRES [25], the Spectral Adaptive Light curve Template for type Ia supernova (SALT) [26, 27], the Color-Magnitude Intercept Calibration (CMAGIC) [28], the Supernova Useful Generator and Reconstructor (SUGAR) [29], etc.). These methods improved a lot the accuracy of distance mea-surements. However, the dispersion on the Hubble diagram still remains. For instance, in the most recent analysis all SNe are standardized with an intrinsic scatter in luminosity about 0.1m. It
could be due to the environmental effects that are not accounted by current standardization meth-ods. Therefore, the SN Ia “standardization” procedure is one of the main sources of systematic uncertainties in the cosmological analysis.
2. Peculiar velocities of SNe Ia in galaxy clusters
Besides the standardization of SN Ia, the Hubble diagram contains another parameter, i.e. the supernova cosmological redshift. This redshift has to be only due to the expansion of the Universe, i.e. the motion within the reference frame defined by the cosmic microwave background radiation (CMB). In fact the redshift observed on the Earth is also affected by peculiar velocities due to the Earth’s rotational and orbital motions, Galactic rotation, peculiar motion of the Galaxy within the Local Group, “infall” of the Local Group toward the center of the Local Super-cluster, host
PoS(MULTIF2017)019
galaxy peculiar motion etc. The exact contribution of peculiar velocities in the observed redshiftis unknown, however it was shown that the peculiar velocities have an impact on the distance measurements and therefore can potentially affect the cosmological analysis [30,31,32,33].
To minimize the influence of poorly constrained peculiar velocities, in some cosmological analyses all SNe with z < 0.015 are removed from the Hubble diagram fitting and a 300-400 km s−1
peculiar velocity dispersion is added in quadrature to the redshift uncertainty [34,35,36]. In the Union2.1 SN Ia compilation, uncertainties due to host galaxy peculiar velocities were adopted to 300 km s−1. Another way to apply the peculiar velocity correction is to measure the local
velocity field assuming linear perturbation theory and then to correct each supernova redshift [37]. [38] estimated the accuracy of this method to be ∼100 km s−1, [39] adopted the value of 200
km s−1, [40] used 150 km s−1. This approach was used in Joint Light-Curve Analysis (JLA; [11]).
However, it was shown that the systematic effect in w, the dark energy equation of state parameter, of different flow models is at the level of ±0.04 [41].
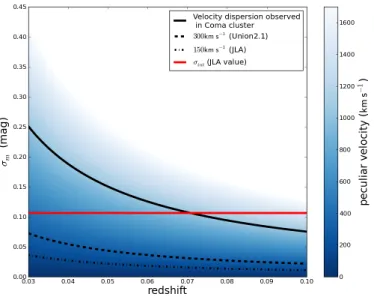
It has nonetheless been observed that velocity dispersion inside galaxy clusters can exceed 1000 km s−1 [42], i.e. can be greater than it is usually assumed in cosmological analyses and
can affect the redshift measurements (see Fig.2). If we transform the dispersion due to peculiar velocities into a magnitude error
σm= 5σV
czln(10), (2.1)
we will see that for low-redshift region (z < 0.05) this error is essentially higher than the one corresponding to 150 km s−1and 300 km s−1and it is two times bigger than the intrinsic dispersion
of SNe Ia on the Hubble diagram found for the JLA sample (Fig.3). It means that standard methods to take into account peculiar velocity do not work for the galaxies inside the clusters, and another more accurate method could be developed for these peculiar cases.
µ Doppler shift Hubble law True SN Ia redshift Observed SN Ia redshift zobs number of
galaxies Doppler shift
cluster redshift histogram
zc
∆µ
Doppler shift
Figure 2: This Hubble diagram demonstrates how large peculiar velocity can affect the measurements of the expansion history of the Universe. The inset plot is a typical velocity distribution of galaxies inside a cluster.
PoS(MULTIF2017)019
Figure 3: Redshift uncertainties (in magnitude units) due to different levels of peculiar velocities, as a function of the cosmological redshift. The solid line corresponds to the Coma cluster velocity dispersion; the dashed and dash-dotted lines correspond to 300 km s−1and 150 km s−1, respectively. The red line shows the intrinsic dispersion of SNe Ia on the Hubble diagram found for the JLA sample [11].
For a SN in a cluster it is possible to estimate zcbetter by using the host galaxy cluster redshift
(zcl) instead of the host redshift3(zhost). First, clusters of galaxies are the largest relaxed, virialized
systems in the Universe. They provide unique laboratories to study astrophysical processes on a large scale and to probe the galaxy evolution. Second, as it is shown in Fig.3, the dispersion inside the cluster can be greater than the one usually assumed in cosmological analyses.
The fact that there is additional velocity dispersion of galaxies inside the clusters that should be taken into account has been known for a long time (see for example [43,44,45,46]). Nevertheless, peculiar velocity correction within galaxy cluster has received little attention in SN Ia studies, with the exception of [47]. The redshift correction induced by galaxy clusters is only mentioned briefly in their analysis, as the study’s objective was to measure the bulk flow with SNe Ia. However, at low redshifts this correction is necessary, which is why we focus on it here.
In this paper we identify SNe that appear to reside in known clusters of galaxies. We then estimate the impact of their peculiar velocities by replacing the host redshift by the cluster redshift. As our parent sample we use 145 SNe observed by the Nearby Supernova Factory (SNFACTORY)
collaboration between 2004 and 2009 with the SuperNova Integral Field Spectrograph (SNIFS; [48], [49]) installed on the University of Hawaii 2.2-m telescope (Mauna Kea). SNFACTORY is
a project devoted to the study of SNe in the nearby Hubble flow (0.02 < z < 0.1; Fig. 4; [48]). We perform the fitting of the Hubble diagram and compare the Hubble residuals (HRs) for SNe in galaxy clusters before and after peculiar velocity correction.
PoS(MULTIF2017)019
0.0 0.2 0.4 0.6 0.8 1.0 1.2 1.4
Redshift
0
10
20
30
40
50
60
70
Number
of
SNe
JLA
Nearby SDSS SNLS HST SNFFigure 4:The distribution of redshift for SNe Ia in SNFACTORY[48] and JLA [11].
3. Analysis
3.1 Cluster pre-selection
Using the SIMBAD database [50] we chose all the clusters projected within 2.5 Mpc around the supernovae position and with redshift differing from the supernova one by less than 0.015. We did not consider objects classified as groups of galaxies (GrG), although there is no strong boundary between these and clusters, since groups of galaxies are characterized by smaller mass and therefore smaller velocity dispersion ∼300 km s−1 (see fig.5 in [51]). The uncertainty introduced by such
velocities is small and below that from intrinsic scatter of SNe Ia. 3.2 Cluster redshift measurement and final matching
To measure the redshift of the cluster it is needed to know which galaxies in the cluster field are its members. First, we took all the galaxies attributed to each cluster in literature sources and added the SNFACTORY host galaxy if it was not among them. Then, these data were combined
with the DR13 release database of SDSS [52,53]. We selected all the galaxies with spectroscopic redshift located in a circle with the center corresponding to the cluster coordinates and projected inside the cluster R200 radius — radius where an average interior density of cluster equals to 200
times the critical density of the Universe at redshift z. A redshift cut 5σV was adopted where σV is
a velocity dispersion inside a cluster4.
To estimate the redshift of a cluster we applied so-called bi-weight technique [54]. Bi-weight allows to determine the kinematic properties of galaxy clusters and being resistant in the pres-ence of outliers and robust for a broad range of underlying population with non-Gaussian velocity distributions.
Knowing the redshifts and R200values for each cluster, we performed the final matching. The
supernova is considered a cluster member if two conditions are satisfied:
4According to the virial theorem, σV 'q
GM200
PoS(MULTIF2017)019
– D < R200, where d is a distance between SN and cluster center.– |zhost− zcl| < 3σcV
The SNe that did not satisfy these criteria were removed from a further consideration.
Initially we considered everything that is classified as cluster by previous studies (see Sec.3.1). However, some of these classifications can be false. Since in virialized systems such as clusters the thermal velocity of gas and the velocity of the galaxies are bound by the same gravitational potential, the clusters of galaxies could appear as luminous X-ray emitters, with typical luminosities ofLX∼ 1043–1045 erg s−1. While we consider the nearby objects (z < 0.1), the X-ray emission
has to be resolved by X-ray surveys. Therefore, only candidates with diffuse X-ray emission were kept for further analysis5.
The final list of SNFACTORYsupernovae in confirmed clusters contains 11 objects.
4. Results
4.1 Impact on the Hubble diagram
Since we have a list of 11 SNe Ia belonging to clusters, we can apply the peculiar velocity correction and study how it affects the Hubble residuals (the difference between observed and the-oretical distance modulus). Using only SN Ia outside galaxy cluster6, we performed the Hubble
diagram fitting and obtained SN Ia nuisance parameters. During the fit cosmology was fixed to ΩΛ=0.7,Ωm=0.3, and H0=70 km s−1Mpc−1. In order to study the impact of peculiar velocity
correction, we compute the Hubble residuals for the supernovae in clusters before and after correc-tion. We used the weighted root mean squared (wRMS) as defined in [55] to measure the effect of correction.
We obtained two main results:
– The dispersion of 11 SNe Ia on the Hubble diagram decreases significantly when the peculiar velocities of their hosts inside the clusters are taken into account (wRMS = 0.130 ± 0.038 mag). If we are using the redshift of the host instead the redshift of the cluster, the dispersion of these 11 SNe is wRMS = 0.137 ± 0.036 mag (Fig.5).
– Moreover, the wRMS (0.130 ± 0.038 mag) we found for SNe inside the clusters before cor-rection is also smaller than wRMS for the SNe in the field (wRMS = 0.150 ± 0.009 mag) which could be due to the fact that the intrinsic dispersion in luminosity of SNe Ia inside the galaxy cluster is lower. This effect will be discussed in the Section4.3.
5In order to look for an extended X-ray counterpart the public ROSAT All Sky Survey images for total energy band
0.1-2.4 keV were used, http://www.xray.mpe.mpg.de/cgi-bin/rosat/rosat-survey.
6taking into account all the SNe Ia does not affect the Hubble diagram fitting because the number of SNe Ia inside
PoS(MULTIF2017)019
0.01 0.02 0.03 0.04 0.05 0.06 0.07 0.08 0.09 zc −0.4 −0.3 −0.2 −0.1 0.0 0.1 0.2 0.3 0.4 ∆µSNe Ia inside clusters, before correction SNe Ia inside clusters, after correction
0.002 0.004 0.006 0.008 zc −2.0 −1.6 −1.2 −0.8 ∆µ SN2006X wRMS=0.137 ± 0.036 mag wRMS=0.130 ± 0.038 mag
Figure 5:Hubble diagram residuals. For cluster members red circles (blue squares) correspond to residuals for SNe in galaxy clusters before (after) correction for peculiar velocities of the hosts inside their clusters. SN2006X is presented in the inset plot separately from the others due to its very low redshift.
4.2 SN Ia rate in galaxy clusters
Numerous studies of SN Ia rate in clusters have been carried out. The different measurements are summarized in Fig.6and Table1. It is found that for nearby clusters (z < 0.1), the explosion rate is 0.042+0.022
−0.018SNuM7 [56], whereas the overall explosion rate in the same range of redshift
is 0.10 ± 0.02 SNuM [57]. Considering that the SN Ia explosion rate is directly related to the star formation rate [58], the obtained result can be explained by lower star formation rate in clusters of galaxies. Indeed, mainly passive elliptical galaxies are located in the central parts of clusters. However, it is interesting to notice that in early-type cluster galaxies SN Ia rate (0.058+0.019−0.015SNuM) is higher than in early-type galaxies in the field (0.019+0.013−0.008SNuM, [59]). The increased rate may be due to galaxy interactions in clusters, inducing either the formation of young stars or a different evolution of the progenitor binary systems [59].
The explosion rate in clusters is only two times lower than the overall SN Ia explosion rate. Nevertheless, it should be noted that the majority of galaxies in the Universe are not found in galaxy clusters, but in filamentary structures such as the Big wall [68] and therefore SNe Ia in galaxy clusters are rare in untargeted searches as SNFACTORY. To study the SN Ia rate in galaxy
clusters a larger sample of supernovae is needed, thus we can not make a strong conclusion about this issue basing on the data we have.
4.3 Properties of SNe Ia in galaxy clusters
In Section4.1it was shown that wRMS on the Hubble diagram of the supernovae in clusters is less than for supernovae in the field. It could mean that the intrinsic luminosity dispersion of SN Ia
71 SNuM ≡ 1 SN Ia (100 years 1010M )−1
PoS(MULTIF2017)019
0.0 0.2 0.4 0.6 0.8 1.0 1.2 1.4 1.6 Redshift 0.0 0.1 0.2 0.3 0.4 0.5 0.6 SN rate [SNuM h 2 70]Figure 6: The SN rate in clusters of galaxies provided by different studies [59,60,61,62,56,63,62,64, 65,66,64,67]. SNuM ≡ SNe (100 yr 1010M
)−1.
<z > (z range) Rate (SNuM h270) Reference 0.020 (0.005-0.040) 0.070+0.016−0.013 [59]a 0.023 (0.020-0.026) ∼0.020 [60] 0.023 (0.020-0.026) ∼0.040 [61] 0.084 (0.030-0.170) 0.060+0.029−0.021 [62] 0.100 (0.050-0.150) 0.042+0.022 −0.018 [56]b 0.150 (0.060-0.190) 0.098+0.068 −0.048 [63] 0.225 (0.100-0.300) 0.088+0.025−0.020 [62] 0.250 (0.180-0.370) 0.110+0.160 −0.070 [64] 0.460 (0.200-0.600) 0.104+0.094−0.040 [65]a 0.600 (0.500-0.900) 0.112+0.102−0.086 [66] 0.900 (0.830-1.270) 0.220+0.250 −0.110 [64] 1.120 (0.900-1.460) 0.360+0.230−0.190 [67]
Table 1: SN Ia rates in clusters. SNuM ≡ SNe (100 yr 1010 M )−1. The quoted errors are the sum of
statistical and systematic components. aThe overall cluster SN Ia rate within D < 1.5 Mpc. bThe overall
cluster SN Ia rate within R200.
in clusters is smaller, i.e. they are more "standard" (see Fig.5). Unfortunately, the statistical test shows that the significance of this result is low.
Despite of the low significance of the latter result, we could expect some difference between SNe in clusters and outside them, because the properties of the galaxies inside the clusters are known to be different from those in the field. While in the field all morphological types of the galaxies are observed, in the central part of the clusters usually the elliptical galaxies are located. The results of binary star population synthesis together with observational data on the Type Ia SN
PoS(MULTIF2017)019
rates shows that in elliptical galaxies the overwhelming majority of SNe Ia (99%) form via mergersof binary white dwarfs [69]. Moreover, the oldest, i.e. metal-poor, stars with an age comparable to that of the Universe lie in elliptical/lenticular galaxies as well as in halo of spiral galaxies. And at last, the dust (including grey dust) is almost absent in these regions [70]. The influence of the environmental effects on the supernovae intrinsic luminosity was proved in many works. As a parameter to characterize the environment the galocentric distance, the galaxy morphology, metallicity, mass, specific star formation rate (star formation rate (SFR) per unit galaxy stellar mass), local specific SFR (1-3 kpc around the SN position) were considered. However, it is needed to stress that when we study the environment of SNe the effect of projection is not taken into account, and it can turn out that a SN is projected to the star formation region of spiral host galaxy but in reality it belongs to the halo of this galaxy where metallicity, age of stars and SFR are similar to elliptical passive galaxies.
In the Fig.7we show how the peculiar velocity correction (c|∆z|) before and after correction depend on supernova parameters (X1, C), host properties (sSFR, stellar mass, morphological type,
RS residuals, [71,72]), relative SN position inside the cluster and cluster mass M200. The c|∆z| plot
shows that most of the SNe whose redshifts change have X1' 0, hosted by blue spiral galaxies,
with high sSFR, smaller Mstellar, r/R200 ' 0.7 (see Fig.7). This is consistent with the distribution
of galaxies in the cluster where the massive/elliptical/passive galaxies are located in the center but outer region contains spiral galaxies as well and with velocity profiles inside the clusters (see fig. 15 in [73]).
The low statistics do not allow us to perform the cosmological fit separately for the supernovae inside and outside galaxy clusters and to study the behavior of the supernova light curve parameters in both subsamples. However, it is necessary to perform such kind of analysis using the larger sample of SNe Ia because the variation of the light curve parameters, especially the luminosity, influences the cosmological analysis (e.g., [74,75]).
5. Conclusions
By now several realizations of the idea of SN Ia “standardization” are developed. These meth-ods are contiguously improving with time, however, the intrinsic dispersion on the Hubble diagram still remains. The possible solution can be the including of environmental factor to the standard-ization procedure.
Besides the standardization of SNe Ia, the Hubble diagram contains another parameter, i.e. the supernova cosmological redshift. The redshift observed on the Earth is affected by peculiar velocities that are unknown and introduce an additional uncertainty on the Hubble diagram. In galaxy clusters a contribution of peculiar velocities can be large. For SNe Ia in clusters we propose a technique that allowed to improve the redshift measurements for low and intermediate redshifts (z < 0.1) and to decrease the spread on the Hubble diagram. We also found that the dispersion on the Hubble diagram of 11 SNe Ia that belong to clusters is smaller than the one of SNe in the field. Nevertheless, this result is not statistically significant. The environmental studies of larger sample of SNe Ia in clusters are needed. The difference in SN light curve parameters inside and outside the clusters can be crucial for future cosmological analysis where all supernovae are described by one standardization model.
PoS(MULTIF2017)019
−3 −2 −1 0 1 X1 0.0 0.4 0.8 1.2 1.6 −0.1 0.0 0.1 0.2 C 0.0 0.4 0.8 1.2 1.6 −13 −12 −11 −10 −9 log(sSFR) 0.0 0.4 0.8 1.2 1.6 9 10 11 12 log(Mstellar) 0.0 0.4 0.8 1.2 1.6 E S0 Sab Sb Sbc Sc Morphology 0.0 0.4 0.8 1.2 1.6 c| ∆z | [1000 km s − 1] −0.4 −0.3 −0.2 −0.1 0.0 RS residuals 0.0 0.4 0.8 1.2 1.6 0.0 0.4 0.8 1.2 r/R200 0.0 0.4 0.8 1.2 1.6 14.0 14.5 15.0 log(M200) 0.0 0.4 0.8 1.2 1.6 -12 -11 -10 log(sSFR)Figure 7: The peculiar velocity correction (c|∆z|) for supernovae that belong to clusters as a function of supernova parameters (X1, C; triangles), host properties (specific SFR [yr−1], stellar mass [M
], morpho-logical type, RS residuals [(g − r) − (g − r)RS]; circles, [71,72]), relative SN position inside the cluster and
cluster mass M200[M ] (squares). The colorbar shows the corresponding specific SFR.
The impact of peculiar velocities decreases with distance and becomes negligible at cosmolog-ical redshifts. However, for the future surveys such as LSST [76], to perform very precise distance measurements such effects have to be taken into account.
6. Acknowledgments
We thank the SNFACTORY collaboration for the supernovae dataset, their support and
feed-back. Support in France was provided by CNRS/IN2P3. MVP acknowledges support from Rus-sian Science Foundation grant 14-12-00146 for the selection of SNe exploded in galaxy clusters. PFL acknowledges support from the National Science Foundation grant PHY-1404070. This re-search has made use of the SIMBAD database, operated at CDS, Strasbourg, France. We have made use of the ROSAT Data Archive of the Max-Planck-Institut fur extraterrestrische Physik (MPE) at Garching, Germany. Funding for the Sloan Digital Sky Survey IV has been provided by the Alfred P. Sloan Foundation, the U.S. Department of Energy Office of Science, and the Participating Institutions. SDSS-IV acknowledges support and resources from the Center for
PoS(MULTIF2017)019
High-Performance Computing at the University of Utah. The SDSS web site is www.sdss.org.SDSS-IV is managed by the Astrophysical Research Consortium for the Participating Institutions of the SDSS Collaboration including the Brazilian Participation Group, the Carnegie Institution for Science, Carnegie Mellon University, the Chilean Participation Group, the French Participation Group, Harvard-Smithsonian Center for Astrophysics, Instituto de Astrofísica de Canarias, The Johns Hopkins University, Kavli Institute for the Physics and Mathematics of the Universe (IPMU) / University of Tokyo, Lawrence Berkeley National Laboratory, Leibniz Institut für Astrophysik Potsdam (AIP), Max-Planck-Institut für Astronomie (MPIA Heidelberg), Max-Planck-Institut für Astrophysik (MPA Garching), Max-Planck-Institut für Extraterrestrische Physik (MPE), National Astronomical Observatories of China, New Mexico State University, New York University, Uni-versity of Notre Dame, Observatário Nacional / MCTI, The Ohio State UniUni-versity, Pennsylvania State University, Shanghai Astronomical Observatory, United Kingdom Participation Group, Uni-versidad Nacional Autónoma de México, University of Arizona, University of Colorado Boulder, University of Oxford, University of Portsmouth, University of Utah, University of Virginia, Uni-versity of Washington, UniUni-versity of Wisconsin, Vanderbilt UniUni-versity, and Yale UniUni-versity.
References
[1] H. Shapley and H. D. Curtis, The Scale of the Universe, Bulletin of the National Research Council, Vol. 2, Part 3, No. 11, p. 171-217 2 (May, 1921) 171–217.
[2] W. Baade and F. Zwicky, On Super-novae,Proceedings of the National Academy of Science 20 (May, 1934) 254–259.
[3] W. Baade, The Absolute Photographic Magnitude of Supernovae.,ApJ 88 (Oct., 1938) 285.
[4] O. C. Wilson, Possible Applications of Supernovae to the Study of the Nebular Red Shifts.,ApJ 90 (Nov., 1939) 634.
[5] F. Zwicky, On the Theory and Observation of Highly Collapsed Stars,Physical Review 55 (Apr., 1939) 726–743.
[6] R. Minkowski, Spectra of Supernovae,PASP 53 (Aug., 1941) 224.
[7] Y. P. Pskovskii, Identification of the Absorption Spectrum of the Type I Supernova., Soviet Ast. 12 (Apr., 1969) 750.
[8] D. B. McLaughlin, The Spectrum of the Supernova of 1954 in NGC 4214,PASP 75 (Apr., 1963) 133.
[9] S. Perlmutter, G. Aldering, G. Goldhaber, R. A. Knop, P. Nugent, P. G. Castro et al., Measurements of Omega and Lambda from 42 High-Redshift Supernovae, ApJ 517 (June, 1999) 565–586.
[10] A. G. Riess, A. V. Filippenko, P. Challis, A. Clocchiatti, A. Diercks, P. M. Garnavich et al., Observational Evidence from Supernovae for an Accelerating Universe and a Cosmological Constant, AJ 116 (Sept., 1998) 1009–1038.
[11] M. Betoule, R. Kessler, J. Guy, J. Mosher, D. Hardin, R. Biswas et al., Improved cosmological constraints from a joint analysis of the sdss-ii and snls supernova samples",A&A 568 (2014) 32.
[12] J. Whelan and I. Iben, Jr., Binaries and Supernovae of Type I,ApJ 186 (Dec., 1973) 1007–1014.
[13] I. Iben, Jr. and A. V. Tutukov, Supernovae of type I as end products of the evolution of binaries with components of moderate initial mass (M not greater than about 9 solar masses),ApJS 54 (Feb., 1984) 335–372.
PoS(MULTIF2017)019
[14] R. F. Webbink, Double white dwarfs as progenitors of R Coronae Borealis stars and Type Isupernovae,ApJ 277 (Feb., 1984) 355–360.
[15] B. W. Rust, Use of supernovae light curves for testing the expansion hypothesis and other cosmological relations, Ph.D. thesis, Oak Ridge National Lab., TN., 1974.
[16] I. P. Pskovskii, Light curves, color curves, and expansion velocity of type I supernovae as functions of the rate of brightness decline, Soviet Ast. 21 (Dec., 1977) 675–682.
[17] Y. P. Pskovskii, Photometric classification and basic parameters of type I supernovae, Soviet Ast. 28 (Dec., 1984) 658–664.
[18] M. Hamuy, M. M. Phillips, N. B. Suntzeff, R. A. Schommer, J. Maza and R. Aviles, The Hubble Diagram of the Calan/Tololo Type IA Supernovae and the Value of HO,AJ 112 (Dec., 1996) 2398, [astro-ph/9609062].
[19] R. Tripp, A two-parameter luminosity correction for Type IA supernovae, A&A 331 (Mar., 1998) 815–820.
[20] M. M. Phillips, The absolute magnitudes of Type IA supernovae,ApJL 413 (Aug., 1993) L105–L108.
[21] M. M. Phillips, P. Lira, N. B. Suntzeff, R. A. Schommer, M. Hamuy and J. Maza, The Reddening-Free Decline Rate Versus Luminosity Relationship for Type IA Supernovae,AJ 118 (Oct., 1999)
1766–1776, [astro-ph/9907052].
[22] S. Perlmutter, S. Gabi, G. Goldhaber, A. Goobar, D. E. Groom, I. M. Hook et al., Measurements of the Cosmological ParametersΩ and Λ from the First Seven Supernovae at z <= 0.35, ApJ 483 (July, 1997) 565–581, [astro-ph/9608192].
[23] A. Riess, W. Press and R. Kirshner, A precise distance indicator: Type ia supernova multicolor light curve shapes, AJ 473 (1996) 88, [astro-ph/9604143].
[24] S. Jha, A. G. Riess and R. P. Kirshner, Improved Distances to Type Ia Supernovae with Multicolor Light-Curve Shapes: MLCS2k2,ApJ 659 (Apr., 2007) 122–148, [arXiv:astro-ph/0612666]. [25] J. L. Prieto, A. Rest and N. B. Suntzeff, A New Method to Calibrate the Magnitudes of Type Ia
Supernovae at Maximum Light,ApJ 647 (Aug., 2006) 501–512, [astro-ph/0603407].
[26] J. Guy, P. Astier, S. Nobili, N. Regnault and R. Pain, SALT: a spectral adaptive light curve template for type Ia supernovae, A&A 443 (Dec., 2005) 781–791.
[27] J. Guy, P. Astier, S. Baumont, D. Hardin, R. Pain, N. Regnault et al., SALT2: using distant supernovae to improve the use of type Ia supernovae as distance indicators, A&A 466 (Apr., 2007) 11–21. [28] L. Wang, G. Goldhaber, G. Aldering and S. Perlmutter, Multicolor Light Curves of Type Ia
Supernovae on the Color-Magnitude Diagram: A Novel Step toward More Precise Distance and Extinction Estimates,ApJ 590 (June, 2003) 944–970, [astro-ph/0302341].
[29] P.-F. Léget, Spectral modeling of type Ia supernovae, observed by the Nearby Supernova Factory, in order to improve extragalactic distance measurement, theses, Université Blaise Pascal, Sept., 2016. [30] A. Cooray and R. R. Caldwell, Large-scale bulk motions complicate the Hubble diagram,Physical
Review D 73 (May, 2006) 103002, [astro-ph/0601377].
[31] L. Hui and P. B. Greene, Correlated fluctuations in luminosity distance and the importance of peculiar motion in supernova surveys,Physical Review D 73 (June, 2006) 123526, [astro-ph/0512159]. [32] T. M. Davis, L. Hui, J. A. Frieman, T. Haugbølle, R. Kessler, B. Sinclair et al., The Effect of Peculiar
PoS(MULTIF2017)019
[33] F. Habibi, S. Baghram and S. Tavasoli, Peculiar velocity measurement in a clumpy universe, ArXive-prints (Dec., 2014) , [1412.8457].
[34] P. Astier, J. Guy, N. Regnault, R. Pain, E. Aubourg, D. Balam et al., The Supernova Legacy Survey: measurement ofΩM,ΩΛand w from the first year data set, A&A 447 (Feb., 2006) 31–48.
[35] W. M. Wood-Vasey, G. Miknaitis, C. W. Stubbs, S. Jha, A. G. Riess, P. M. Garnavich et al., Observational Constraints on the Nature of Dark Energy: First Cosmological Results from the ESSENCE Supernova Survey,ApJ 666 (Sept., 2007) 694–715, [astro-ph/0701041]. [36] R. Amanullah, C. Lidman, D. Rubin, G. Aldering, P. Astier, K. Barbary et al., Spectra and Light
Curves of Six Type Ia Supernovae at 0.511 < z < 1.12 and the Union2 Compilation, ArXiv e-prints (Apr., 2010) .
[37] M. J. Hudson, R. J. Smith, J. R. Lucey and E. Branchini, Streaming motions of galaxy clusters within 12 000 km s−1- V. The peculiar velocity field,MNRAS 352 (July, 2004) 61–75,
[astro-ph/0404386].
[38] J. A. Willick and M. A. Strauss, Maximum Likelihood Comparison of Tully-Fisher and Redshift Data. II. Results from an Expanded Sample,ApJ 507 (Nov., 1998) 64–83, [astro-ph/9801307]. [39] A. G. Riess, M. Davis, J. Baker and R. P. Kirshner, The Velocity Field from Type IA Supernovae
Matches the Gravity Field from Galaxy Surveys,ApJL 488 (Oct., 1997) L1–L5, [astro-ph/9707261].
[40] A. Conley, J. Guy, M. Sullivan, N. Regnault, P. Astier, C. Balland et al., Supernova Constraints and Systematic Uncertainties from the First Three Years of the Supernova Legacy Survey,ApJS 192 (Jan., 2011) 1, [1104.1443].
[41] M. J. Neill, J. D. Hudson and A. Conley, The Peculiar Velocities of Local Type Ia Supernovae and Their Impact on Cosmology, ApJ 661 (Oct., 2007) L123–L126.
[42] J. Ruel, G. Bazin, M. Bayliss, M. Brodwin, R. J. Foley, B. Stalder et al., Optical Spectroscopy and Velocity Dispersions of Galaxy Clusters from the SPT-SZ Survey,ApJ 792 (Sept., 2014) 45, [1311.4953].
[43] R. B. Tully and E. J. Shaya, Infall of galaxies into the Virgo cluster and some cosmological constraints,ApJ 281 (June, 1984) 31–55.
[44] I. D. Karachentsev, R. B. Tully, P.-F. Wu, E. J. Shaya and A. E. Dolphin, Infall of Nearby Galaxies into the Virgo Cluster as Traced with Hubble Space Telescope,ApJ 782 (Feb., 2014) 4,
[1312.6769].
[45] J. P. Blakeslee, M. Davis, J. L. Tonry, A. Dressler and E. A. Ajhar, A First Comparison of the Surface Brightness Fluctuation Survey Distances with the Galaxy Density Field: Implications for H0andΩ, ApJL 527 (Dec., 1999) L73–L76, [astro-ph/9910340].
[46] D. J. Radburn-Smith, J. R. Lucey and M. J. Hudson, A comparison of local Type Ia supernovae with the IRAS PSCz gravity field,MNRAS 355 (Dec., 2004) 1378–1382, [astro-ph/0409551]. [47] U. Feindt, M. Kerschhaggl, M. Kowalski, G. Aldering, P. Antilogus, C. Aragon et al., Measuring
cosmic bulk flows with Type Ia supernovae from the Nearby Supernova Factory,A&A 560 (Dec., 2013) A90, [1310.4184].
[48] G. Aldering, G. Adam, P. Antilogus, P. Astier, R. Bacon, S. Bongard et al., Overview of the Nearby Supernova Factory, in SPIE Conference Series, vol. 4836, pp. 61–72, Dec., 2002.
PoS(MULTIF2017)019
[49] B. Lantz, G. Aldering, P. Antilogus, C. Bonnaud, L. Capoani, A. Castera et al., SNIFS: a widebandintegral field spectrograph with microlens arrays, in SPIE Conference Series, vol. 5249, pp. 146–155, Feb., 2004.
[50] M. Wenger, F. Ochsenbein, D. Egret, P. Dubois, F. Bonnarel, S. Borde et al., The SIMBAD astronomical database. The CDS reference database for astronomical objects,Astron. Astrophys. Suppl. Ser. 143 (Apr., 2000) 9–22, [astro-ph/0002110].
[51] J. S. Mulchaey, X-ray Properties of Groups of Galaxies,Annual Review of Astronomy and Astrophysics 38 (2000) 289–335, [astro-ph/0009379].
[52] M. R. Blanton, M. A. Bershady, B. Abolfathi, F. D. Albareti, C. Allende Prieto, A. Almeida et al., Sloan Digital Sky Survey IV: Mapping the Milky Way, Nearby Galaxies, and the Distant Universe,AJ 154(July, 2017) 28, [1703.00052].
[53] SDSS Collaboration, F. D. Albareti, C. Allende Prieto, A. Almeida, F. Anders, S. Anderson et al., The Thirteenth Data Release of the Sloan Digital Sky Survey: First Spectroscopic Data from the SDSS-IV Survey MApping Nearby Galaxies at Apache Point Observatory, ArXiv e-prints (Aug., 2016) , [1608.02013].
[54] T. C. Beers, K. Flynn and K. Gebhardt, Measures of location and scale for velocities in clusters of galaxies - A robust approach,AJ 100 (July, 1990) 32–46.
[55] S. Blondin, K. S. Mandel and R. P. Kirshner, Do spectra improve distance measurements of Type Ia supernovae?, A&A 526 (Feb., 2011) A81.
[56] D. J. Sand, M. L. Graham, C. Bildfell, D. Zaritsky, C. Pritchet, H. Hoekstra et al., The Multi-Epoch nearby Cluster Survey: Type Ia Supernova Rate Measurement in z ˜ 0.1 Clusters and the Late-time Delay Time Distribution,ApJ 746 (Feb., 2012) 163, [1110.1632].
[57] O. Graur and D. Maoz, Discovery of 90 Type Ia supernovae among 700 000 Sloan spectra: the Type Ia supernova rate versus galaxy mass and star formation rate at redshift 0.1,MNRAS 430 (Apr., 2013) 1746–1763, [1209.0008].
[58] E. Scannapieco and L. Bildsten, The Type Ia Supernova Rate,ApJL 629 (Aug., 2005) L85–L88, [astro-ph/0507456].
[59] F. Mannucci, D. Maoz, K. Sharon, M. T. Botticella, M. Della Valle, A. Gal-Yam et al., The supernova rate in local galaxy clusters,MNRAS 383 (Jan., 2008) 1121–1130, [0710.1094].
[60] P. Crane, G. A. Tammann and L. Woltjer, Limit on the frequency of intergalactic supernovae,Nature 265(Jan., 1977) 124–126.
[61] R. Barbon, Supernovae in the Coma cluster of galaxies,AJ 83 (Jan., 1978) 13–19.
[62] B. Dilday, B. Bassett, A. Becker, R. Bender, F. Castander, D. Cinabro et al., A Measurement of the Rate of Type Ia Supernovae in Galaxy Clusters from the SDSS-II Supernova Survey,ApJ 715 (June, 2010) 1021–1035, [1003.1521].
[63] K. Sharon, A. Gal-Yam, D. Maoz, A. V. Filippenko and P. Guhathakurta, Supernovae in Low-Redshift Galaxy Clusters: The Type Ia Supernova Rate,ApJ 660 (May, 2007) 1165–1175,
[astro-ph/0610228].
[64] A. Gal-Yam, D. Maoz and K. Sharon, Supernovae in deep Hubble Space Telescope galaxy cluster fields: cluster rates and field counts,MNRAS 332 (May, 2002) 37–48, [astro-ph/0109089].
PoS(MULTIF2017)019
[65] M. L. Graham, C. J. Pritchet, M. Sullivan, S. D. J. Gwyn, J. D. Neill, E. Y. Hsiao et al., Type iaSupernovae Rates and Galaxy Clustering from the CFHT Supernova Legacy Survey,AJ 135 (Apr., 2008) 1343–1349, [0801.4968].
[66] K. Sharon, A. Gal-Yam, D. Maoz, A. V. Filippenko, R. J. Foley, J. M. Silverman et al., The Type Ia Supernova Rate in Redshift 0.5-0.9 Galaxy Clusters,ApJ 718 (Aug., 2010) 876–893, [1006.3757]. [67] K. Barbary, G. Aldering, R. Amanullah, M. Brodwin, N. Connolly, K. S. Dawson et al., The Hubble
Space Telescope Cluster Supernova Survey. II. The Type Ia Supernova Rate in High-redshift Galaxy Clusters,ApJ 745 (Jan., 2012) 32, [1010.5786].
[68] M. J. Geller and J. P. Huchra, Mapping the universe,Science 246 (Nov., 1989) 897–903.
[69] V. M. Lipunov, I. E. Panchenko and M. V. Pruzhinskaya, The mechanism of supernova Ia explosion in elliptical galaxies,New A 16 (July, 2011) 250–252, [1005.4134].
[70] M. V. Pruzhinskaya, E. S. Gorbovskoy and V. M. Lipunov, ”Pure” supernovae and accelerated expansion of the Universe,Astronomy Letters 37 (Oct., 2011) 663–669, [1109.1159].
[71] M. Childress, G. Aldering, P. Antilogus, C. Aragon, S. Bailey, C. Baltay et al., Host Galaxies of Type Ia Supernovae from the Nearby Supernova Factory,ApJ 770 (June, 2013) 107, [1304.4719]. [72] M. J. I. Brown, J. Moustakas, J.-D. T. Smith, E. da Cunha, T. H. Jarrett, M. Imanishi et al., An Atlas of
Galaxy Spectral Energy Distributions from the Ultraviolet to the Mid-infrared,ApJS 212 (June, 2014) 18, [1312.3029].
[73] K. Rines and A. Diaferio, CIRS: Cluster Infall Regions in the Sloan Digital Sky Survey. I. Infall Patterns and Mass Profiles,AJ 132 (Sept., 2006) 1275–1297, [astro-ph/0602032]. [74] M. Hicken, W. M. Wood-Vasey, S. Blondin, P. Challis, S. Jha, P. L. Kelly et al., Improved Dark
Energy Constraints from ˜100 New CfA Supernova Type Ia Light Curves,ApJ 700 (Aug., 2009) 1097–1140, [0901.4804].
[75] M. Rigault, Y. Copin, G. Aldering, P. Antilogus, C. Aragon, S. Bailey et al., Evidence of
environmental dependencies of type ia supernovae from the nearby supernova factory indicated by local hδs,1309.1182.
[76] LSST Science Collaboration, P. A. Abell, J. Allison, S. F. Anderson, J. R. Andrew, J. R. P. Angel et al., LSST Science Book, Version 2.0, ArXiv e-prints (Dec., 2009) , [0912.0201].
DISCUSSION
G.S. BISNOVATYI-KOGAN:What is the percent of galaxies which do not belong to any galaxy cluster?
M.V. PRUZHINSKAYA:I think nobody knows exactly. I can tell only that the majority of galaxies in the Universe are found in filamentary structures such as the Big wall and not in galaxy clusters. L. AMATIWhat about using only SNe Ia in clusters to measure H0? Does this reconciles the
estimate of H0from SNe and CMB?
M.V. PRUZHINSKAYA:This is interesting but we still do not have enough SNe in clusters to do a sensitive analysis. We will do it in the next future.

![Figure 4: The distribution of redshift for SNe Ia in SN FACTORY [48] and JLA [11].](https://thumb-eu.123doks.com/thumbv2/123doknet/14113450.466722/7.892.255.630.139.408/figure-distribution-redshift-sne-ia-sn-factory-jla.webp)

![Figure 6: The SN rate in clusters of galaxies provided by different studies [59, 60, 61, 62, 56, 63, 62, 64, 65, 66, 64, 67]](https://thumb-eu.123doks.com/thumbv2/123doknet/14113450.466722/10.892.226.673.143.440/figure-sn-rate-clusters-galaxies-provided-different-studies.webp)
![Figure 7: The peculiar velocity correction (c | ∆z | ) for supernovae that belong to clusters as a function of supernova parameters (X 1 , C; triangles), host properties (specific SFR [yr −1 ], stellar mass [M ], morpho-logical type, RS residuals [(g − r](https://thumb-eu.123doks.com/thumbv2/123doknet/14113450.466722/12.892.265.626.175.607/peculiar-correction-supernovae-supernova-parameters-triangles-properties-residuals.webp)
