HAL Id: cea-02475291
https://hal-cea.archives-ouvertes.fr/cea-02475291
Submitted on 13 Feb 2020
HAL is a multi-disciplinary open access
archive for the deposit and dissemination of
sci-entific research documents, whether they are
pub-lished or not. The documents may come from
teaching and research institutions in France or
abroad, or from public or private research centers.
L’archive ouverte pluridisciplinaire HAL, est
destinée au dépôt et à la diffusion de documents
scientifiques de niveau recherche, publiés ou non,
émanant des établissements d’enseignement et de
recherche français ou étrangers, des laboratoires
publics ou privés.
Metallic magnetic calorimeters for beta spectrometry
Martin Loidl, Matias Rodrigues, Benjamin Censier, S. Kowalski, Xavier
Mougeot, Philippe Cassette, Thierry Branger, Didier Lacour
To cite this version:
Martin Loidl, Matias Rodrigues, Benjamin Censier, S. Kowalski, Xavier Mougeot, et al.. Metallic
magnetic calorimeters for beta spectrometry. AIP Conference Proceedings, American Institute of
Physics, 2009, The Thirteenth International Workshop on Low Temperature Detectors-LTD13, 1185,
pp.587. �10.1063/1.3292410�. �cea-02475291�
Metallic Magnetic Calorimeters for Beta Spectrometry
M. Loidl, M. Rodrigues, B. Censier, S. Kowalski, X. Mougeot, P. Cassette,
T. Branger, D. Lacour
CEA/LIST, LNE – Laboratoire National Henri Becquerel, 91191 Gif-sur-Yvette, France
Abstract. We are developing metallic magnetic calorimeters for beta spectrometry in the context of ionizing radiation metrology. The aim is the determination of the shape factors of beta spectra. Our latest detector has been designed to measure the spectrum of 241Pu, a pure beta emitter with an endpoint energy of 20.8 keV. We present the spectrum
resulting from our first measurement and compare it with theoretical spectra.
Keywords: Metallic magnetic calorimeters, ionizing radiation metrology, nuclear data, beta spectrometry. PACS: 07.20.Mc, 29.40.Vj, 29.30.Dn, 07.81.+a, 23.40.-s, 06.20.-f
INTRODUCTION
One of the tasks in the field of ionizing radiation metrology is the determination of nuclear and atomic data. In this context, we are developing metallic magnetic calorimeters [1,2] for beta spectrometry, with the aim of determining the shape factors of beta spectra. We are particularly interested in the spectra of pure beta emitters decaying via forbidden transitions, whose spectra are difficult to calculate and often experimentally not well known. Beta spectra are generally difficult to measure with lithium drifted silicon (Si:Li) detectors or electrostatic or magnetic spectrometers due to low detection efficiency, non-linear response of the detector, or energy loss of the electrons in the source or in the dead layer at the surface of Si:Li detectors. We believe that metallic magnetic calorimeters (MMCs) with the source embedded inside the detector absorber are a very powerful means to reliably determine the shapes of beta spectra. Even if beta particles loose (part of) their energy in the source, the energy remains contained in the detector and will be detected. By choosing the absorber dimensions according to the maximum energy of the beta spectrum, a detection efficiency greater than 99 % can be realized over the entire spectrum, starting from a threshold at around 1 % of the endpoint energy. It has been demonstrated that the linearity of MMCs can be better than 0.5 % over two orders of magnitude in energy [3].
Our latest detector has been designed to measure the spectrum of 241Pu, a pure beta emitter with an
endpoint energy of 20.8 keV. This isotope is present in nuclear reactor cores and nuclear waste. As for most
pure beta emitters, its activity is commonly measured by liquid scintillation counting. This technique requires the precise knowledge of the spectrum shape in order to determine the detection efficiency. The spectrum of 241Pu is not very well known. The results
presented here make us confident that MMCs will contribute to a better knowledge of this and other beta spectra. Finally, precise determination of shape factors and comparison with calculated spectra may contribute to a better theoretical understanding of beta decay.
EXPERIMENTAL SETUP
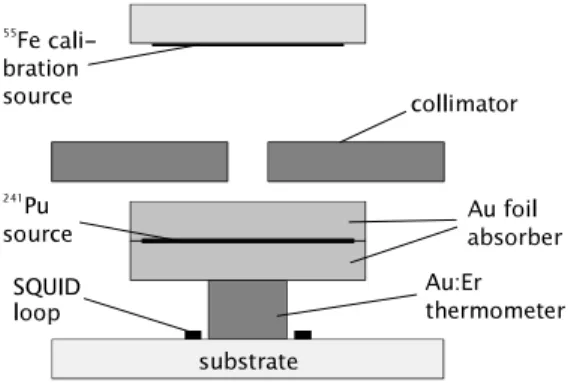
A 241Pu source has been sandwiched between two
12 µm thick gold foils serving as absorber. The source was deposited as a small drop (0.5 mg) of a plutonium nitrate solution on one of the gold foils. Prior to the deposit, we have carried out a chemical separation of
241Pu from 241Am, whose alpha emission would have
perturbed the measurement. The source activity is approximately 8 Bq. To delimit the Pu deposit, the edges of the gold foil had previously been covered with a silicon glue that was removed after drying of the solution without leaving any trace. The source was then sandwiched with a second gold foil and the two foils were diffusion welded at 400 °C. The final size of the absorber is 0.76 mm x 0.66 mm x 25 µm.
The thermometer is a cuboid (50 µm x 50 µm x 15 µm) of Au:Er (erbium concentration 900 ppm in mass). It was fixed to the absorber by ultrasonic wedge bonding, thus assuring a metallic contact and a very efficient heat transfer. The detector (absorber + thermometer) was placed on the SQUID chip, with the
thermometer being placed inside the SQUID sensing loop. The thermal link consists in a gold wire (diameter 5 µm, length 1.1 mm) wedge bonded to the absorber and to the copper detector holder. For energy calibration, an external 55Fe source was used. A
schematic of the detector setup is shown in fig. 1.
FIGURE 1. Schematic of the MMC enclosing a 241Pu
source and integrated with an external 55Fe calibration
source.
The magnetic field required to magnetize the Au:Er sensor is initially being created with a superconducting coil and then maintained by a superconducting lead ring without injection of a current from outside the cryostat. This avoids parasitic heating of the cryostat and allows keeping the magnetic field very stable.
We are using a two-stage SQUID setup with the first SQUID reading out the thermometer and the second acting as a first stage amplifier for the signal delivered by the readout SQUID. The detector together with the readout SQUID was operated in a dilution refrigerator at a regulated temperature of 16 mK. The amplifier SQUID is placed on a dedicated stage of the refrigerator and operated at 1.4 K. This temperature was also regulated in order to guarantee a stable gain.
COMPARISON OF EXPERIMENTAL
AND THEORETICAL SPECTRUM
Data was recorded continuously during 61 hours at a sampling rate of 200 kHz. For a detailed pulse shape analysis, we took additional data at a sampling rate of 2.5 MHz during 2 hours. All data analysis including triggering was done offline. The pulses had a rise time of ~ 10 µs and a decay time (1/e) of 3.5 ms. After digital filtering, applying a dead-time of 25 ms and cuts on pulse shape, and setting the (software) trigger threshold at 300 eV, the total statistics is 1.27 × 10⁶
counts. The beta spectrum (after subtracting the Mn K and K lines) contains 1.13 × 10⁶ events. The
energy resolution, as determined for the Mn K line, is 29 eV (FWHM) at 5.9 keV. In the following we compare the experimental spectrum with a theoretical spectrum.
Theoretical beta spectrum of
241Pu
We have calculated the beta spectrum of 241Pu using
the program SPEBETA [4]. The beta decay of 241Pu is
a first forbidden, non-unique transition. SPEBETA calculates the spectrum like for an allowed transition and doesn’t take into account radiative corrections. At this stage, we didn’t introduce any shape factor to the calculation. Since the aim of our work is to determine shape factors, we don’t want to use any shape factor from literature. Therefore we expect some discrepancy between the experimental and the theoretical spectrum, in particular at low energy. We consider the result of this experiment as preliminary and will use a forthcoming measurement to determine a shape factor.
Calibration by the Mn K Line
In a first attempt, we used the Mn K line for the energy calibration of the beta spectrum. Figure 2 shows the experimental and the theoretical spectrum. The theoretical spectrum has been normalized with respect to the experimental spectrum in the energy range 8 keV – 10 keV, where both spectra show the best agreement.
FIGURE 2. Experimental and theoretical spectrum of
241Pu, using the Mn K line for energy calibration.
The inset shows the full spectrum with the unclipped Mn K and K lines.
In the Kurie plot of the region around the endpoint of both the experimental and the theoretical spectrum (fig. 3), the endpoint of the experimental spectrum appears at about 21.6 keV, whereas the literature value is 20.8 ± 0.2 keV [5]. Consequently, the experimental and the theoretical spectrum diverge starting from about 12 keV.
FIGURE 3. Kurie plot of the region around the endpoint of the experimental (crosses) and the theoretical (solid line) spectrum of 241Pu, using the Mn
K line for energy calibration.
By now, we have no explanation for the shift of the endpoint in the experimental spectrum. Using both the Mn K and K lines for calibration shifts the experimental endpoint towards lower energies by 25 eV. So the measured non-linearity between these two lines cannot explain the shift by + 800 eV. From the total heat capacity of the detector (1.8 × 10⁻¹¹ JK-1 at 16 mK), we can estimate the non-linearity between 5.9 keV and 20.8 keV. The endpoint should be shifted to lower energies by ~ 0.8 % (170 eV) rather than to higher energies. In a next measurement, we shall use a calibration source emitting photons near the endpoint.
One might consider a difference of the response of the MMC to photons (calibration source) and to electrons (241Pu). Previous measurements of the beta
spectra of 36Cl [6] and 63Ni [7] with MMCs, which also relied on energy calibration by external photon sources, showed no discrepancy between the measured and the expected endpoint to within the uncertainties of the measurements. Also, we see no physical mechanism that would lead to a reduced response of the MMC to photon interactions, but not to beta
particles. In this experiment we could rather expect the opposite, as explained in the last paragraph of this paper. Finally, one may consider that the literature value of the endpoint energy could be incorrect.
Below 3 keV, both spectra diverge substantially. Given the fact that the theoretical spectrum is calculated without any shape factor, this discrepancy is not surprising.
Calibration by the Endpoint
For a better comparison of the experimental and theoretical spectra at higher energies, we have in a second attempt used the endpoint as the only calibration point. The resulting spectrum is shown in figure 4 together with the theoretical spectrum. Both spectra show very good agreement between the Mn K line and the endpoint. The discrepancy between the two spectra at low energies is, however, more pronounced than using the calibration by the Mn K line.
FIGURE 4. Experimental and theoretical spectrum of
241Pu, using the endpoint for energy calibration.
Possible Influence of the Source Quality on
the Experimental Spectrum
In a previous experiment we have carried out an absolute activity measurement of 55Fe [8, 9]. In that
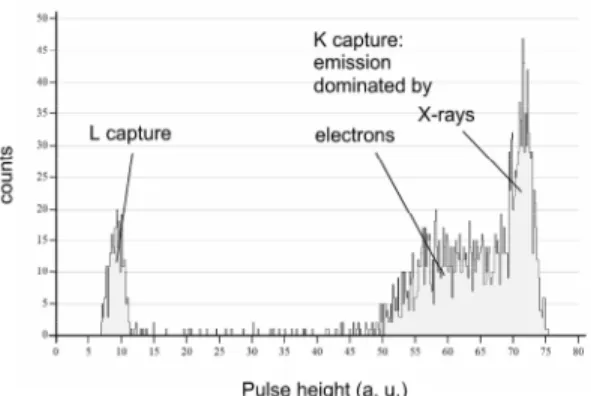
experiment we have observed a substantial difference in the response of a MMC to X-ray photons and Auger electrons. 55Fe decays by electron capture. Each
capture is followed by a rearrangement of the electron shells and by the emission of a cascade of X-rays and/or Auger electrons. For all captures on the K shell,
e. g., the sum of the energies of the particles for each cascade is 6.539 keV. Since the MMC should detect the sum energy, one expects one single line in the energy spectrum for all K captures. Instead, we have observed two sub-populations, one narrower that we could attribute to X-rays, and one wider and extending to lower pulse heights corresponding to Auger electrons, see fig. 5. We considered that X-rays are absorbed in the gold foil forming the detector absorber, whereas Auger electrons loose at least part of their energy in the FeCl3 crystals forming the
source. The heat produced in the source crystals must be transferred to the gold foil. This energy transfer was slow, the pulse rise times for the two sub-populations differed by at least a factor two. Additionally, there seemed to be a mechanism leading to a partial loss of detected energy for the Auger electrons.
FIGURE 5. Total emission spectrum of an 55Fe
source enclosed in a MMC.
The 241Pu solution from which we made the source
for the measurement of the beta spectrum contained a substance that was needed for the chemical separation of 241Pu from 241Am. Therefore the thickness of the
deposit after drying was of the order of micrometers. Virtually all beta particles loose their entire energy within the thickness of the source. Given the result of the 55Fe measurement, one has to consider if the 241Pu spectrum is not distorted by a partial loss of energy of the beta particles. This might also explain the discrepancy of the experimental and theoretical spectra at low energies. However, it seems unlikely that a distortion of the spectrum would only occur at low energies whereas both spectra are in good agreement within two third of the energy range. Our confidence in the measured spectrum is supported by the fact that, in contrast to the 55Fe experiment, the pulse shapes are
the same for X-rays and for beta particles. The energy transfer from the source to the gold absorber seems to
be much more rapid and homogenous than in the 55Fe
experiment.
Nevertheless, the quality of the source may have a minor impact on the measured spectrum. We are planning a new measurement of the beta spectrum of
241Pu with the plutonium nuclei being implanted in the
gold absorber. In this configuration, the energy of the beta particles is directly deposited in the gold absorber. We are also intending to measure the total emission spectrum of 55Fe with an implanted 55Fe source. This
should clarify if the response of a MMC is intrinsically the same for electrons and photons.
CONCLUSION
To our knowledge, we have performed the first measurement of the beta spectrum of 241Pu with a
cryogenic detector. The source was enclosed inside the gold absorber of a MMC. The measured spectrum was compared with a theoretical spectrum. We have observed a shift of the endpoint for which we have no explanation. In a forthcoming measurement we will use additional X-ray lines for energy calibration. We also observe a discrepancy between the two spectra at low energies. We attribute this discrepancy to the calculation of the theoretical spectrum without any shape factor. Since the quality of the source may have an influence on the shape of the measured spectrum, we plan to re-measure the spectrum of 241Pu with a
source implanted into the detector absorber.
REFERENCES
1. C. Enss et al., J. Low Temp. Phys. 121 (2000) 137-176 2. A. Fleischmann, C. Enss and G. Seidel, “Metallic
Magnetic Calorimeters“, in Cryogenic Particle Detectors, Topics Appl. Phys. 99, C. Enss (Ed.), Springer Berlin/Heidelberg (2005) 151 - 216
3. M. Rodrigues et al., J. Low Temp. Phys. 151 (2008) 1080 4. Internal report NT LPRI 92/307, available from P.
Cassette, LNHB, [email protected] 5. G. Audi, Nucl. Phys. A729 (2003) 337
6. H. Rotzinger et al., J. Low Temp. Phys. 151 (2008) 1087 7. S. Lausberg, Development of a Metallic Magnetic
Calorimeter for High Resolution -Spectroscopy, Diploma Thesis, University of Heidelberg (2008) 8. M. Loidl et al., J. Low Temp. Phys. 151 (2008) 1055 9. M. Loidl et al., Appl. Rad. Isot. 66 (2008) 872