HAL Id: hal-00318583
https://hal.archives-ouvertes.fr/hal-00318583
Submitted on 4 Sep 2008
HAL is a multi-disciplinary open access
archive for the deposit and dissemination of sci-entific research documents, whether they are pub-lished or not. The documents may come from teaching and research institutions in France or abroad, or from public or private research centers.
L’archive ouverte pluridisciplinaire HAL, est destinée au dépôt et à la diffusion de documents scientifiques de niveau recherche, publiés ou non, émanant des établissements d’enseignement et de recherche français ou étrangers, des laboratoires publics ou privés.
Recording and simulation of hippocampal neural
networks
Elisa Diaz Bellostas, Ricardo Escola, Pascale Pham, Régis Guillemaud,
Guillaume Becq, Pierre-Olivier Amblard, Catherine Villard
To cite this version:
Elisa Diaz Bellostas, Ricardo Escola, Pascale Pham, Régis Guillemaud, Guillaume Becq, et al.. Recording and simulation of hippocampal neural networks. 6th international meeting on substrate-integrated micro electrode arrays, Jul 2008, Reutlingen, Germany. pp.123-124. �hal-00318583�
Signal Analysis and Data Mining
ISBN 3-938345-05-5
6th Int. Meeting on Substrate-Integrated Microelectrodes, 2008 123
Recording and simulation of hippocampal neural
networks
Elisa Diaz Bellostas
1,2, Ricardo Escola
2, Pascale Pham
2, Régis Guillemaud
2*, Guillaume
Becq
3, Pierre-Olivier Amblard
3, Catherine Villard
11 Institut Néel, Université Joseph Fourier CNRS, Grenoble, France
2 CEA/LETI/DTBS - Direction de la Recherche Technologique, Grenoble, France 3 Department Image and Signal, Gipsa-lab CNRS, Grenoble, France
* Corresponding author. E-mail address: regis.guillemaud@cea.fr
In order to simulate the spiking activity of in-vitro neuron networks recorded by MEA, the engine SIMONE (Statistical sIMulation Of Neuronal networks Engine) has been updated and used. SIMONE has been originally designed to produce realistic extracellular signals used as input data for the valida-tion of spike detecvalida-tion and sorting algorithms. The aim of this study is to compare simulated with measured spikes trains. We present different simulations based on the architecture of a real network composed by 14 neurons grown around one electrode. The comparison between real and simulated data is quantitatively performed using different spike detection tools based on thresholding or wavelet analysis. A careful adjustment of SIMONE parameters allows to reproduce the spontaneous bursting pattern of this real network while further investigations emphasize the role of synaptic noise in network activity.
1 Methods
For experimental measurements, neurons from mice embryo hippocampus are grown on a MEA cov-ered by polylysine and observed 24 days after plating.
The code SIMONE [1] simulates the spiking ac-tivity of a neuronal network measured by a MEA. It is built using the R environment, an open source ver-sion of the well-known S language [2]. SIMONE's dynamic model is based on two coupled stages : (i) each neuron is represented by the leaky integrate-and-fire (LIF) model [3], with spike waveforms generated from templates, (ii) the extracellular detection is mod-eled via an electrode gain while the neural signal at-tenuation versus the distance to the electrode is de-scribed by a pseudo-monopole of current in the ex-tracellular medium.
The user can define different distributions, functions and parameters to describe the desired neural network and the associated electrodes (an unique electrode in our case, with a distribution of surrounding cells simi-lar to the real case). Three types of currents are taken into account here to feed the LIF model: synaptic cur-rent, noise current and self-induced current. The last one models the recovery dynamics, not included in the classical LIF model, and shape the bursting regime [4]. The overall model may be fully parametrized us-ing stochastic functions.
2 Results
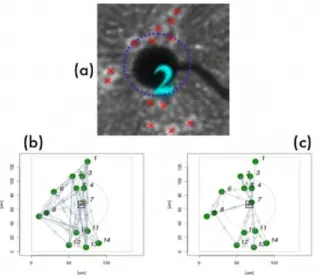
Real and simulated networks are shown in Fig. 1. The so-called simulated network 1 is made from ran-dom connections while network 4 is built from
uni-directional connections. The small population (6%) of inhibitory compared to excitatory neurons in the hip-pocampus [5] yields the presence of only one inhibi-tory neuron in the center of network 1. Three neurons are within the detection range of the electrode while the remaining eleven cells compose the surrounding network.
Fig. 1. (a) real network geometry; (b) simulated network 1; (c)
simulated network 4. The centre of the electrode is represented by the square label “e1”. Green (yellow) spots represent excitatory (in-hibitory) neurons. The blue circle in a) and the grey circles in b) and c) represent the range of electrode detection (70 m). They enclose three neurons actually detected by this particular electrode “e1”.
Activity of these networks with a Inoise contributing to
only 8% of the total current is given in Fig.2. Inoise
Signal Analysis and Data Mining
ISBN 3-938345-05-5
124 6th Int. Meeting on Substrate-Integrated Microelectrodes, 2008 delay between the start of the simulation and the
be-ginning of the spiking activity, showing an oscillating behaviour (Fig.3). The mean spiking rate is typically multiplied by a factor of 3.5 between the values 5% and 15% of Inoise (network 4).
Fig. 2. Signals before and after a wavelet filtering are shown with
Inoise=8% of the synaptic current and Iself=0. (a) Real network; (b)
network 1; (c) network 4.
References
[1] R. Escolà, C. Pouzat, A. Chaffiol, B. Yvert, I. E. Magnin, R. Guillemaud (2008), SIMONE : A Realistic Neural Network Simulator to Reproduce MEA-based Recordings, IEEE trans-actions on neural and rehabilitation engineering, 16(2),149-60
[2]
[3] W. Gerstner W. Kistler (2002), Spiking neurons models, Cam-bridge University Press.
[4] L. Paninski, J. W. Pillow, E. P. Simoncelli (2004), Maximum likelihood estimation of a stochastic integrate-and-fire neural encoding model, Neural Comput. 16, 2533-2561.
[5] D.L. Benson, F.H. Watkins, O. Steward, and G. Banker (1994), Characterization of GABAergic neurons in hippocampal cell cultures, J. Neurocytol. 23, 279-295.
Fig. 3. Spiking activity of networks 1 and 4 with different Inoise
dur-ing 50 ms (500 samples).
Tuning Iself and adjusting Inoise yields a remark-able similarity between the simulated and the real networks (Fig.4).
Fig. 4. (a) Real signal with the spike detection. Many burst can be
noticed; (b) Iself used for the simulation of the real signal (a); (c)