HAL Id: halshs-00567662
https://halshs.archives-ouvertes.fr/halshs-00567662
Preprint submitted on 21 Feb 2011
HAL is a multi-disciplinary open access archive for the deposit and dissemination of sci-entific research documents, whether they are pub-lished or not. The documents may come from teaching and research institutions in France or abroad, or from public or private research centers.
L’archive ouverte pluridisciplinaire HAL, est destinée au dépôt et à la diffusion de documents scientifiques de niveau recherche, publiés ou non, émanant des établissements d’enseignement et de recherche français ou étrangers, des laboratoires publics ou privés.
The Black Man’s Burden - The cost of colonization of
French West Africa for French taxpayers
Elise Huillery
To cite this version:
Elise Huillery. The Black Man’s Burden - The cost of colonization of French West Africa for French taxpayers. 2009. �halshs-00567662�
WORKING PAPER N° 2009 - 22
The Black Man’s Burden - The cost of colonization of
French West Africa for French taxpayers
Elise Huillery
JEL Codes: N10, O16, H50
Keywords: colonization, public finances, West Africa
P
ARIS-
JOURDANS
CIENCESE
CONOMIQUESL
ABORATOIRE D’E
CONOMIEA
PPLIQUÉE-
INRA48,BD JOURDAN –E.N.S.–75014PARIS TÉL. :33(0)143136300 – FAX :33(0)143136310
“The Black Man’s Burden - The cost of colonization of
French West Africa for French taxpayers”
Elise Huillery1
Abstract
Was colonization very costly for the metropole? This view has been widely accepted among French historians, even though little empirical evidence has been provided. Using original data from the colonial budgets of French West Africa (AOF), this paper provides new insights into the actual colonial public funding in this part of the French empire. Comparing the financial transfers from the metropole to AOF to total metropolitan expenses reveals that the cost of colonization of the AOF for French taxpayers was extremely low: French subsidies to the AOF represented on average 0.007 percent of total metropolitan expenses. From the AOF side, financial transfers from the metropole were not that beneficiary since French subsidies represented on average 0.4 percent of total local revenue. Including the public loans and cash advances from the metropole does not change this general pattern. West Africans therefore funded most colonial public investments, which reveal to be very small. One reason for the scarcity of public investments is the cost of French civil servants serving in the colonies, which turned out to be a considerable burden for Africans: French government officials alone represented 20 percent of total local public expenses.
Key words: colonization, public finances, West Africa JEL classification: N10, O16, H50
The question of the costs and benefits of colonization for France and its colonies has been largely debated in France recently, since the parliament adopted a law imposing that the positive role of colonization would be explicitly recognized in French history textbooks
1
Paris School of Economics (PSE) and DIAL (IRD), 4, rue d’Enghien, 75010 Paris. Email: huillery@dial.prd.fr.
I am grateful to Denis Cogneau and Thomas Piketty for valuable advice and guidance throughout this project. I also thank participants to the seminars at DIAL and the Paris School of Economics for all their comments and suggestions. I am greatly indebted to Urbain Kouadio, whose help in “BNF” (Paris) has been a key factor in writing this paper. Historical data used in this paper has been collected by Elise Huillery [the author] within the research project "Long Term History and Resources Distribution in Africa" directed by Denis Cogneau (IRD, DIAL, Paris). Financial support from the French Ministery of Research is gratefully acknowledged. Martine Lorenzo, Angélique Roblin, Xavier Midon and Angelina De Baecque have provided excellent research assistance for archive extraction.
(February 23th, 2005). The law was finally amended after several weeks of an intense debate among both academic historians and civil society. Opinions on the costs and benefits of colonization diverge dramatically: On the one hand, some scholars claim that colonies were very expensive for French taxpayers since the metropole funded large public investments in education, health and infrastructure in the colonies (Bloch-Lainé, 1956; Jeanneney, 1963; Marseille, 1984; Lefeuvre, 2005). This literature also claims that the metropolitan private sector also suffered from colonization because some private investments fled towards the colonies. Moreover, returns on colonial investments were not as high as expected (Marseille, 1984). Marseille (1984) also argues that colonial trade had negative externalities on the modernization of national productive sectors, because lack of competition had perverse effects on innovation and competitiveness. This view pays little attention to the costs or benefits on the colony side, but the implicit – sometimes explicit -- view is that colonies at least benefited from these public and private investments (Marseille, 1996; Lefeuvre, 2005).
On the other hand, some scholars claim that French productive sectors benefited greatly from colonial experience thanks to low cost imports, especially agricultural imports and a protectionist commercial policy which gave a large advantage to French exports to the colonies (Arghiri, 1969; Vanhaeverbeke, 1970; Amin, 1971; Amin, 1973). A number of recent history books denounce the more general extractive strategy of France in the colonies, which affected not only the colonial economy but also colonial politics, and shaped poor-quality governance and institutions (Ferro, 2003; Liauzu, 2004; Le Cour Grandmaison, 2005; Blanchard, Bancel et Lemaire, 2005; Manceron, 2005).
Both views are supported by little and incomplete evidence and leave a large share to opinion and interpretation. A team of French economic historians, supervised by Jean Bouvier and Catherine Coquery-Vidrovitch2, collected colonial budget data. François Bobrie and Catherine Coquery-Vidrovitch produced some evidence on the financial transfers between the metropole and the colonies, but unfortunately the analysis remained incomplete (Bobrie, 1976; Coquery-Vidrovitch, 1973 and 1982). Jacques Marseille has been credited as the one who provided a final answer to the question of the cost of colonization for French taxpayers when he published his dissertation in 1984 (Marseille, 1984), but his analysis is not based on reliable evidence and therefore remains unconvincing (Huillery, 2009). New insights in the colonial
2
Recherche Coopérative sur Programme (RCP), CNRS, « Commerce, investissements et profits dans l’empire colonial français », n°326, 1973-1979.
costs and benefits are therefore needed, and this paper is an attempt to fill the gap. Using a new dataset on the financial transfers between the metropole and AOF, the paper calculates the actual cost of colonization of French West Africa for French taxpayers. I collected budgetary data from 1898 to 1957 at the local and federal levels so as to get comprehensive information on financial transfers in both directions –from the French national budget to colonial budgets and from colonial budgets to the French national budget. Results show that the financial transfer balance from the metropole to AOF was surprisingly low: on average 0.1 percent of total metropolitan public expenses were devoted to this part of the colonial empire, including both subsidies and loans. Since loans are not a cost per se but rather an investment, that is reimbursements continued to be paid by former colonies to France after independence, I calculate the aid component of loans so as to determine the metropolitan public aid to AOF, which is the actual cost for French taxpayers. Results show that the metropolitan public aid to AOF represented on average 0.007 percent of total metropolitan public expenses.
On the French West African side, the metropolitan financial transfers were not as beneficiary as is often presented by some historians (Marseille, 1984; Lefeuvre, 2005). The metropolitan public aid accounted only for 0.4 percent of total local public revenue. In addition to subsidies, the metropole also offered West African officials the opportunity to borrow some financial resources abroad. Including public loans and cash advances, which were systematically reimbursed in due time during colonial times as shown by colonial budgets, total metropolitan financial transfers represented on average 5.7 percent of total local public revenue. Even with resources borrowed abroad, taxes collected from locals and local economic activities, mainly poll tax and duties, accounted therefore for the quasi-totality of local public revenue.
This can explain why public investments in French West Africa were so scarce: budget data show that there were only 1,000 teachers, 1,400 doctors and 300 schools on average all over the territory from 1907 to 1956. Some infrastructure was constructed, mainly to serve transportation of local products from inland to costal export seaports. However, my data show that the final amount devoted to infrastructure remained very low. The scarcity of colonial public investments can be explained by the scarcity of financial transfers from the metropole. Nevertheless, the analysis of colonial budgets gives another crucial explanation: the cost of colonial public goods itself, which turned out to be very high compared to the low financial capacity of the local population. French teachers, doctors and administrators were actually
charged on local colonial budgets, rather than on the metropolitan budget. Budget data show that French civil servants’ salaries were disproportionally high compared to local incomes. To shed a simple insight on this question, governors, district administrators and their respective cabinets altogether accounted for 20 percent of total local public expenses. The colonial system therefore reveals to have been more of a black than white man’s burden.
This paper attempts to clarify the debate on the costs and benefits of French colonization, from both the metropolitan and West African points of view. With respect to the existing literature, the paper innovates in using original and first-hand budgetary data on the whole colonial period. I also distinguish subsidies (public aid) from loans and cash advances (investments), which was a reason why the budgetary cost of colonization has been misinterpreted in the past. Moreover, the paper considers both transfers from the metropole to AOF and transfers from AOF to the metropole which, when ignored, caused another misleading caveat in the existing literature. Finally, the paper does not make any assumptions in the calculation of financial transfer balance from the metropole to AOF, and provides full information on colonial public investments, as opposed to the leading part of the existing literature. The paper therefore provides a reliable and comprehensive view on the colonial public funding system and public investments in French West Africa. Yet an important limitation of the paper is the restricted geographical coverage. The results on French West Africa should be considered as specific until a more extended study is performed on the whole French colonial empire. It seems likely that North Africa, especially Algeria, might have experienced a different – more generous -- colonial funding system.
This paper is structured as follows: Section 1 presents the organization of French colonial public funding. Section 2 presents data sources and gives a description of collected data. Section 3 shows how low the cost of AOF colonization was for French taxpayers, whereas Section 4 shows how low the benefits of AOF colonization were for West Africans. Section 5 gives evidence on colonial public investments and gives some explanations to their scarcity. Section 6 concludes.
I. The Organization of French Colonial Public Funding
French colonial public funding was based on three levels of budgets: the metropolitan level, the federal level and the local level (Figure 1). This section provides a description of how funds were distributed over these three levels of budget in the case of French West Africa.
At the metropolitan level, two types of funds were distributed by the national budget: military expenses and civil expenses. Military expenses, related to the colonial conquest and pacification, were all charged on the national budget (budgets of the Ministry of Colonies and the Ministry of Navy forces mainly). These expenses corresponded to military personnel salaries, accommodation and transport, and military material. Civil expenses, related to running costs and equipment expenses in the colonies, were mostly supported by the federal and local budgets. Only few running costs were supported by the national budget: central administration in the metropole (the Ministry of Colonies, Geographical Unit, Inspection Units and Registration Units), communication costs (mails, telegraphs) and advertisement costs (propaganda material, grants to emigrants to the colonies, grants to the school for colonial officials (ENFOM), the colonial exhibitions). As to the equipment in the colonies, the national budget included three kinds of expenses: subsidies to the public sector (federal budgets, local budgets or public companies) and subsidies to the private sector. Note that in French West Africa, there was only one private railway company which received subsidies from the metropole: La Société des Batignolles, which constructed the line Dakar-Saint-Louis from 1882 to 1885. All the other railway lines (Thiès-Kayes-Koulikoro, Conakry-Kankan, Abidjan-Ouagadougou and Porto-Novo-Cotonou-Parakou) were constructed by public railway companies.
At the federal level, the federal budget received revenue from both federal taxes, mostly trade taxes and fiscal taxes, and metropolitan taxes: subsidies from the national budget. The federal budget covered the running costs of federal administration (federal personnel salaries, material and furniture), and also some equipment expenses related to large-scale infrastructure like trans-colonial railways and seaports). The federal budget also provided some funds towards the metropole: public loans repayments, cash advances repayments and subsidies. Finally, the federal budget provided some subsidies to the colonies and to private companies.
At the local level – the level of the colonies, the budget received almost all of its revenue from local taxes, plus subsidies from the federal budget. Local budgets covered all the running costs related to local colonial administration: the government of the colony and the administration of districts and subdivisions, the costs of judicial processes, security and treasury, the costs of public support to agricultural and industrial activities, and the costs of public investments at the local level: education, health and infrastructure.
Figure 1 – Structure of Colonial Public Funding
Metropolitan Budget
Local Budget
Loan Bugdets
Local Budget Local Budget Local Budget
Federal Budget Auxiliary Budgets
Subsidy
Cash Advance
Loan
To complete this simple description of the structure of colonial public funding, two other budgets were created at the federal level in addition to the federal budget: first, the “loan budget”, whose revenue was based entirely on public loans contracted with the metropole. Funds from loans were allocated to large-scale infrastructure, and marginally to investments in health and education. The second additional type of budget at the federal level was the “auxiliary budgets”, devoted to the accountability of public companies like railway companies, the port of Abidjan, the port of Dakar and the port of Conakry. The revenue of these auxiliary budgets were four-fold: subsidies and cash advances from the federal budget,
subsidies and cash advances from the national budget, cash transfers from the loan budget and finally self-generated resources from the company’s activities.
The organization of French colonial public funding therefore reflects the fundamental principle adopted by the law of April 13th 1900, entitled “Loi d’autonomie financière des colonies” (law of financial autonomy of the colonies). All the running costs and equipment expenses in the colonies were supported by the federal and local budgets, except some subsidies that could be given to the colonies from the national budget. The national budget also offered some cash advances to the federal budget when needed, which were reimbursed in a short delay with an interest rate. All the subsidies and cash advances from the national budget to the French West African public sector are therefore reported as revenue in the federal and auxiliary budgets, whereas all public loans from the metropole are reported as revenue in the loan budgets (note that the loan repayments were covered under the federal budget).
In this paper, I will consider data from the “territorial” budgets: federal, loan, auxiliary and local budgets, from 1898 to 1957. I do not consider data from the national budget. Those expenses related to colonization that are not reported on these territorial budgets are therefore ignored. According to the structure of colonial public funding, these expenses are: military expenses for conquest and pacification, central administration expenses in France, communication expenses, advertisement expenses and the metropolitan subsidies to the Société des Batignolles. These expenses were therefore devoted to French personnel and French activities only, except military expenses which have an ambiguous status: it is not clear that the military expenses can be attributed to the cost of colonization, since they supported French military officials and the French military productive sector; The military expenses did not benefit the Africans. The question of whether the military expenses should be included in the cost of colonization for French taxpayers remains therefore debatable. In this paper, I decided to have them excluded but it might be useful to work in the future on a separate accountability of the military expenses.
II. Data
A. Data Sources
I collected data from four types of budgets: federal, loan, auxiliary and local. All these budgets can be found at the National Archives of Senegal, Dakar, and also at the Bibliothèque Nationale de France, Paris. In Dakar, access to budgets is easy, whereas in Paris it is more difficult because budgets are not publicly available when they are judged too old and fragile. Finally, few volumes of the federal budgets can be found at the Centre des Archives Economiques et Financières à Savigny-le-Temple, but only for few dispersed years.
The documents are organized by year. For each year, two types of budgetary documents exist: a budget established before the beginning of the year expressing anticipated provisions and a final account established after the end of the year described realized costs. When possible, I used final accounts rather than anticipated budgets because they reflect what really happened in terms of revenue and expenses. But for disaggregation purposes, I used anticipated budgets rather than final accounts at the local level, since the local budgets report data at the district level whereas the final accounts report data at the colony level.
B. Data Description
I first constructed a dataset which entails local budgetary data by year and by colony. Using disaggregated data allowed me to compute budgetary data by colony even when colonies split or when borders moved a little bit: for instance, Upper Volta was suppressed from 1932 to 1947 and its districts were distributed among the Ivory Coast, Niger and Mali. In 1947, Upper Volta whas reunified. Thanks to district level data, I was able to construct the amount of expenses and revenue corresponding to Upper-Volta between 1932 and 1947 even if there were no budgetary data for Upper Volta during this period of time. Because collecting data at the district level was over the time I had, I did not collect data from the local budget for every year of the colonial period, but for 25 years: 1907-1920, 1923, 1925, 1928, 1930, 1933, 1936, 1939, 1943, 146, 1949, 1953 and 1956. Data are presented in two categories: revenue and expenses. Among the components of local revenue, I reported all main direct taxes (personal tax, prestations, income tax, land tax, residential tax, tax on trading license, tax on cattle and
tax on turnover), total direct taxes and total revenue. Among the components of local expenses, I reported: administrative staff, security staff, education staff, the number of schools and pupils –when available, doctors and nurses, expenses for public works, indemnities to pre-colonial chiefs, number of African chiefs and finally African chief salaries and primes.
The other dataset I constructed from the federal, loan and auxiliary budgets entails expenses and revenue at the federal level by year. The data come from final accounts so they represent realized expenses rather than anticipated provisions, for every year from 1907 to 1957 (1898 to 1957 for the auxiliary budgets, and 1903 to 1957 for the loan budgets). Among the components of federal revenue, I reported: indirect taxes (trade taxes, tax on consumption, registration fees and transaction fees), receipts from public companies (mail, phone, telegraph, railways and ports, hospitals and printing works), financial income (yields from capital investments, loan and cash advances reimbursements, land revenue), financial transfers from the metropole (loans, cash advances and subsidies), total indirect taxes and total revenue. Among the components of federal expenses, I reported: financial transfers to the metropole (loans repayments, cash advances repayment and subsidies), subsidies to local budgets and private companies, infrastructure, aid to productive sectors, expenses in education, health, security and justice, the costs of public services (mail, phone, telegraph, hospital, printing works, railways and ports) and finally the costs of federal administration. I reported all components of the revenue of loan budgets: loan disbursements from the metropole, cash advances and subsidies from the metropole and from the federal budget. I reported the expenses of loan budgets by category: infrastructure, education, health and aid to productive sectors. Finally, I reported the revenue of the auxiliary budgets by category: receipts from their own activities, cash advances and subsidies from the metropole, and cash advances and subsidies from the federal budget.
The time period over which I collected data from the budgets is as large as possible. Data from auxiliary budgets are complete. Data from loan budgets are complete except two missing points in 1918 and 1938. Finally, data from the local and federal budgets were collected from 1907 only because before this year, either budgets do not exist, that is the civil administration was not running everywhere over the territory until 1907, or because budgets cannot be accessed because of their old and fragile state. Finally, 1958 was the date when the 5th Republic was established in France and when the French colonial empire’s status changed from ‘French Union’ to ‘French Community’. As a federation, the French Community gave a
real autonomy to colonies which notably became ‘States’ governed by African heads of State. Guinea decided to leave the French Community in 1958, as did Mali in 1959, and then all colonies acceded independence in 1960. Budgets after 1958 are absent in the colonial archives since each new State had from then on its independent accounting system. After 1958, financial transfers from France to Africa were considered as public aid rather than colonial funding.
Because budgetary data are monetary variables, I corrected data using 1914 Francs as a reference unit. I used a deflator from INSEE. This allows me to compare the results with the existing literature since main papers on the cost of colonization express monetary values in 1914 Francs.
III. How expensive was colonization of AOF for French
taxpayers?
Who paid for French colonial public funding? Direct costs of colonization for France appears to be mostly unknown in existing studies as quantitative data are still missing to evaluate the cost of colonization for French taxpayers. Jacques Marseille and Daniel Lefeuvre call colonies “expensive” and colonization a blach hole, while François Bobrie and Catherine Coquery-Vidrovitch reported a rather small public transfer from France to colonies. I will thus consider actual public transfers between France and AOF in this section.
A. Financial Transfers from the Metropole to AOF
Public transfers between France and AOF during colonial times were of three types: i) loans ii) cash advances due to temporary lack of resources and iii) subsidies. Loans were credited to the loan budget. Advances and subsidies were credited to the federal budget and auxiliary budgets. Conversely, local budgets did not receive any transfer from the metropole.
Table 1 shows all public transfers between 1898 and 1957 from the metropole to AOF. In 60 years of colonization, 1.3 billion (1914 Francs) were transferred from the metropole to AOF.
Table 1: Financial Transfers from the Metropole to AOF, 1898-1957 1914 Francs (Million)
Loan 509.7
Cash Advance 547.2
Subsidy 247.1
Total 1 304
Loans accounted for 39% of total transfers from the metropole to AOF. Cash advances accounted for 42% and subsidies for 19%. The part of metropolitan financial transfers which were recovered through repayments – loans and cash advances -- represented 81% of total metropolitan financial transfers.
Graph 1 shows the evolution of all three types of metropolitan transfers to AOF from 1898 to 1957. It is clear that loans were the unique form of transfer until 1940, and remained the main form of transfer between 1940 and 1945. They totally disappeared after 1946 and were replaced by cash advances and subsidies. The increase in advances and subsidies after 1946 is explained by the creation of a fund dedicated to large scale infrastructure and equipment in colonies in 1946 : the Fond d’Investissement pour le Développement Economique et Social (FIDES). Subsidies actually remained limited, except in 1949 when they reached 80 million (1914 Francs). Beyond this exceptional year, subsidies from the metropole never exceeded 25 million (1914 Francs), and were above 20 million in only 3 years (1941, 1948 and 1957). Thus, during the last decade of colonization, cash advances from the metropole to AOF replaced loans: after 1946, 73% of transfers were cash advances and only 27% were subsidies.
Graph 1 0 2 0 4 0 6 0 8 0 1 0 0 1900 1920 1940 1960
Loan Cash Advance
Subsidy Total
1914 Francs - Million
Financial Transfers from the Metropole to AOF
As a whole, France transferred 1.304 billion 1914 Francs to AOF, with 697 million (53%) after 1946 and 1.057 billion (81%) as loans or cash advances to be repaid by AOF.
B. Financial Transfers from AOF to the Metropole
Public transfers from AOF to the metropole during colonial times were of three types: i) repayment of loans, ii) repayment of cash advances, and lastly iii) subsidies. All these transfers were exclusively charged on the federal budget. Most subsidies from AOF to the metropole were intended to contribute to metropolitan expenses: military expenses, Parisian central administration expenses and other metropolitan services. After 1945, these subsidies were not only meant to cover the cost of colonization in the metropole, but also to help finance expenses for French reconstruction and various metropolitan organizations such as the Ecole Coloniale, ORSTOM, or the Cité Universitaire Internationale in Paris.
Total transfers from AOF to the metropole between 1907 and 1957 reached 572 million 1914 Francs. These transfers can be detailed as follows:
Table 2: Financial Transfers from AOF to the Metropole, 1907-1957 1914 Francs (Million)
Loan Repayment 228.5
Cash Advance Repayment 145.1
Subsidy 198.3
Total 571.9
Graph 2 illustrates the evolution of financial transfers from AOF to France. The evolution is similar to that of financial transfers from the metropole to AOF: until the early 1940s, repayments of loans represent the main part of the transfers from AOF to the French State, being replaced after 1945 by subsidies and repayments of cash advances. So it appears that transfers between the metropole and AOF followed identical trends both in nature and amount: the more metropolitan loans, the more AOF loans repayments. More surprisingly, the more metropolitan subsidies, the more AOF subsidies.
Graph 2 0 1 0 2 0 3 0 4 0 5 0 1910 1920 1930 1940 1950 1960
Loan Repayment Cash Advance Repayment
Subsidy Total
1914 Francs - Million
Financial Transfers from AOF to the Metropole
As a whole, AOF transferred almost 572 million 1914 Francs to the metropole. Repayments of loans represent 40% of total transfers from AOF to the metropole, subsidies 35% and repayment of cash advances 25%.
C. Financial Transfer Balance from France to AOF
What is the financial transfer balance from the metropole to AOF? First we have to make a hypothesis on missing data between 1898 and 1906. The hypothesis is that there were no financial transfers from AOF to the metropole from 1898 to 1906.
The metropole transferred more to AOF than AOF did to the metropole: the transfer balance from the metropole to AOF amounts to 732 million 1914 Francs. As Graph 3 shows, the metropole became a creditor of AOF structurally after 1931. During the first half of the colonial period, the financial transfer balance from the metropole to AOF is alternatively positive and negative. It is surprising to find out that colonies have been from time to time creditors of the metropole, as it is rarely, if not ever, the idea one has.
Graph 3 0 2 0 4 0 6 0 8 0 1900 1920 1940 1960 1914 Francs - Million
Financial Transfer Balance from the Metropole to AOF
After successive loans at the beginning of the century (the first four loans of AOF were signed in 1903, 1907, 1910 and 1913) that allowed significant transfers from the metropole to AOF, came a relatively long period of repayments from 1913 to 1930 when transfers from AOF to the metropole dominated. The second (and last) period of loans that took place in 1931 and 1932 again initiated a period of positive balance from the metropole to AOF in the 1930s. After World War II, a period of subsidies and more significant cash advances developed from France to AOF. So it was really a post-war colonial policy and the willingness to invest in colonies equipment, made evident through the creation of FIDES, that ensured that the metropole would have a positive transfer balance with AOF at the end of the colonial period. Until 1945, the main principle was that of the 1900 law that called for the financial autonomy of the colonies: transfers between the metropole to AOF almost matched transfers from AOF to the metropole.
A more detailed analysis of the composition of the transfer balance between France and AOF shows that this principle did not totally disappear after 1945. It seems to be important to distinguish between transfers, financial investments and subsidies. Indeed, post-colonial repayments of loans and cash avances are not part of my calculations and artificially increase
the financial cost of AOF for the metropole. Rather, the cost of colonization for the metropole is limited to the subsidy balance from the metropole to AOF, along with the “aid component” of loans and cash advances from the metropole to AOF. In fact, loans and cash advances do not have to be considered as costs except if they integrate some favourable financial conditions: the concept of an “aid component” of loans was first introduced in 1969 by the OECD. A minimum 25 percent of an “aid component” is required so that a loan can be considered public aid. To evaluate public aid from the metropole to AOF, I thus use the international definition given by OECD.
Cash advances conceded by the metropole to AOF after 1946 came with an interest rate of 3 to 4 percent. Being short term loans of only a few years, they do not allow the “aid component” to surpass 10 percent3. The interest rate for all six loans contracted by AOF from the metropole varied from 5 to 6.5 percent. Terms varied from 30 to 50 years. None of these loans had an aid component above 25 percent, the highest one being 17 percent for the 1903 loan. According to international definitions adopted in 1969, public aid from the metropole to AOF is then limited to subsidies from the metropole to AOF. Graph 4 shows the evolution of the subsidy balance from the metropole to AOF, which is then the public aid from France to that territory.
As we can see in Graph 4, public aid given by the metropole to AOF is not very often positive during colonial times. Until 1941, subsidies from AOF to the metropole have often been superior to subsidies from the metropole to AOF. Overall, the subsidy balance between the metropole and AOF is positive, but only amounts to 48.8 million 1914 Francs. The year 1949 by itself explains this positive balance: with a subsidy balance of 73 million 1914 francs between the metropole and AOF. Indeed, the year 1949 is the only year when AOF benefited from a very high subsidy – on account of FIDES.
The principle of financial autonomy of the colonies in AOF was mostly maintained after World War II. The metropole slightly increased the amount of subsidies given to AOF (see Graph 1) but in a “give and take” logic since at the same time, subsidies from AOF to the metropole also increased (see Graph 2). One cannot say that colonies were a financial black hole, as some historians do. France gave AOF 48.8 million of 1914 francs in public aid
3
To calculate the “aid component” of loans and cash advances, I used the online IMF service:
between 1898 and 1957. Out of the financial transfer balance of 732 million 1914 francs, only 7% were subsidies. Graph 4 -2 0 0 2 0 4 0 6 0 8 0 1900 1920 1940 1960 1914 Francs - Million
Public Aid from the Metropole to AOF
D. Were these Transfers Burdensome for French Taxpayers?
Bobrie (1976) estimates that metropolitan expenses devoted to the colonies from 1850 to 1913 accounted for somewhere between 3% and 7% of total expenses. But his paper overestimates the cost of the colonies for French taxpayers since it does not take into account the financial transfers from the colonies to France, especially transfers from Algeria whose fiscal revenue was full translated into into metropolitan revenue. Moreover, this estimate includes the costs of central administration in France, as well as military expenses whose status is ambiguous.
Marseille (1996) estimates that metropolitan expenses devoted to the colonies accounted for 8% of total expenses in the twenties, and 9% of total expenses from 1945 to 1962. But this estimation is based on the assumption that all trade deficits of the colonies towards France were compensated by equivalent financial transfers from France to the colonies. It is not clear whether these financial transfers were public or private financial transfers, and whether they
were loans and cash advances (which are investments) or subsidies. Moreover, the assumption needs to be verified because there are ways by which colonial trade deficits could be paid other than financial transfers from France. Therefore, evidence from actual budgets is needed.
The dataset used in this paper presents all financial public transfers from the metropole to AOF. Data on all metropolitan expenses come from the Annuaire Statistique de la France4, which reported budgetary data from the Ministry of Finance. Graph 5 shows that metropolitan expenses devoted to AOF never exceeded one percent of total metropolitan expenses: the maximum share occurred in 1898, when the metropolitan cash advance to fund the construction of the railway line Kayes-Niger accounted for 0.96 percent of total metropolitan expenses. On average over 1898-1957, the share of total metropolitan expenses devoted to AOF is 0.001. Among these expenses are loans and cash advances that cannot be considered as a cost. Considering subsidies only, the share of total metropolitan expenses devoted to AOF is 0.00007. It is therefore very clear that AOF was not burdensome for French taxpayers.
Graph 5 0 .5 1 Pe rc e n ta g e Po in ts 1900 1920 1940 1960
All Transfers Public Aid Only
1914 Francs - Million
Net Transfers from the Metropole to AOF as a share of
Metropolitan Public Expenses
4
IV. How Beneficiary was Colonization for AOF?
A. Metropolitan Financial Transfers versus AOF Local Public Revenue
The question now is whether these few financial transfers from the metropole represented an significant benefit for AOF. There is a large consensus in France regarding the idea that metropolitan financial transfers to the colonies funded most of public investments there. It is indeed possible that public colonial financial transfers did not cost much for French taxpayers but still accounted for a large part of local revenue.
To answer this question, I gathered all data from local, federal, loan and auxiliary budgets to calculate AOF’s total revenue. At the federal level, most of the revenue came from trade taxes (68 percent on average over 1907-1957). Nine percent came from own generated income (receipts from public companies and financial yields). Nine percent came from metropolitan cash advances and subsidies. Revenue for the loan budget came from loan disbursements from the metropole (64 percent of total revenue over 1903-1957), while the 36 percent left came from cash advances and subsidies from the metropole and the federal budget. Revenue for auxiliary budgets came mostly from receipts from their own activities (92 percent of total revenue over 1898-1957), while the eight percent left came from cash advances and subsidies from the metropole and the federal budget.
At the local level, most local revenue came from direct taxes (54 percent on average over 1907-1957). The rest of the local revenue came from indirect taxes and subsidies from the federal budget. Most direct taxes were based on individuals, that is personal taxes: capitation, “prestations”, residential tax and income tax. Personal taxes account for 44% of total local revenue over 1907-1957. Finally, among personal taxes, the most important tax was capitation, which was equal for all individuals whatever their income and wealth. Capitation accounts for 39 percent of total local revenue over 1907-1957. Income tax, which was introduced in 1933 in AOF, did not catch up with capitation: in 1956, income tax accounted for 25 percent of personal taxes whereas capitation accounted for 75 percent of personal taxes. The general picture that emerges from budget data is that local people, especially poor people, contributed significantly to public funding during colonial times.
Graph 6 shows the evolution of AOF total public revenue from 1907 to 1957. The overall growth of AOF total revenue was slow from 1907 to 1945, with two significant recession periods corresponding to the two World Wars. The decrease in AOF total revenue during the two World Wars was due to the decrease in trade taxes at the federal level as a consequence of worldwide trade contraction.
Graph 6 0 2 0 0 4 0 0 6 0 0 8 0 0 1 0 0 0 1900 1920 1940 1960
Local Budgets Federal Budget Total
1914 Francs - Million
AOF Public Revenue - Total
After 1945, the growth of AOF total revenue is spectacular: it was multiplied by five in 13 years. Both federal revenue and local revenue grew fast during this period, federal revenue in a higher speed than local revenue, though.
The financial transfers from the metropole to AOF accounted on average over 1907-1957 for 0.057 of AOF total revenue. Graph 7 shows that this share varied a lot across the periods, from +0.25 in 1907 to -0.15 in 1917 (which means that in 1917 AOF gave 15 percent of its revenue to the metropole).
Graph 7 -2 0 -1 0 0 1 0 2 0 3 0 Pe rc e n ta g e Po in ts 1900 1920 1940 1960
All Transfers Public Aid Only
Net Transfers from the Metropole to AOF as a share of
AOF Public Revenue
Since a large part of metropolitan financial transfers –loans and cash advances, were to be reimbursed in the future, another interesting question is whether metropolitan subsidies accounted for a large part of AOF total revenue. Metropolitan subsidies accounted on average over 1907-1957 for 0.004 of AOF total revenue. Public aid from the metropole was therefore almost insignificant to AOF. Graph 8 shows the variation of this share from 1907 and 1957. It remained between +0.05 and -0.05 over the whole colonial period except in 1941 and 1949. 1941 was the year when the Fond de Solidarité Coloniale was created, as a precursor of the well-known FIDES (Fonds d’Investissement et de Développement Economique et Social) which was created in 1946. The metropole gave a significant subsidy to this fund when it was created in 1941, as to the FIDES in 1949. Except in these two years, the metropolitan public aid to AOF remained very low as compared to AOF’s own public revenue. Local revenue therefore represented the very essential part of AOF public resources.
B. Who Paid AOF’s Trade Gaps?
As documented in Marseille (1996), the French colonies in general and AOF in particular experienced structural trade gaps towards the metropole during the colonial period. Marseille
argues that some metropolitan public financial transfers to the colonies compensated these trade gaps, which were therefore a big burden for French taxpayers5. This argument is based on the fact that the balance of payments requires financial transfers to be balanced, which is true. But there are ways by which payments between the metropole and the colonies could be balanced other than through metropolitan public financial transfers.
First, the metropolitan financial transfers to the colonies could have been private investments, which do not seem like a cost for French taxpayers but a source of income for French investors. According to the returns on investment reported in Coquery-Vidrovitch (1973) and Marseille (1984), private investments cannot be considered as part of public aid but were on the contrary often very profitable.
Second, imports from the metropole in the colonies could have been paid in cash. In this case, payments are balanced between the metropole and the colonies. An African company could pay in cash in two ways: either the company has the money, or it borrows the money at an African bank. An African company could therefore pay its imports in cash if there were enough local savings. I do not have any evidence on private savings during colonial times in AOF, but I do have evidence on public savings from budget data. At each budget level, public savings can be calculated by subtracting total expenses from total revenue. Graph 9 shows public savings at the federal level by year from 1907 to 1957. The total of public savings in AOF from 1907 to 1957 is 941.6 millions (1914 Francs). The total of trade gaps in AOF from 1907 to 1957 is 2,309.1 millions (1914 Francs). AOF public savings therefore accounts for 41 percent of AOF trade gaps. The possibility that African companies could borrow money from local banks to pay their imports is thus worth considering.
To conclude, there is not enough evidence on payments between the colonies and the metropole to understand exactly how payments were balanced during colonial time. However, the analysis of the colonial budgets definitely shows that AOF trade gaps towards the metropole were not compensated by public metropolitan financial transfers. Using trade gaps is therefore a misleading way to measure the cost of colonization for French taxpayers.
5
Jacques Marseille, La balance des paiements de l’outre-mer sur un siècle, problèmes méthodologiques, Actes du colloque « La France et l’outre-mer, un siècle de relations monétaires et financières », Comité pour l’Histoire Economique et Financière de la France, Imprimerie Nationale, 1997, in Empire colonial et capitalisme français, op. cit., p. 546.
Graph 9 -2 0 0 2 0 4 0 6 0 1 9 1 4 F ra n c s M ill io n 1910 1920 1930 1940 1950 1960
Public Expenses and Revenue Balance
AOF Federal Budget
C. Summary on French Colonial Public Funding in AOF
French colonial public funding in AOF relied essentially on local revenue. Metropolitan public aid accounted for 0.4 percent of AOF total revenue and 0.007 percent of metropolitan total expenses. Including loans and cash advances does not change the general picture that emerges from my results. Table 3 sums up French colonial public funding in AOF.
Table 3: Summary of Colonial Public Funding in AOF, 1898-1957 Amount (1914 Francs (Million)) % of Total AOF Revenue % of Total Metropolitan Expenses
Total Metropolitan Expenses 735 841 - 100
Total AOF Revenue 12 915 100 -
Net Transfers from the Metropole to AOF (Loan, Cash Advance and Subsidy)
732 5.7 0.1
Net Public Aid from the Metropole to AOF
V. How Large were Public Investments in AOF?
From the previous section we know that public financial transfers from the metropole to AOF were not burdensome for French taxpayers and not super beneficiary neither for AOF. So definitively AOF paid almost all its own public investments. Now the question is: how large were these investments? In France, there is actually not only a belief that French taxpayers paid for public investments in the colonies, but also that these investments were large. French President Nicola Sarkozy pronounced a controversy speech in Dakar on July, 26th 2007 in which he mentions how beneficiary colonial public investments were for local population, referring to schools, roads, hospitals, dispensaries, bridges etc6. So even if public investments were funded by local people, colonization could have benefited to AOF in the sense that colonial power organized tax collection, logistics and management of large colonial public investments. Before colonial times, some Muslim schools (‘écoles coraniques’) existed but no public schools delivering a classical lecture, writing and mathematics curriculum. Neither modern medical practices nor modern infrastructure could be found. Nobody knows what would have been public investments in AOF during the twentieth century had the territory not been colonized. But still it is true that colonization did organized public investments in the colonies and that the amount of colonial public investments can be used as an indicator of how much colonial organization benefit to AOF.
A. The Magnitude of Public Investments in AOF
Colonial public investments can be categorized as follows: education, health, infrastructure and support to productive sectors. In education, most of the investments were made in primary education in both rural and urban areas, and less importantly in secondary education in urban areas. Education staff was much heterogenous, going from highest ranked French teachers (‘hors-classe’) to simple African monitors. Local budgets reported the number of teachers and schools in colonies, so I was able to calculate the total number of teachers and schools in AOF for some years. Graph 10 reports the total number of teachers and schools for the years when the total was available in budget data. In 1907, 282 teachers and a bit less than 200 schools were located in AOF – there were 198 schools in 1911, which is the earliest data
6
Nicolas Sarkozy’s speech in Dakar, July26th, 2007 is available (in French) on:
http://www.elysee.fr/elysee/elysee.fr/francais/interventions/2007/juillet/allocution_a_l_universite_de_dakar.791 84.html
on total schools. According the colonial censuses, AOF population was 11,982,491 people in 1910, so there was basically one teacher per 42,500 people in AOF in 1910. This very small amount of teachers yet increased much over the colonial period since at the end of the period – in 1956, there were 6,244 teachers in AOF, which represented one teacher per 2,800 people. Despite a significant improvement, the situation is still far from providing a sufficient supply of education. The latest data I have on the total of schools in AOF is 1939: at this date, there were 461 schools in AOF, which is still few compared to the size of the territory.
Graphique 10 1 0 0 3 0 0 5 0 0 N u m b e r o f s c h o o ls 0 2 0 0 0 4 0 0 0 6 0 0 0 N u m b e r o f p e o p le 1910 1920 1930 1940 1950 1960
Health sector Education sector Schools
Education and Health
Colonial Public Investments in AOF
In the health sector, the local budgets give data on the number of doctors and nurses in each colony. Health staff was as heterogeneous as education staff, entailing both highest ranked military doctors and simple African unskilled workers. Graph 10 reports the total health staff for each year this data is available. It is noticeable that the evolution of education and heelth staffs are very similar. There were 247 health care employees in AOF in 1907, while 6,104 in 1956. As in education, these amounts seem very low compared to the size of the territory.
In the infrastructure sector, the colonial budgets do not detail the number of road kilometers or bridges or whatever –which would have been impossible actually, but do give the amount
of expenses in infrastructure by category by type of infrastructure (transport, buildings, water and improvement) and by type of work (construction or reparation). Note that the expenses devoted to infrastructure were mostly made of material rather than personal; the costs of personal for infrastructure was low compared to material because most people doing public works were not paid for that –the colonial power included a number of days everyone has to spend on doing public works as a tax, which was nothing else than coerced labor. Graph 11 shows the evolution of expenses devoted to infrastructure from 1907 to 1956. It shows a bigger variability than expenses in education and health, which makes sense since it is easier to compress expenses in material than expenses in personal.
Graphique 11 0 5 0 1 0 0 1 5 0 2 0 0 2 5 0 M ill io n 1 9 1 4 F ra n c s 1910 1920 1930 1940 1950 1960
Infrastructure Aid to Productive Sectors
Infrastructure and Aid to Productive Sectors
Colonial Public Investments in AOF
Finally, support to productive sectors (almost agriculture) remained completely marginal. This support was supposed to provide agriculture or industry innovation capacity. Some money was devoted to this in the 1940s, but overall it remains very rare. The annual average expenses devoted to support to productive sectors is only 1.6 million 1914 Francs. This confirms Jean Dresh’s analysis on colonial economic system, which he calls “économie de traite”: colonial investments did rather focus on infrastructure supporting exports/imports transportation than on transforming and improving local productive capacity.
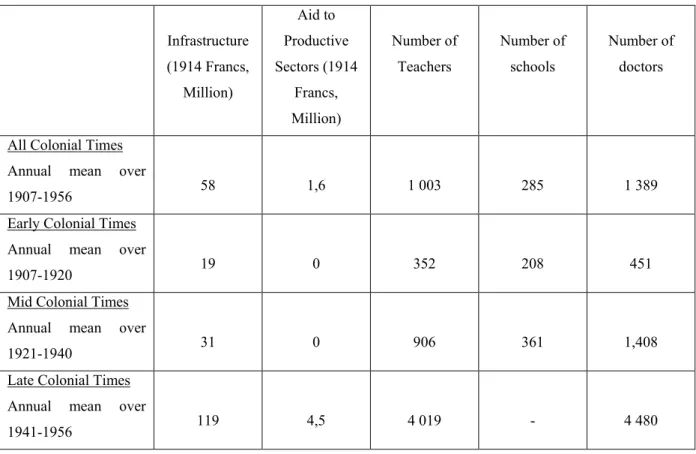
Table 4 sums up the average annual amounts of public investments in AOF over 1907-1957. For instance, there were on average 1,003 teachers in AOF over the whole colonial period, with a progression of 352 over 1907-1920, 906 over 1921-1940 and 4,019 over 1941-1956. The late colonial period clearly appears like a huge increase in public investments, which is of course consistent with the creation of the FIDES. It is also worth to note that the total metropolitan subsidies to AOF over the colonial period (48.8 million 1914 Francs) is in the same kind of range that the annual average public expenses in infrastructure (58 million 1914 Francs).
Table 4: Colonial Public Investments in AOF
Infrastructure (1914 Francs, Million) Aid to Productive Sectors (1914 Francs, Million) Number of Teachers Number of schools Number of doctors
All Colonial Times Annual mean over
1907-1956 58 1,6 1 003 285 1 389
Early Colonial Times Annual mean over
1907-1920 19 0 352 208 451
Mid Colonial Times Annual mean over
1921-1940 31 0 906 361 1,408
Late Colonial Times Annual mean over
1941-1956 119 4,5 4 019 - 4 480
B. Human Capital Transfers from the Metropole to AOF
Another way through which AOF could have benefited from colonization is human capital transfer. French emigrants in AOF embodied some general skills that could have been transferred to African people. So the idea is that a large number of French emigrants in AOF could have resulted in a significant increase in local human capital.
As to the public sector, some budgets –mostly the earlier ones, distinguished between French and African civil servants. This allowed me to compute the proportion of Africans among colonial civil servants (or at least an estimate of it based on available data). Graph 12 reports this proportion in education and health sectors from 1907 and 1957.
Graphique 12 6 5 7 7 7 77 5 6 7 7 5 4 6 7 4 3 3 4 4 3 2 5 6 7 7 6 6 75 5 3 4 4 3 5 7 4 5 5 5 6 4 2 5 0 6 0 7 0 8 0 9 0 Pe rc e n ta g e Po in ts 1910 1920 1930 1940 1950 1960
Education sector Health sector Markers correspond to the number of colonies in the sample
Africans Among Colonial Civil Servants
While the proportion of Africans among education and health staff was about 50 percent at the beginning of the colonial period, it increased rapidly after 1910 up to 80 percent in 1920, and almost reached 90 percent after 1930. So basically there were very few education and health care employees, among which a large part were Africans. Human capital transfers from the public sector were thus not very likely to be significant.
On the private side –trade companies, banks or other colonial activities, colonial censuses show that the total French population living in AOF (male, female and children altogether) amounts 7,160 people in 1910, 13,239 people in 1925 and 53,087 people in 1950. French emigrants represented therefore respectively 0.06, 0.1 and 0.3 percent of total population in 1910, 1925 and 1950. AOF was clearly not a settlement colony like Algeria. Human capital
transfers could yet be positive, but the poor amount of French emigrants shows that they could not be huge.
C. Understanding Scarcity: The Cost of Colonial Public Investments
Previous sections show that colonial investments were almost scarce. One obvious reason for this scarcity could be a constraint on supply due to high cost of public investments. The analysis of the colonial budgets gives actually a new insight in the cost of colonial public investments: While having poor revenue from both local resources –because of a poor global wealth and economic development, and metropolitan resources –because of poor financial transfers, the colonial budgets supported the very high charges of French salaries for French civil servants involved in AOF. On top of usual French salary, French civil servants involved in AOF received an expatriation premium, which were significant compared to the basic salary. This produced a huge contrast between AOF revenue and AOF charges. For instance, the salary of a French administrator (1st rank) in 1910 amounts 14,000 Francs a year; expatriation premium amounts 4,000 Francs a year. So the total cost of a French administrator (1st rank) was 18,000 Francs a year. At this date, Africans paid a poll-tax of 3 Francs per year. 6,000 taxpayers were therefore needed to cover the cost of one French administrator. In the same range of ideas, the salary of a French teacher was 6,000 a year and the salary of a French doctor was 12,000 a year –without expatriation premium. On the opposite, a salary of an African instructor amounts 600 Francs a year. One French teacher costs as much as ten African teachers. Ignoring the question whether French teachers were well-adapted and more efficient than African teachers, it is clear that the cost of French teachers –as well as all French civil servants, was huge for such a poor population.
Graph 13 shows the costs of government officials as a share of AOF total expenses. It also reports the share of investments in education and health for comparison purpose. Costs of government officials entails personal and material expenses related to the federal government, the local government and district commandments. On average over 1907-1957, costs of government officials represented 20 percent of AOF total expenses. This share varies from 11 percent and 41 percent. The costs of the government officials at the colony level only (nor at the federal neither at the district level) amounts 64 million 1914 Francs over 1907-1957, which is more than the metropolitan subsidies to AOF over the same period. The metropolitan subsidies did not even cover costs of colony level government officials.
Graph 13 0 .1 .2 .3 .4 1910 1920 1930 1940 1950 1960
Costs of Government Officials Pub. Inv. in Education and Health Public Investments in Infrastructures
Costs of Government Officials vs Public Investments
as a Share of AOF Total Expenses
To conclude, costs of French civil servants can explain why public investments were so scarce. AOF did not only receive few financial transfers from the metropole, but also supported very high charges due to French administration, which were a lot of a black man’s burden. This paradoxical situation might justify that after 1949 some of Governors and Adminsitrators’ salaries turned to be supported by the national budget. Yet local budgets kept paying for all the French civil servants ranked below, so most of the French civil servants.
VI. Conclusion
Using original data from AOF colonial budgets, this paper shows that AOF did not cost much for French taxpayers. A very small share of metropolitan total public expenses was devoted to AOF, even as we consider loans and cash advances on top of subsidies. In contrast with what colonies have a reputation for, AOF was therefore far from a black hole. AOF public funding was almost autonomous and therefore colonial investments were almost funded by Africans themselves rather than by French taxpayers.
Results in this paper are not in line with the existing literature, which underlines the costs of colonies for French taxpayers. This divergence can be explained in five ways. First, most of the existing papers do not cover the whole colonial period. Second, all of the existing papers, except Coquery-Vidrovitch (1982), do consider financial transfers from the metropole to colonies but not from colonies to the metropole. Third, all of the existing papers assimilate loans, cash advances and subsidies and therefore consider financial investments as costs. Fourth, some of the existing papers focus on the 1950s and generalize their observations to the whole colonial period. Finally, Jacques Marseille’s analysis is based on the assumption that colonies’ trade gaps were compensated by metropolitan public financial transfers, which is wrong in the case of AOF. This paper therefore addresses major caveats in the existing literature.
Many Africans still believe that they owe French colonizers their schools, hospitals and infrastructure. But the reality is that they financed with their own resources almost the totality of these public investments. Moreover, they supported the high cost of French colonial administration. Colonization therefore reveals to have been more of a black than white man’s burden.
References
Amin Samir, L’Afrique de l’Ouest bloquée, L’économie politique de la colonisation, 1880-1970, Paris, Editions de Minuit, 1971, p. 31
Amin Samir, L’échange inégal et la loi de la valeur, Paris, Editions Anthropos, 1973
Arghiri Emmanuel, L’échange inégal, Essai sur les antagonismes dans les rapports économiques internationaux, Paris, Editions François Maspero, 1969
Pascal Blanchard, Nicolas Bancel, Sandrine Lemaire (dir.), La fracture coloniale : La société française au prisme de l'héritage colonial, Paris, La Découverte, 2005
François Bobrie (1976), Finances publiques et conquête coloniale : le coût budgétaire de l’expansion française entre 1850 et 1913, Annales ESC, vol. 31, n°6
François Bobrie, Organisation des finances publiques coloniales françaises dans la seconde moitié du XIXe siècle et la première moitié du XXe siècle, étude ronéotée
Catherine Coquery-Vidrovitch, A propos des investissements français outre-mer : l’exemple de l’Ouest Africain, 1910-1965, Actes du IIe Congrès des historiens économistes français, La position internationale de la France, EHESS, 1973, p. 426
Catherine Coquery-Vidrovitch (1982), Le financement de la « mise en valeur » coloniale, Méthode et premiers résultats, Etudes africaines offertes à Henri Brunschwig, EHESS, pp. 237-252
Catherine Coquery-Vidrovitch, Histoire de la colonisation et anti-colonialisme. Souvenirs de années 1960-1980, in Dulucq S., Coquery-Vidrovitch C., Frémigacci J., Sibeud E. et J.L. Triaud, L’écriture de l’histoire de la colonisation en France depuis 1960, Afrique et Histoire, 2006/2, n°6
Jean Dresh, Sur une géographie des investissements de capitaux, l’exemple de l’Afrique noire, Bulletin de l’Association de Géographie Française, n°177-178, 1946, p. 63
François Bloch-Lainé, La Zone franc, Paris, P.U.F., 1956
Marc Ferro, Le Livre noir du colonialisme : XVIe-XXIe siècle, de l'extermination à la repentance, Éditions Robert Laffont, Paris, 2003
Rapport Jeanneney, La Politique de coopération avec les pays en voie de développement, Paris, La Documentation Française, 1963
Daniel Lefeuvre, Pour en finir avec la repentance coloniale, Paris, Flammarion, 2006, réed. 2008
Jacques Marseille, La politique métropolitaine d’investissements coloniaux dans l’entre-deux guerres, Actes du IIe Congrès des historiens économistes français, La position internationale de la France, EHESS, 1973
Jacques Marseille, Empire colonial et capitalisme français, Histoire d’un divorce, Paris, Albin Michel, 1984, rééd. 2005
Jacques Marseille, La balance des paiements de l’outre-mer sur un siècle, problèmes méthodologiques, Actes du colloque « La France et l’outre-mer, un siècle de relations monétaires et financières », Comité pour l’Histoire Economique et Financière de la France, Imprimerie Nationale, 1997