Capacity Management and Make-vs.-Buy Decisions by
Akansha Nidhi
Bachelors of Technology in Computer Sc. And Eng., KIIT University, 2011 and
Fady Riad
Masters of Business Administration, University of Florida, United States, 2012 Bachelors of Architectural Engineering, Cairo University, 2008
SUBMITTED TO THE SUPPLY CHAIN MANAGEMENT
IN PARTIAL FULFILLMENT OF THE REQUIREMENTS FOR THE DEGREE OF MASTER OF ENGINEERING IN SUPPLY CHAIN MANAGEMENT
AT THE
MASSACHUSETTS INSTITUTE OF TECHNOLOGY JUNE 2017
C 2017 Akansha Nidhi and Fady Riad. All rights reserved.
The authors hereby grant to MIT permission to reproduce and to distribute publicly paper and electronic copies of this thesis document in whole or in part in any medium now known or
hereafter created.
Signature
of
Author..Signature redacted...
Signature of Author...
Certified by...
Master of Engineering in Supply Chain Management Program May 12, 2017
Signature
redacted
...Master gineering in Supply Chain Management Program
Signature redacted
...
Ma
1
Dr. Bruce C Arntzen, Executive Director, Supjply Chain Management Program
Signature redacted
Thesis SupervisorL . ... ...
Dr. Yos Sheffi, Director,
dCniler
for Transportation & Logistics,ARCHIVES I Elisha Gray II Professor of Engineering System,
MASSACH S S INSTITUTE Professor, Civil and Environment Engineering
OF TECHNOLOGY
AUG
0-12017
Capacity Management and Make-vs.-Buy Decisions By
Akansha Nidhi And Fady Riad
Submitted to the Supply Chain Management on May 12, 2017 in Partial Fulfillment of the
Requirements for the Degree of Master of Engineering in Supply Chain Management
Abstract
The oil and gas industry is characterized by unpredictable boom and busts cycles. Companies must manage capacity to be able to quickly meet increasing demand during boom cycles and survive when oil prices go down. During this time, companies resort to in-house sourcing ("Make") or buying externally ("Buy") from suppliers, whichever is rational. Since 2014, the oil field services industry has been in a period of recession, and oil prices have dropped significantly. The company's sourcing team asked us to analyze the Make-vs.-Buy scenarios. Our research has two primary objectives. First, to provide a methodical understanding of key Make-vs.-Buy decision factors for optimized capacity management during an upturn. Second, to develop a 2x2 assessment model that can assist in making the Make-vs.-Buy decision once the recession is over and prices have returned to a normal index. We interviewed research company personnel to get a better sense of their hypotheses: first, quantities ordered vary with boom/bust cycles; second, external pricing rises during boom cycles and falls during bust cycles; third, internal sourcing has a unified price that does not change with the boom/bust cycle. We tested the company's hypotheses with a limited set of product data but could not verify them. To better assess the situation, we researched the factors considered by theorists when making a Make-vs.-Buy decision. Based on this research, we identified four assessment criteria -- strategic, technological, market and economic factors -- that are intrinsic as well as extrinsic to the company throughout the entire decision making process. Furthermore, we created a model to test boom and bust circumstances and provide a better testing mechanism for boom and bust cycles.
Thesis Supervisor: Dr. Bruce C. Arntzen
Acknowledgements:
We are grateful for the advice, guidance and supervision provided by Dr. Bruce C. Arntzen throughout this program and this thesis.
We would also like to acknowledge the effort of MIT CTL personnel, the MIT faculty, and all who helped us during our research, analysis and conclusion.
From Akansha Nidhi:
I would like to thank my parents who have always believed in me. Finally, I would also like to thank my friends who have always motivated me to think creatively.
From Fady Riad:
I want to thank my family for always supporting me. I also want to thank all my mentors; without whom I would not have been here.
Table of Contents
A bstract ...
2
Acknowledgm ents: ...
3
Table of Contents ...
4
List of Figures:...
6
List of Tables:...6
Chapter 1: Introduction...7
Section 1.1 -The Petroleum Industry ---... 7
Section 1.2 -The Oilfield Services Industry:---... 8
Section 1.3 -The Problem: --- -- -- -- ---- -- --- -- -- -- -- -- --... 10
Section 1.3.1 -Background: --- -- -- --- -- --- -- -- --- -- -- --... 10
Section 1.3.2 -The Factors:--- --- -- --- --- --- - - -- - -- - ---... 10
Section 1.3.3 -The Questions: ---...- 11
Chapter 2 : Literature Review ...
12
Section 2.1 -Section 2.2 -Section 2.3 -Section 2.4
-Chapter 3
Buy strategies: How it all started ---... 12Make-vs.-Buy: The Next Step:---...---13
The Last step: a decision revisited---... 15
The Road ahead: Our role---... - 16
: M ethodology ...
17
Chapter 4 Analysis and Results...22
Section 4.1: Interviews ---... 22
Section 4.1.1: On-Site Interviews ---... 22
Section 4.1.2: Follow-up Interviews ---...--- 23
Section 4.2: Initial Hypotheses Tested ---...-- - -25
Section 4.2.1: Quantities ---... 27
Section 4.2.2: External Pricing---...31
Section 4.2.3: Internal Pricing---...33
Section 4.2.4: Conclusion---...33
Section 4.3: Case Studies---...34
Section 4.3.1: Aerospace and Defense: ---... 34
Section 4.3.2: A major global health care and pharmaceutical company ---... 36
Section 4.4: Results ---... 38
Section 4.4.1: New decision factors ---...---- 38
Section 4.4.2: Evaluating Boeing strategy for Dreamliner 787 - ---... 41
Section 4.5: Analytical Model---...43
Section 4.5.1: Model Dynamics ---... 44
Section 4.5.2: Results:---...44
Section 4.5.3: Testing---...47
Chapter
5
Discussion...51
Section 5.1: Original Question ---... 51
Section 5.2: Summary of Outcomes---...51
Section 5.3: Implications---...52
Section 5.4: Limitations---...52
Section 5.5: Opportunities of future research ---...-- - - - -54
Chapter 6 Conclusion ...
55
List of Figures:
Figure 1-1: Change of Oil barrel prices from 2013 to 2018. (Source U.S. EIA)---... 7
Figure 2-1: The Three Pillars and their definition (Kaushal, Pfitzmann, & Shorten, 2006)- 14 Figure 4-1: Annual World Rig Count data since 1995 (Baker Hughes, 2017) --- ---... 26
Figure 4-2: Annual World Rig Count data since 2008 (Baker Hughes, 2017) ---... 27
Figure 4-3: Quantity ordered of Product 1/order since 2008 ---... 27
Figure 4-4: Quantity ordered of Product 2/order since 2008---... 28
Figure 4-5: Quantity ordered of Product 3/order since 2008 ---... 28
Figure 4-6: Quantity ordered of Product 4/order since 2008 ---... 29
Figure 4-7: External Cost of each product over time since 2008 ---...-- -- - 31
Figure 4-8: Internal Cost of Products 1 and 2 over time---...---- 33
Figure 4-9: Aircraft parts outsourcing (Source: Boeing.com) ---... 34
Figure 4-10: New decision factors---...--- 38
Figure 4-11: 2x2 matrix ---... 40
Figure 4-12: Boeing's 2x2 decision matrix---...42
Figure 4-13: Parameter entry module for the model ---... 44
Figure 4-14: Boom/Bust entry module in model ---... 44
Figure 4-15: Sample Demand/price multiple chart from model---...--- 45
Figure 4-16: Sample Total cost graph from model ---... 45
Figure 4-17: Sample Result table from model (Internal Capacity Set at 1000 units) ... 46
Figure 4-18: Testing sample demand/pricing chart---...---- 47
Figure 4-19: Result table from test sample ---...-- - - -48
Figure 4-20: Total cost graph for test sample ---... 48
Figure 4-21: Result table for modified test sample---...--- 49
Figure 4-22: Total Cost chart for modified test sample---...--- 49
List of Tables: Table 4-1: 1 Regression result between Aggregate product quantity and Boom/Bust Dummy Variable ---... 29
Table 4-2: Regression results between the average price/order and the order quantity for each individual product ---... 30
Table 4-3: Regression Results between the Cost of each individual product and a Boom/Bust Dummy Variable .---... 32
Table 4-4: Regression result between Aggregate product costs and Boom/Bust Dummy Variable ... 3 2 Table 4-5: Decision factors Evaluation sheet ---...-- - - -39
Table 4-6: Boeing Evaluation Sheet ---...--- 41
Chapter 1 : Introduction
Section 1.1 -The Petroleum Industry
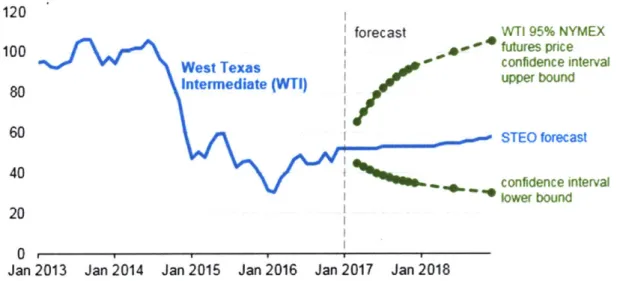
For over a century, the petroleum industry has been responsible for exploring, extracting, refining, transporting, and marketing petroleum products. The industry accounts for over a third of global energy production, ranging from 30%-50% across all geographies (U.S. Energy Information Administration, 2017). However, since 2014, the industry has hit an economic downturn. As shown in Figure 1-1, for the last 5 years, crude oil spot prices have dropped from a high of $110/barrel to a low of $29/barrel (U.S. Energy Information Administration, 2017).
Prices this low have not been seen in the industry since January 2002 (U.S. Energy Information Administration, 2017). During this economic slump, oil companies have been forced to cancel explorations, drills, and other services. This, in turn, has affected the oil services industry.
120
forecast WTI 95% NYMEX
100 futures price
West Texas I confidence interval
80 Intermediate (WTI) r bound
60 STEO forecast 40 Sm confidence interval lower bound 20 0
Jan 2013 Jan 2014 Jan 2015 Jan 2016 Jan 2017 Jan 2018
Figure 1-1 Change of Oil barrel prices from 2013 to 2018. (U.S. Energy Information Administration, 2017)
To better understand the industry, we need to define and differentiate its main segments. The petroleum industry is divided into three main segments: Upstream, Midstream, and Downstream.
Upstream is the process of exploring, drilling and operating underground and underwater oil and gas fields, and is responsible for getting the oil out of the ground.
Midstream deals with the transportation, storage and wholesale of the crude oil product and any by products.
Downstream operations include the refining, transportation, marketing and distribution of the final petroleum products.
Oil field service companies deal mostly with the Upstream and some Midstream parts of the industry. The oil industry's first point of contact is usually the oilfield services industry. Section 1.2 -The Oifield Services Industry:
The Oilfield Services Industry is the main lead in the upstream segment of the petroleum industry. When a downstream company obtains mineral rights to a location, they contract Oilfield service companies to handle the exploration, operation and completion of the wells. Services usually start with Characterization, the process of evaluating and defining the deposits. Wireline, the main driver of the Characterization Group Services, is the process of providing information to evaluate, plan and monitor the well construction. Other services involve consulting and seismic data acquisition.
Once a site has been established, the Drilling Group is contracted next. The group handles the drilling and positioning of the oil wells. Drilling includes the directional drilling and measurements and logging while drilling, and offerings such as fluids and additives required. Finally, the Production Group handles services such as maintaining and optimizing well production, well completions, environmental solutions, wellbore services and project management services. It is the final step in the upstream process.
One of the main industry drivers is the willingness of downstream companies to invest in new wells during times with higher production requirements (a.k.a. ramp up periods). During these times, Oil Field services companies have an abundance of suppliers. However, because demand is usually higher than supply, companies are forced into overproduction to meet that demand. During the downturn, or ramp down periods, the situation is much more problematic.
While most Oilfield services companies are forced to abandon projects, cut costs and downsize, suppliers are struggling even more. Many small-scale suppliers find it hard to stay in business, particularly non-diversified companies. Large suppliers, such as chemical companies, have no problem shifting production lines. The worst-case scenario is keeping a production line open at break-even to ensure they are ready for the ramp up periods. However, small-scale non-diversified suppliers usually end up in financial bankruptcy as they face huge losses from cancellations. As a result, during the ramp up periods, Oilfield Services companies face huge challenges replacing suppliers. Therefore, many companies choose to outright buy their suppliers rather than incur future losses. Many companies in the industry are expanding into the midstream segment, whether because it is a good deal, or it is a great addition to the line of services. FieldServ Inc.1 decided to explore that option when they made the decision to buy CI Inc.1.
Section 1.3 -The Problem:
Section 1.3.1 - Background:
In 2016, FieldServ. Inc. acquired CI Inc., to expand its services. It happens that CI Inc. was also a supplier to FieldServ for certain lines of business (details are left out for confidentiality purposes). Post-acquisition, FieldServ decided to implement a direct procurement process rather than bidding for all relevant supplies sold by CI Inc. FieldServ could also take advantage of Cl's manufacturing capability to make few of its products at CI that were traditionally bought from external 3rd party suppliers. However, in certain cases, FieldServ discovered that the purchasing costs of CI parts could be over the market price, for similar products if they were bought from some of its competitors. Furthermore, lead times were not always ideal, with lead times in the market being typically shorter from competitors when compared to the lead times offered by CI.
On the one hand, it made great business sense to insource from one of FieldServ's internal partners during the downturn. However, during the ramp up, higher prices, capacity issues and longer lead times meant that insourcing is not the optimum solution.
Section 1.3.2 - The Factors:
In supply chain management, the terms "make" and "buy" are usually used to compare the option of producing a good in-house versus buying it from an external supplier. The common view is that a "Make" approach is always preferable to a "Buy" approach. Savings can be found in many forms that vary from a lack of markup to simple logistics. Sourcing from an in-house supplier means that the company will only have to pay for the cost of production, plus a small markup in some instances. However, "make" is not always a good solution. To better
understand the problem, we need to understand what "make" strategy and "buy" strategy is. "Make" strategies are defined as the process of manufacturing or buying raw materials, or services, from a company that is owned by the company or the parent company. It has become common practice for companies to buy their suppliers and integrate them into their value chain. This practice can provide a competitive edge and a cost saving measure, however, it can also increase fixed costs and reduce flexibility to react during a downturn. Though, what we learned from industry professionals is that Make strategies have recently become more popular. "Buy", or outsourcing, is procuring raw materials, or services, from a company not owned by the company or the parent company.
In addition, a decision made during a Boom is not necessarily effective during a Bust cycle. Times of economic uptick brings different dynamics than that of a downturn.
Section 1.3.3 - The Questions:
Many different aspects shape the decision-making process for Make-vs.-Buy in an organization. In our research, we will answer two major questions:
i. What are the drivers that shape a Make-vs.-Buy decision? ii. How do these factors change during a Boom and Bust cycle?
Based on the above 2 questions, our thesis will center on when it is more advantageous to use a "Make" strategy, and when it is more effective to "Buy." We will explore the different practices used by various companies in different markets and industries. Furthermore, we will develop a method to analyze and determine best strategies when a company is faced with a "Make vs. Buy" decision. Finally, we will analyze the different drivers in a Boom and Bust cycle.
Chapter 2 : Literature Review
"Make or Buy?" is a question that many firms struggle to answer. The idea of whether a company should leverage its in-house resources, or use outside help may seem easy at first. However, as companies evolve into the 2 1st century, so does their supply chains. To this day,
Make-vs.-Buy strategies have emerged, matured and transformed from a simple rule to a complex matrix. Our research topic centers around understanding the progress made so far by others, and add to it. We hope to develop a framework that can help turn the Make or Buy decision into an objective metric. However, to do so, we needed to understand what current theories exist, what have the other researchers synthesized. In this review, we will capture that change and present a picture of the current consensus to pave the way for our thesis.
Section 2.1 - Buy strategies: How it all started
In 1992, a Harvard Business Review article started off by saying that the Manufacturing landscape has shifted. When once the goal was producing, now it was about focusing on what a company is good at, and outsourcing the rest (Venkatesan, 1992) The traditional thought was that a company, particularly one in the manufacturing industry, manufactures. Companies procure raw materials and deliver products. However, as supply chains matured and developed, they became more complex. Venkatesan (1992) decided to explore that evolution, particularly that of the Make-vs.-Buy decision process.
Venkatesan (1992) made it clear that companies should outsource the less-complex and less-valuable parts to suppliers to focus mostly on developing their skills. He theorized that a supplier is better suited to utilize economies of scale to deliver a commodity type product and that the manufacturing time should be spent on honing a company's competitive edge. However,
he also pointed out that many companies don't do that. Fear of exploitation, lack of understanding, and conflicting strategies gave rise to the fear of outsourcing. Managers wanted to keep everything in, exhaust their resources, rather than expand. Venkatesan (1992) decided otherwise. His article gave rise to one of the earliest frameworks for Make-vs.-Buy decisions: The Strategic Sourcing process.
Venkatesan (1992) designed a process to evaluate each manufacturing decision. Each vector eventually led to a sourcing decision. Eventually, a company can have either a strategic core or spilt milk, or a commodity Red, Green or Yellow product.
Core items, and spilt milk items represented the strategic families of products. If investment was justified, then we were dealing with a core item and we needed to develop, otherwise it was a
spilt milk item and outsourcing was the choice.
Red, Green and Yellow are the outcomes of evaluating commodity items. Red was the result of no assets available and led to an outsource decision. Green and Yellow dealt with competitiveness.
The framework was basic, and it did not consider the many different variations and challenges. However, it was a good start and certainly led the way to much more.
Section 2.2 - Make-vs.-Buy: The Next Step:
As Supply chains evolved, matured and got more complex, so did the Make-vs.-Buy decision. The frameworks developed into more than just strategic product or not. By adding risk management and economic factors a new type of framework emerged. In 2006, a paper
published by Arvind Kaushal, Michael Pfitzmann, and Dermot Shorten outlined this new evolution of thought.
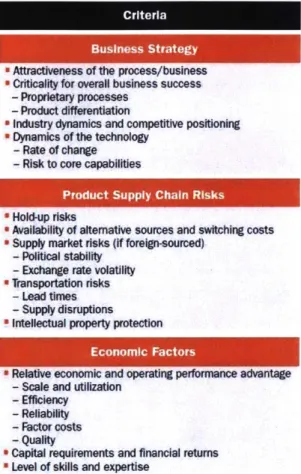
Kaushal, Pfitzmann and Shorten (2006) decided to expand the aspect of the Make-vs.-Buy decision making process. They developed a three-step process to outline this expansion based on three pillars, as shown in Figure 2-1.
The decision-making process came down to evaluating Business Strategies, Product Supply Chain Risks and Economic Factors.
The Business Strategy pillar handled the
Business Strategy previously established concept of competitiveness
* Attractiveness of the process/business
" Criticality for overall business success and value. If a product is critical then keep it in-- Proprietary processes
- Product differentiation
" Industry dynamics and competitive positioning house, otherwise, outsource.
" Dynamics of the technology - Rate of change
- Risk to core capabilities The second pillar is Supply chain risks.
Produc SuplyhaIntellectual property theft, hold-ups, stability are
" Holdup risks
" Availability of alternative sources and switching costs
-Supply market risks (if loreign-sourced) all examples of some of those risks. High risk
- Political stability
- Exchange rate volatility
"Transportation risks equals in-house, low risk equals outsource.
- Lead times
- Supply disruptions
" Intellectual property protection The third pillar dealt with the economic factors.
Economic Factors
Relative economic and operating performance advantage Costs, Quality, Capital Requirements and skills are - Scale and utilization
- Efficiency
- Reliability some factors that were considered under this pillar.
- Factor costs
- Quality
a Capital requirements and financial retums This pillar is the last in the decision-making
* Level of skills and expertise
Figure 2-1 The Three Pillars and their definition process, should it prove economically sound to (Kaushal, Pfitzmann, & Shorten, 2006)
outsource, then outsource, otherwise maintain in-house.
decisions needed to be shared across all company functions. They were hopeful that their framework would help companies make a decision that would positively impact the whole organization and not just one function. The addition of the second and third pillar was another step on the road, one that made sure the Make-vs.-Buy decision is no longer based on economic factors.
Section 2.3 -The Last step: a decision revisited
As companies evolved even more, the decision to Make or Buy needed to evolve as well to include more than just the three pillars. In 2011, Monahan, Van Den Bossche and Tamayo published an independent study outlining three more pillars. The authors believed that previous strategies can work most of the time, however, it is the infrequent occurrences that destabilizes the whole chain. By revamping the variables, Monahan, Van Den Bossche and Tamayo (2011) believed that they can all but eliminate that threat.
Monahan, Van Den Bossche and Tamayo started by discussing the benefits and risks of each decision in the modem decade. For starters, while a "Make" decision can help protect intellectual property, utilize capacity and absorb fixed costs, it can also lead to wasted time and resources. While a "Buy" decision frees up resources and capital, it still carries the risk of quality and availability
To cover as many facets of the decision as possible, Monahan, Van Den Bossche and Tamay added pillars to the process. The new pillars, renamed assessments (Monahan, Bossche, & Tamayo, 2011), were manufacturing strategy compatibility, delivered costs, capacity, intellectual property risk, business case, and contract availability. Each assessment can have outcomes that vary from make in-house to Invest, or even redefine. Each decision does not
necessarily lead to the next like before. For instance, if a product that doesn't meet the manufacturing strategy, one would worry about intellectual properties and contract manufacturers. If a product does meet that strategy, then the goal is to evaluate cost-competitiveness and business case. The final recommendations were: make in-house, invest to make in-house, buy from contract manufacturer, invest to buy from contract manufacturer, redefine product (Monahan, Bossche, & Tamayo, 2011).
The decision was no longer should we make or buy, clearly the options have expanded and varied quite a bit. Investment decisions and even product development strategies were now made based on that assessment. What previous authors advised, Kaushal, Pfitzmann and Shortenn (Kaushal, Pfitzmann, & Shorten, 2006) has now become a reality. The Make-vs.-Buy decision now belongs to all parties, and is no longer hinged on sourcing or manufacturing. The decision-making process has truly evolved and is ready to face the challenges ahead.
Section 2.4 - The Road ahead: Our role
The Make-vs.-Buy decision is no longer a simple one. It is a decision that requires analysis, process charting, and matrices. This review charts a sample of what came before us. Moving forward, we plan on using that information in determining the best way to utilize the assessments. In the next chapter, we will share our methodology for understanding the intricacies of a Make-vs.-Buy decision.
Chapter 3 : Methodology
The goal of our research is to identify the key indicators that influence the Make-vs.-Buy decision and how these indicators change during a Boom/Bust cycle. This section discusses the case based methodology we employed to interpret different business cases which shall be discussed in later sections.
To understand the factors for evaluating the problem statement, should we make or should we buy? - we conducted an interview research at FieldServ. A qualitative interviewing technique best suited the needs of our research to develop the problem holistically.
We conducted interviews with Insourcing Category Manager and Global Sub-category manager to understand the rationale behind the existing insourcing and outsourcing process in the company. The interview is discussed in detail below.
We also interviewed the manufacturing managers to explore the flexibility in their operations. The information gathered from the interview clarified the different manufacturing models employed at each product line, from fully vertically integrated to externally integrated, and OEMs. The detailed outcome of the information gathered from this interview is discussed below.
We conducted a case-based analysis of different industries to understand the strategic outcomes. We critically analyzed the business practices followed in industries such as the aviation industry, consumer product goods, and others, which have a similar cyclical and seasonal upturns and downturns in their business similar to those in the oil field services industry. Based on this systematic literature review, we conducted a case-based analysis to formulate 6 different cases that influence the Make-vs.-Buy decision. The extensive analysis of
this literature review is discussed further below.
Lastly, we created an analytical model that showed how the different factors - Costs, Boom/Bust cycles - can contribute to the decision-making process. This model focused mostly on the cost structure of the decision.
Following our research, we analyzed existing data to test the hypotheses of company personnel that Quantity, Cost and Boom/Bust cycles are interconnected and guide the decision-making process. We also developed an analytical model to test the above hypotheses.
Interviewing the Insourcing Category Manager and Sub-Category Managers
We interviewed category managers at FieldServ's headquarters at Houston, Texas. These interviewees were selected because we thought they were best positioned to explain the supplier base and the as-is insourcing process in the company. The target group represented sourcing specialists, procurement specialists, and OEMs (Original Equipment Manufacturer). The interview questions were semi-open and open ended questions. We framed the questions in a manner to understand the in-house manufacturing capabilities especially, post-acquisition of a supplier company to FieldServ previously. The interviews were conducted face-to-face and lasted for an hour. From the data collected from the interviews, we understood the criticality and capability assessment tools that assist the decision-making process by weighing the key factors -Technology and Manufacturing, Cost, Supply Chain and Logistics, and Sustainability. The detailed analysis of our findings is provided in Chapter 4.
Interviewing the Manufacturing Manager and Supply Chain Integration Manager
We conducted interviews with the manufacturing manager, which represented the supply engineering teams. An interesting fact revealed during our discussion was that although some of the equipment was cheaper to purchase from the suppliers, FieldServ preferred making that equipment in-house. The insights from interviewing the manufacturing manager further deepened our analysis by considering other factors such as intellectual property, technology and others than merely focusing on cost advantage. We further narrowed the contributing factors that influence the purchasing-or-manufacturing decisions depending on criticality and lead-time. The key findings from the interviews are summarized in the Results Section (Section 4).
Systematic Literature Review
A comprehensive analysis of strategic and competitive advantage, financial risk assessments and scenario analysis has been performed previously by many researchers and executives. We extensively reviewed publications and journals that deal with the matter, such as
Harvard Business Review, AT Kearney and Strategy&.
We used the case study methodology to gain a systematic understanding of the assessment factors addressed previously in different business scenarios. The review process formed a solid foundation for our work. As defined by Miles and Huberman (Miles & Huberman, 1994) "a case is a unit of analysis or a phenomenon of some sort occurring in a bounded context". In Case Study Research, John Gerring defines cases as "a spatially delimited unit observed at a single point in time or over a period" (Gerring, 2007) . Our research revolves around studying these different case units and designing a strategic assessment matrix for answer
the research question. We categorized our analysis into six assessment criteria. We use these key levers to structure our analysis and model six business case units that will result in the final deliverable of our analysis - the 2x2 assessment tool. The six assessment factors are listed below.
a. Manufacturing strategy: One of the critical factors in the Make-vs.-Buy decision is the strategic vision and competitive advantage that industries gain by making a product in-house. Making a product only because the internal capacity exists is one of the most common but poorly judged steps, as future sunk costs are overlooked in this situation.
b. Cost of Delivery: This is a quantitative analysis of the options available in terms of cost. Using this criterion, we attempt to justify the profitability of either
decision - Make or Buy.
c. Available Capacity: An analysis of available capacity outside with respect to available in-house.
d. Risks of Intellectual property: In few industries, such as high-tech and electronics, loss of intellectual property is a huge concern when technology or products are outsourced to a manufacturer. We evaluate the criticality of this
factor with respect to the oil field service industry.
e. Availability of suppliers: In certain industries facing cyclic upturn and downturns, availability of suppliers during the downturn is a crucial concern. We analyze how such companies should redefine their strategy in accordance with the
f. Business case for making or buying the product: We evaluate financial and operational viability of making a product within a company. In our analysis, we found that if the business case for a product is long-term, industries tend to opt for a Make strategy rather than Buy.
Analytical Model
To get a better sense of how certain factors- such as cost multiples, capacities and Boom/Bust cycles - can influence the Make-vs.-Buy decision, we built an Excel model to test real life scenarios. We discuss the mechanics of the model further below. We started building a simple model, reactive with a few simple parameters, then added more parameters as complexity increased. Our goal was to create as realistic a model as possible.
Chapter 4 : Analysis and Results
We start this section by summarizing the current hypotheses, based on interviews conducted with the FieldServ. team. We then test those hypotheses with real market data provided by the company. Moreover, we provide a practice case study from an industry company, and an example case study for a decision that went wrong. Finally, we provide a framework based on our analysis.
Section 4.1: Interviews
Section 4.1.1: On-Site Interviews
During our on-site visit to FieldServ., we conducted several interviews with the sourcing teams, the FieldServ. - CI integration team, and the team responsible for a previous integration. We also talked to some of the site managers to understand how internal sourcing is handled, and generally how decisions are made at FieldServ.
During our first meeting with the category managers at FieldServ., we learned that during the current Bust cycle, internal sourcing, or Make, is more preferred to external, or Buy. Even though internal prices are at four times multiple, as compared to external, and lead times are much slower internally. We asked the managers for a reason, and they provided the following:
a. External prices are cheaper now, however, during Boom periods, those prices will increase past internal prices, which are relatively stable
b. Internal production needs to continue at minimum sustainable levels in anticipation for ramp up periods.
Following that meeting, we proceeded to a second interview with the sourcing managers from another company owned by FieldServ. for several years (details are left out for confidentiality purposes). During that interview, we got an understanding of how an insourcing
order is handled from the receiving end. Each Unit within the company sells its capacity to a central department at a pre-determined price. The central department then receives orders from internal and external parties, provides pricing and handles the contracts from there. There is no interdepartmental ordering, or any form of interaction between the different departments, child companies of the parent company, or any business unit.
Our final interview was with leaders from CI Inc., during which we discussed why the insourcing process was prioritized during a Bust cycle. When cost was brought up again, we asked why doesn't FieldServ. buy larger orders during Bust cycles, low price periods, and stock up for the ramp up. It was agreed that these types of transactions were not preferred. FieldServ. is currently insourcing because CI provides better quality and consistent pricing throughout Boom/Bust cycles.
After our on-site visit, we concluded that FieldServ. practices need to be evaluated. We wanted to understand whether the current insourcing decision is justified, particularly since its cost and lead times were not ideal. Furthermore, we wanted to provide metrics that can help make an objective decision during the next ramp up period. Our next step was research and follow-up interviews.
Section 4.1.2: Follow-up Interviews
Following our on-site visit, we had several calls with our sponsor companies, particularly with the sourcing managers. We wanted to understand how things work within FieldServ. Initially, we learned that FieldServ. has a very thorough manual that handles the Make-vs.-Buy decisions. However, we assumed that those procedures were used with new products sourcing, or in cases when a new internal capacity or partner is added.
based on an options model. FieldServ. sends vendors an RFP, does its evaluation based on pre-established metrics, then develop an option to buy contract with the vendor. FieldServ. has the option to buy a product at a certain price, up to a certain capacity. Terms of the contract may be negotiated annually, however, no new bids are initiated.
Another piece of information was how the prices were negotiated annually. During boom cycles, FieldServ. needed more capacities and suppliers were usually squeezed tight. Furthermore, suppliers needed to reserve the capacity for FieldServ., however, FieldServ. didn't necessarily need to use that capacity. This entailed higher risks for the suppliers, therefore, higher prices were negotiated. However, during a bust cycle, suppliers had extra capacity, and while FieldServ. still had no obligation to buy, suppliers encouraged so by offering lower prices.
We also learned that the Oil and Gas industry follow a traditional economic model when it comes to Boom/Bust cycles. During a Boom, there are many oil wells that are open, therefore, more demand for oilfield services and vice versa in a Bust.
Section 4.1.3: Current Hypotheses
Based on our interviews, we could extrapolate that the Make-vs.-Buy decision is made under certain conditions and hypotheses. To better understand the current situation, we started by understanding whether those hypotheses were true or not.
To begin with, cost is considered a big driver when it comes to the decision-making process. While many factors are considered when comparing and choosing an external vendor, the decision for whether to source internally or externally is driven partially by cost. Other factors include capacity, lead time, economic conditions and capabilities.
For cost, the managers we interviewed seemed to believe that costs fluctuate with Boom and Bust cycles. During a Boom cycle, demand usually rises to levels where it may surpass
supply, therefore, vendors raise prices. However, in a Bust cycle, demand falls and suppliers want to move inventory, therefore, they drop prices, sometimes to breakeven levels.
Another hypothesis, based on the above logic, was that order quantities rose during Boom cycles, and dropped during Bust. It follows economic theories, when demand is more than supply, order quantities increase and so does pricing, and vice versa. Another assumption is that the larger the order, the lower the price, as compared to lower quantity orders in that period.
The last hypothesis dealt with internal pricing. While interdepartmental orders are received, and handled in the same manner as external orders are, managers believed that internal prices are usually flat, with only inflation as its control.
We have proceeded to test the top three hypotheses using data provided to us by management. It is important to see how this product data can be interpreted, and what can be extrapolated from it. In Section 4.2, we will test each of the above-mentioned hypotheses based on data provided by FieldServ. for four different core products (undisclosed due to confidentiality). The results should prove useful to our research and our recommendations moving forward.
Section 4.2: Initial Hypotheses Tested
As mentioned in section 4.1, we interviewed several category managers to gain insights into what they believed were the known factors and key drivers to the Make-vs.-Buy decision making process. The hypotheses drawn from our data gathering phase were:
a. Managers believe that quantities ordered vary with Boom/Bust cycles, which in turn varies external pricing
b. Managers believe that external pricing rises during boom cycles and falls during bust cycles
c. Managers believe that internal sourcing has a unified price that does not change with the Boom/Bust cycles.
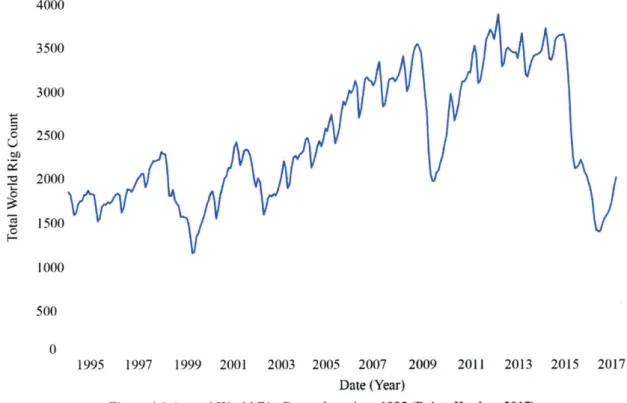
To evaluate those beliefs, we started by plotting a 20-year timeline for the Oil & Gas industry. We wanted to observe the different patterns. Furthermore, we asked FieldServ. to provide us with some product data to compare and evaluate over time. We obtained product data for 8 years. Figure 4-1 shows the 20-year World Rig Count Data, while Figure 4-2 shows the 8-year World Rig Count Data.
4000 3500 A A 0 co 0 3000 2500 2000 1500 1000 500 0
~/
V~f~ 1995 1997 1999 2001 2003 2005 2007 2009 2011 2013 2015 2017 Date (Year)Figure 4-1 Annual World Rig Count data since 1995 (Baker Hughes, 2017)
In Figure 4-1, we plotted the Total World Rig Count over a period of 20 years. The graph shows that there are two types of patterns, periods of growth and periods of declines. However, overall there is a general growth trend. In Figure 4-2, there are also periods of growth and decline, with a generally neutral trend.
2008 2009 2010 2011 2012 2013
Date (Year)
2014 2015 2016 2017
Figure 4-2 Annual World Rig Count data since 2008 (Baker Hughes, 2017)
Section 4.2.1: Quantities
We started by analyzing the quantity dimension. Particularly, we observed whether quantities change during Boom and Bust cycles, and whether there is a correlation between quantity and cost. Figures 4-3, 4-4, 4-5 and 4-6 show our findings.
22 20 0 18 16 14 0 12 C 10 8 e 6 4 2 .0.. 00 0 2008 2009 0 00 0 6 6 namn e a 0 0 2010 2011 0 0 0 0 0 eme e mem ms e 0
* inmins ms euinsm em eme e *
se ee 0 nnumn
2012
Date (Year)
2013 2014 2015 2016
Figure 4-3 Quantity ordered of Product 1/order since 2008
C Q 0 4(XX) 35MX 3000 2500 20(X) 15(X) I (XX) 500 0
8 6e 4 2009 * eds 2010 2011 2012 2013 2014 Date (Year) 2015 22 20 18 16 14 12 10 8 6 21 00 2* smo 0 2008 2009
Figure 0-1 Quantity ordered of Product 2/order since 2008
0 Se se0 * 0 me e se m sue * 0 " 0 m e eme ms *
s esm * emnn eme ece e
2010 2011 2012 2013 20
Date (Year)
Figure 4-5 Quantity ordered of Product 3/order since 2008
me 0 0S0@ ms 0 14 2015 2016 22 20 18 16 14 12 10. 0 00e 2 0 2008 0 f 2016
22 20 18 16 14 12 10 8 6 4 0 2* 2 @0 00s *00 0e e 0 2008 2009 2010 2011 2012 2013 2014 2015 2016 Date (Year)
Figure 4-6 Quantity ordered of Product 4/order since 2008
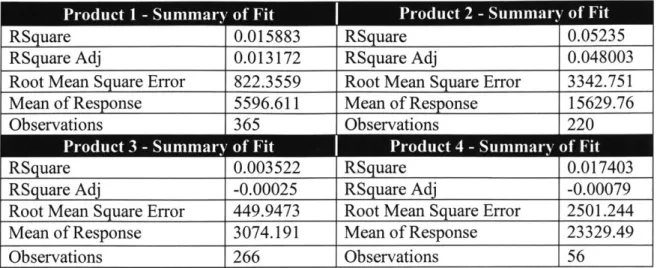
Based on the Figures 4-3, 4-4, 4-5 and 4-6, there seems to be no clear pattern that
follows a boom or bust cycle for the four sample
RSquare 0.001239
products. Quantities fluctuate with no regards to RSquare Adj 0.000135
Root Mean Square Error 2.362735
time. We conducted a regression between quantities Mean of Response 2.568908
Observations 907
ordered and a Boom/Bust dummy variable to
Table 4-1 Regression result between Aggregate
confirm the relationship. The results in Table 4-1 product quantity and Boom/Bust Dummy Variable
indicate no relationship.
Therefore, given the data we had on each of the four products, we could not prove the
first part of hypothesis 1-that quantities vary with Boom/Bust cycles. However, to establish
whether pricing follows the quantities ordered, we ran another regression between unit price and
Product I - Summary of Fit Product 2 - Summary of Fit
RSquare 0.015883 RSquare 0.05235
RSquare Adj 0.013172 RSquare Adj 0.048003
Root Mean Square Error 822.3559 Root Mean Square Error 3342.751
Mean of Response 5596.611 Mean of Response 15629.76
Observations 365 Observations 220
Product 3 - Summary of Fit AProduct 4 - Summary of Fit
RSquare 0.003522 RSquare 0.017403
RSquare Adj -0.00025 RSquare Adj -0.00079
Root Mean Square Error 449.9473 Root Mean Square Error 2501.244
Mean of Response 3074.191 Mean of Response 23329.49
Observations 266 Observations 56
Table 4-2 Regression results between the average price/order and the order quantity for each individual product
The results above show no correlation between price and quantity for the 4 sample products we used. Therefore, based on the dataset we had, we were not able to confirm the first hypothesis -quantity varies with Boom/Bust and pricing.
Section 4.2.2: External Pricing
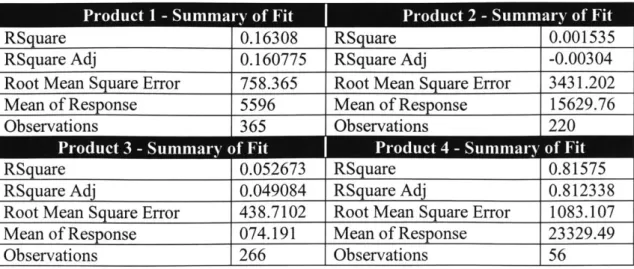
Our next step was to test whether the Hypothesis 2-external pricing rises during boom cycles and falls during bust cycles-was true. Price fluctuations are directly correlated with Boom/Bust cycles. We plotted the historic prices of all four sample products to see if there is a pattern. Figure 4-7 shows the result.
26,000 24,000 0 F* * e% 0 22,000 0 20,000 * 18,000 16,000 ese e me 14,000 12,000 0 10,000 8000 eeeee e 6000 r e pe e e %3 ?e * a -4000 ' e* N 2000 0 0 2008 2009 2010 2011 2012 2013 2014 2015 2016
Product I Product 2 Product 3 Product 4
Figure 4-7 External Cost of each product over time since 2008
Each of the products had a different result. For Product 1, it seems there was a pattern that followed the Boom in 2010, then another that followed the 2009 and 2014 Bust. The same can be said for Products 3 and 4. However, Product 2 follows more of a wild pattern. In order to confirm our observations, we ran a regression between Cost and a Boom/Bust dummy variable for each product. The results are shown in Table 4-3.
RSquare 0.16308 RSquare 0.001535
RSquare Adj 0.160775 RSquare Adj -0.00304
Root Mean Square Error 758.365 Root Mean Square Error 3431.202
Mean of Response 5596 Mean of Response 15629.76
Observations 365 Observations 220
Prdut3 unnar o itPodc 4 -Smayoit
RSquare 0.052673 RSquare 0.81575
RSquare Adj 0.049084 RSquare Adj 0.812338
Root Mean Square Error 438.7102 Root Mean Square Error 1083.107
Mean of Response 074.191 Mean of Response 23329.49
Observations 266 Observations 56
Table 4-3 Regression Results between the Cost of each individual product and a Boom/Bust Dummy Variable
While Product 4 seems like a great fit, we believe it is an exception since it came into effect in 2010, during the second Boom cycle. Despite that, the aggregate result of all data points, seen in table 4-4 seems to confinn the fact that there is no correlation between Cost and Boom/Bust cycles.
RSquare 0.046494
RSquare Adj 0.04544
Root Mean Square Error 6295.048 Mean of Response 8385.331
Observations 907
Table 4-4 Regression result between Aggregate product costs and Boom/Bust Dummy Variable
Based on that information, we cannot conclude that pricing is dependent on Boom/Bust cycles or quantities ordered.
Section 4.2.3: Internal Pricing
Hypothesis 3 is that prices charged internally stays relatively constant over time. We have explored this belief by plotting internal prices for two products over time. Below are our results.
14,000 12,000 10,000 8000 6000 4000 2000 2012 2013 2014 0 Product I 2015 Date (Year) 2016 Product 2
Figure 4-8 Internal Cost of Products 1 and 2 over time
As seen in Figure 4-8, prices for both products were not constant. The range of prices maxed out at $5,566, and reached a minimum of $4,436 for the Product 1. While the Product 2 started at $12,372, and reached a minimum of $10,191. That provides a range of approximately 20% variability. While the variability might not be as aggressive as it is with external pricing, over 60% in some cases, a 20% variability is still considered high.
Section 4.2.4: Conclusion
This section provides data-based evidence that cost, quantity and economies are not always stable or in line with common beliefs. While this conclusion was based on analyzing only four products, it does show that there are exceptions to the hypotheses.
U,
Section 4.3: Case Studies
Companies select procurement strategies that resonate well with their corporate identity as well as the industry scenario. We researched different industries such as aerospace and defense, pharmaceutical, oil and gas, and retail to understand the strategic procurement decision-making. The industry cases and interviews form the basis for the strategic-procurement framework we propose.
Section 4.3.1: Aerospace and Defense:
Boeing is among the largest global aircraft manufacturers and is the second-largest defense contractor in the world based on its 2015 revenue. Boeing brought a bold transformation in its strategy for Boeing 787: Dreamliner. To focus back on its core competencies of technology and design assembly, Boeing announced plans to outsource 65% of its manufacturing processes. However, outsourcing the engineering, manufacturing and integration shot up to 90% after the sale of the Tulsa and Wichita plants. (Elahi, Sheikhzadeh, & Lamba, 2012)
Mit bishi US. jWPan
Goodrich Kawasaki US
K~l.ASD talfSpirit
KLADAustralia Alenia Sit
btly Boeing Alenia Saab Boeing Kawasaki, Latecoere FNI
u
Ps .o * U.S. RollsWhere the Parts
U.K Goodnih Royce
Messier-Come From
Dowty'U.
Spirit saw#: Bou
Initially, the program seemed like a huge success. In 2005, Boeing published an article in Boeing Frontier, titled "The Evolution of Creation". The article introduced the reasons for the new shift
formally - affordability, better
asset use, intellectual capital
Figure 4-9: Aircraft parts outsourcing (Source: Boeing)
and cash flow increase (Arkell, 2005). However, as 2007 rolled in, the unforeseen lead times and deferred production costs increased delays eventually leading to cancellations. Stock prices plummeted from a high of $104 to a low of $30 (Elahi, Sheikhzadeh, & Lamba, 2012). The results were disastrous, leading to several years of delays and a final budget that is triple the estimate. We analyzed Boeing outsourcing strategy, below are the main pain points faced by this change in strategy:
a. Manufacturing strategy: Unlike the Electronics industry where parts are standard design and modular, airplanes have a complex design where part conformity is critical for assembly. A good example is the mid fuselage. Boeing had to issue a "Stop Work" due to structural integrity issues and apply patches to the defective areas. Outsourcing the core competency added to costs and re-works.
b. Cost of delivery: One of the main reasons companies outsource is to reduce the costs by sourcing to inexpensive suppliers. The costs of transporting huge aircraft fuselage and wings added up significantly. Also, Boeing sourcing to the industry champions didn't lead to economic advantage. Brake Control Monitoring System was awarded to General Electric (GE), which outsourced the software to Crane Co. Because of rushed delivery and imperfect testing environment, the final version of the software resulted in serious errors and feedback problems. Eventually, court battles led to Boeing paying $19 Million for a redesign cost, and bypassing GE (Elahi, Sheikhzadeh, & Lamba, 2012).
c. Manufacturing lead time: Initially outsourcing was thought to reduce total manufacturing lead time through dispersed parallel manufacturing. However, quality issues from the suppliers and re-works in system integration led to three years' delay in the final delivery in product and extended lead times for subsequent product delivery.
d. Tier 2+ Supplier Risks: Since partners had almost complete decision autonomy, many outsourced sub-system tasks to Tier 2 suppliers. The result was that Boeing was unable to manage its entire supplier base, which led to decrease in product quality.
This case demonstrates the importance of strategic factors - e.g. Manufacturing Strategy, core competencies - to the Make-vs.-Buy process.
Section 4.3.2: A major global health care and pharmaceutical company
Manufacturing site selection requires a sub-process for network management wherein the company decides where in the network the product will be made. A network comprises of different internal and external plant locations with similar capabilities. The evaluation is a two-method approach of:
a. Core competency evaluation: To understand where the product fits the overall strategic framework of the company, a strategic impact assessment of the process or the product is done. A cross-functional team comprising senior representatives, R&D, Procurement, Quality and compliance, and Network strategy is led by a product lead discusses and assigns weightage to few key intrinsic and extrinsic factors such as innovation, technology maturity, and financial impact. Technology lifecycle and innovation are critical factors in pharmaceutical industry to understand which stage is the product in its life cycle in the market. A cost benefit analysis is not carries out at this stage as it can bias the overall strategic objective and misclassify the product without considering the entirety of all factors.
b. Manufacturing site selection: Once the core competency is evaluated, it is important to identify where in the network the product would be made. The potential internal or external suppliers are identified based on criteria such as cost of delivery and manufacturing lead-time. An understanding of network evolution assists this decision-making.
Exceptions to the rule: In certain scenarios such as geopolitical uncertainty, inflation in currency exchange rates, tax regulations for a cross-country supplier, the decision is more strategic based on the network evolution. Hence, the results from the model can be overruled by the senior management.
A Hybrid Strategy: The company seldom adopts a dual strategy of procuring from external supplier to meet high existing demands until capabilities to develop the product in-house is established in the future.
Section 4.4: Results
Section 4.4.1: New decision factors
Based on our research, analysis and extrapolations, we have come up with a set of factors that should be considered when making the decision for Make-vs.-Buy. We started by segmenting into intrinsic advantages and extrinsic advantages. Below is a description for each of the segments:
Intrinsic advantages: Those are advantages gained by internal dynamics. For instance: Manufacturing strategy, Intellectual Property rights, Technological factors. The factors deal heavily with the business composition, competitive edge and strategy.
Extrinsic advantages: Any advantages that are gained by market conditions, for example: Market cost, or any advantage earned due to external conditions.
Following that segmentation, we further drilled down into four distinct criteria: Strategic and Technological factors fall under the intrinsic segment, while Market and Economic factors are extrinsic factors. Figure 4-10 demonstrates the factors and their relationships.
Furthermore, we have created an evaluation sheet that provide certain questions to be answered in each of the four criteria. Table 4-5 provides the evaluation sheet.
Does the product/technology fit the business strategy? Is the product/technology core to the business?
Strategic 25% Do we have the capacity to build the product?
Can we scale up the operations?
Intrinsic Do we have the skills to make the product?
Advantages
Is the product design modular for parts assembly?
Technological 25% What is the manufacturing/delivery lead time?
Is the product/technology patented? What are the IP risks?
What is the technology differentiation? What are the barriers to entry?
What is the availability of complementary assets?
Market 25% Can we achieve economies of scale?
Do we have alternate suppliers in the market?
Extrinsic Is the supplier market stable? What is the dependence risk?
Advantages What are the geopolitical risks involved?
What are the switching costs?
Economic 25% Do we need an investment upfront?
What are the transactional costs?
Is the currency exchange rate inflated for cross-country suppliers?
Table 4-5 Decision factors Evaluation sheet
Once all segment questions have been answered, the results can be applied to the 2x2 matrix shown in Figure 4-11. The matrix will provide a better sense of what should be done. We have identified four possible outcomes:
1. Buy Outright/Divest: Products in this quadrant typically have low strategic value to the company. They also have no market or economic advantage and therefore, must be procured from external suppliers.
2. Make Outright/Invest to make: This segment has the company's top products, differentiators, or the company's core competency and company must invest to make these products in-house.
3. Contract to Buy (Strategic alliances): This product quadrant is important to the company's core business; however, the company has a low competitive advantage and low economies of scale to manufacture the product. The best course of action is to partner with a manufacturer through contract manufacturing.
4. Contract to Sell (Industry alliances): This product category has less importance to the core business, or doesn't leverage the company's core competency. For instance, byproducts in a pharmaceutical industry are a part of the manufacturing process and have low strategic advantage. However, the company has economic advantages from manufacture it in-house as it can sell its excess at a markup to other industries or competitors. Contract to Sell Buy or Divest Make or Invest to Make Contract to Buy
Intrinsic Advantages (Strategic/Fechnological) Figure 4-11 2x2 matrix
t
41
Section 4.4.2: Evaluating Boeing strategy for Dreamliner 787
We evaluated Boeing's outsourcing strategy as discussed in section 4.3.1 using the
framework model to understand where does Boeing strategy lie on the 2x2 matrix.
Does the product/technology fit the business
strategy? 5 0.25
10% Is the product/technology core to the business? 5 0.5
3% Do we have the capacity to build the product? 3 0.09 3% Can we scale up the operations? 1 0.03 3%
10%
Do we have the skills to make the product? Is the product design modular for parts assembly?
5 0.15
0.1
10% Is the manufacturing/delivery lead time from 5 0.5
suppliers significant?
Is the product/technology patented? Can we entail 3 0.09 the risks of IP Loss?
3%
0%
Do we have a technology differentiation to make the
nroduct inhouse?
How significant are the barriers to entry?
5
0
0.15
0
0% Are the complementary assets available? 0 0
4% Can we achieve economies of scale with inhouse 1 0.04
production?
10% Do we have alternate suppliers in the market'? 5 0.5
4% Is the supplier market stable? What is the 5 0.2 dependence risk?
4%
10%
What are the geopolitical risks involved? ' What are the switching costs?
3
3
0.12
0.3
8% Do we need a significant investment upfront? 5 0.4
5% What are the transactional costs for supplier 5 0.25 management?
5% Is the currency exchange rate inflated for
cross-count suppliers?
Table 4-6 Boeing Evaluation Sheet
0.15 Intrinsic Advantage Extrinsic Advantage Strategic Factors Technological Factors Market Factors Economic Factors 5% I
Table 4-6 shows the scoring based on our analysis of the Boeing case and does not use any company attested data.
Contract to Sell Buy or Divest Make or Invest to Make 2.5 8 0.5
0.5 Intrinsic Advantages (Strategic/Technological) 2.5
Figure 4-12 Boeing's 2x2 decision matrix
Few crucial factors such as modularity of parts, core strategy, supplier lead time, transactional costs from suppliers and others have an exorbitant impact on the outsourcmg strategy. Figure 4-12 shows the total weighted score of 1.86 and 1.96 for intrinsic and extrinsic advantage (out of 2.5) plotted on the 2x2 matrix, indicating the overall strategy is to Make or Invest to make.
Contract to Buy
M