CALTECH/MIT
VOTING TECHNOLOGY PROJECT
A multi-disciplinary, collaborative project ofthe California Institute of Technology – Pasadena, California 91125 and
the Massachusetts Institute of Technology – Cambridge, Massachusetts 02139
TITLE
The American Internet Voter
Name Thad E. Hall
University University of Utah
Name Betsy Sinclair
University University of Chicago
Key words:
VTP WORKING PAPER #97
September 2009
The American Internet Voter
Abstract
Since the creation of the Internet, there have been a seemingly never-ending number of books and analyses about the role of the Internet in politics. Many of these books fail to keep in mind that the behavior of elites—the well-educated and politically active individuals who often represent the peer group of these authors—is not generally representative of the behavior of the public at large. Pundits and scholars alike have remarked that 2008 appeared to be a revolutionary year in the use of the Internet in political campaigns, but few have systematically examined the role of the Internet in participatory politics for the average voter. Instead of relying on case studies, this paper uses nationally representative survey data from 2004-2008 to determine how the general public uses—or does not use—the Internet in their political lives. We then consider whether the patterns of use for this technology appear different in the November 2008 General Election cycle. We focus our concerns in the context of increasing polarization of both some fraction of the American electorate and the policy platforms of elected officials.
Thad E. Hall, University of Utah
Associate Professor of Political Science and Research Fellow, Institute of Public and International Affairs
Betsy Sinclair, University of Chicago
Assistant Professor of Political Science [email protected]We thank members of our panel at the 2009 American Political Science Association Meeting in Toronto, Canada for helpful discussion and Danielle Glazer for research assistance.
1
Introduction
Since the Internet became something in widespread use in the 1990s, there have been a seemingly never-ending number of books, articles, and analyses about the role of the Internet in politics. These works have identified various aspects of the role of the Internet in the political sphere and the way in which individuals use this tool in the political realm of their lives. For example, Marc Ambinder wrote in June 2008 the following:
The communications revolution under way today involves the Internet, of course, and if Barack Obama eventually wins the presidency, it will be in no small part because he has understood the medium more fully than his opponents do. His speeches play well on YouTube, which allows for more than the five-second sound bites that have characterized the television era. And he recognizes the
importance of transparency and consistency at a time when access to everything a politician has ever said is at the fingertips of every voter. …Obama has truly set himself apart by his campaign’s use of the Internet to organize support. No other candidate in this or any other election has ever built a support network like Obama’s. The campaign’s 8,000 Web-based affinity groups, 750,000 active volunteers, and 1,276,000 donors have provided him with an enormous financial and organizational advantage in the Democratic primary.
The idea, of course, is that the Internet is revolutionizing politics.1 However, the Internet could be a mechanism for accomplishing this, as suggested in the quote above in many different ways. The web may allow individuals to be involved in politics in new ways, donate to campaigns more easily, and allow candidates to organize individuals more effectively. Interestingly, the Internet revolution has occurred at the same time that there has also been an explosion in the use of face-to-face contacting in campaigns. Numerous studies have found that such communications are very effective in getting individuals to turn out to vote and to listen to new information from candidates.2
1 Of course, as Ambinder notes in the article, the well-functioning post office, newspapers, and radio were also
revolutions in politics as well.
2 For an example of such a study: Arceneaux, Kevin and David Nickerson. 2006. ``Even if You Have Nothing Nice
2
The question we are interested in examining in this article is to determine how the public uses—or does not use—the Internet in their political lives. Both the General Social Survey and the Pew Internet and American Life Project allow us to gain leverage over several key questions regarding the Internet in the political sphere and to contrast political Internet use with Internet use more broadly. We are specifically interested in the use of the Internet by partisans and if there are partisan
differences in Internet use patterns. We also investigate claims that the use of the Internet by partisans could make them more radical in their views and could make them more engaged in the process. We examine these issues using survey data from 2004 to 2008. We find that Internet users are not divided by a partisan difference; Democrats are neither more likely than Republicans (or other party registrants) to be active web users nor use the Internet for political purpose. We see no systematic evidence that the Internet users in 2008 are substantially different than the Internet users in 2004, although we highlight a few small differences in our empirical analysis. We do see
indications that individuals who use the Internet to confirm their existing political preferences are increasingly likely to participate and additionally that users with access to the Internet are
increasingly likely to donate to political campaigns.
Internet and Politics – Theory and Commentary
Technological inventions have advanced the playing field for politicians for years. The printing press, radio, television, and the Internet have provided politicians useful outlets to get their messages out to citizens. With each advancement, the availability of information has been expanded making citizens better informed thus making the voting process more democratic. Participating in the newest technologies is imperative for politicians to stay relevant and remain competitive.
The growth of the printing press and newspaper chains made newspapers a prime resource for media coverage. With literacy rates increasing and the expansion of the printing press, politicians realized newspapers were an ideal vehicle for speedy media coverage making the transfer of information more efficient and speedy. With higher literacy rates, politicians had the opportunity to gain the
attention of a larger audience. The variety of newspaper chains helped to create competition between the newspapers for coverage of cutting edge stories and different editorial positions. In addition, information could be given first hand rather than traveling by word of mouth from town to town (Bimber 2003; Bimber and Davis 2003).
Television entered the scene threatening to change the entire landscape of campaigning. It was believed to be capable of providing information to an even broader audience than the previous
manuscript. Prepared for presentation at the 2005 Meeting of the American Political Science Association, September 1-4, Washington, D.C.
3
technologies and bring politics to the masses with greater accuracy and even greater speed. It would also give citizens an idea of the man or woman behind the politician by enhancing the transparency of political campaigns. The latest wave of technology, the Internet, has given political campaigning a facelift and has dramatically changed how politicians campaign. It has changed campaigning more than the printing press, radio, and television combined. American politicians have campaign websites, fundraise online, blog, email citizens, and participate in a whole host of other activities all made possible by the Internet (Cornfield 2004; Frantsich 2002; Graff 2007)
The Internet has been depicted as having the greatest capacity to improve democracy and
democratic institutions. The Internet is thought to increase democratic accountability, character, and the integrity of political campaigns, although one where there can also be a divide between haves and have nots (Smith, Schlozman, Verba, and Brady 2009; Krueger 2002; Best and Krueger 2005; Mossberger, Tolbert, and Stansbury 2003; Norris 2001). A candidate’s campaign promises become a contract with the citizens (Anderson and Cornfield 2003; Bimber 2003. The candidate, if he wins, can be held responsible in the next election should he neglect these promises thus promoting
accountability. Information is more readily accessible (e.g., Kenski and Stroud 2006). A citizen can visit one candidate’s website, review that candidate’s platforms, and then visit an opposing
candidate’s website and review that candidate’s platforms. Most candidates’ websites also allow visitors to email questions allowing citizens to communicate with the candidate. Another unique characteristic of the Internet, which is something that radio and television do not offer, is that citizens can be interactive with one another and deliberate online. All of this can be done
inexpensively, conveniently, and easily on a global scope. It increases the likelihood that citizens will become more engaged and involved but can also increase polarization (Mossberger, Tolbert, and McNeal 2008; Tolbert and McNeal 2003; Kimball and Gross 2006).
As citizens become more engaged, involved, and most importantly tech savvy, they develop expectations for a candidate’s website content (Wagner and Gainous 2009; Trent and Friedenberg 2007; Chadwick 2006). The website design must be visually pleasing and easy to navigate. If a voter has a question about a specific issue, the voter wants to be able to immediately find the answer on the candidate’s website. The website cannot simply list the candidate’s positions. A sparse or cluttered website will not gain interest and is not tapping into the full potential of the Internet. Not only is the web design important, but the candidate’s appearance on the web becomes important too. A candidate will want to honestly present himself and communicate the traits and accomplishments that make him unique to the other candidates. If a candidate is dishonest in listing his
accomplishments, it will surface causing skepticism. Emphasizing a common personal background may also help to give a candidate an edge.
4
Once a citizen has been exposed to a candidate’s website, the candidate’s next motives are to encourage subscription on his email list, move interested web visitors from spectators to activists, receive donations, and persuade undecided voters. Email lists show that not only was a website visitor willing to take the time to trawl the website but the visitor was also willing to give contact
information to receive highlights and updates of the campaign broadening the supporter base (Bimber and Davis 2003). This can also lead to political discussion groups, blogging, and other online venues promoting discourse. Too frequent emails can be a turn-off to some voters; therefore, politicians must be careful of this.
The second major objective is to move web visitors and email subscribers from passivity to activism. By mobilizing voters and getting them excited about the campaign, a candidate can create a large volunteer group to work on the campaign advancing its message. Email reminders of rallies, candidate appearances, and invitations to help can lead to volunteerism (Bimber and Davis 2003).
In addition to email lists and volunteerism is online fundraising. Raising money on the Internet poses few obstacles. Internet donors can make a donation that is just as easy as making an ATM
transaction and it can be done at any time of day or night. Donations do not have to be solicited through the mail; therefore, if a voter identifies with a candidate that voter can immediately contribute. Responses to the contribution can be personally tailored and delivered instantly (Cornfield 2004).
Persuading undecided voters is also a main objective. Candidates try to make their issue positions and biographies prominent on the home page to lure undecided voters into clicking for more
information. The difficulty candidates face is in gauging how many of the visitors are undecided. It becomes complicated for a candidate to know how to design the website for undecided voters and decided voters too. Be a voter undecided or decided, the voter is likely to visit the web for candidate information.
Hypotheses and Data
There are many claims—such as the ones made above—about how individuals use the Internet in politics. But how do people actually use the Internet in major political campaigns? We use data from the 2004, 2006, and 2008 Pew Internet and American Life Post-Election Tracking Surveys to examine the question of how individuals use the Internet in these elections and to determine what makes an individual a political Internet user.
We take advantage of three surveys conducted by the Pew Internet and Life Project in 2004, 2006 and 2008, respectively, to gain some insight into the differences between those individuals who are
5
regularly using the Internet and those who are not. These surveys allow us to look for differences in the characteristics of Internet users compared to non-Internet users as well as to test for differences in their political behavior.3
Pew conducted these surveys via telephone interviews of adults living in the continental United States using random digit dialing with both landline phone and cell phone to produce a nationally representative sample. As many as ten attempts were made to contact each phone number and phone calls were staggered over days of the week and hours of the day. Each survey was in the field for approximately two weeks after the November general election and was able to obtain data on approximately 2300 respondents – November 2008 included 2254 adults and included 1591 Internet users and 1186 online political users, for example, whereas November 2004 included 2200 adults of whom 1324 were Internet users and 937 were online political users.
Each survey asks the respondents to identify the ways in which they use the Internet; in this analysis, we will focus both on basic Internet usage as well as Internet usage targeted for gaining information about or communicating about politics. We focus on whether or not there are statistically significant differences between Internet users and non-Internet users in terms of their socioeconomic and
demographic variables as well as in their political preferences and opinions. We focus on patterns that we see emerging for each year, and we address whether or not these patterns are different for 2008.
Internet Access: Changes from 2004-2008
Before delving into the data on the use of Internet in American politics, it is important to put the use of the Internet in general into context. The US Bureau of the Census has been asking American households about computer usage since 1984 and about Internet usage since 1997 as part of the Current Population Survey. As we see in Figure 1, since 2001, over half of American households have had connectivity to the Internet. However, between 2001 and 2007, Internet connectivity only increased by about 10 percentage points; just over 60% of households has an Internet connection.
[Figure 1 about here]
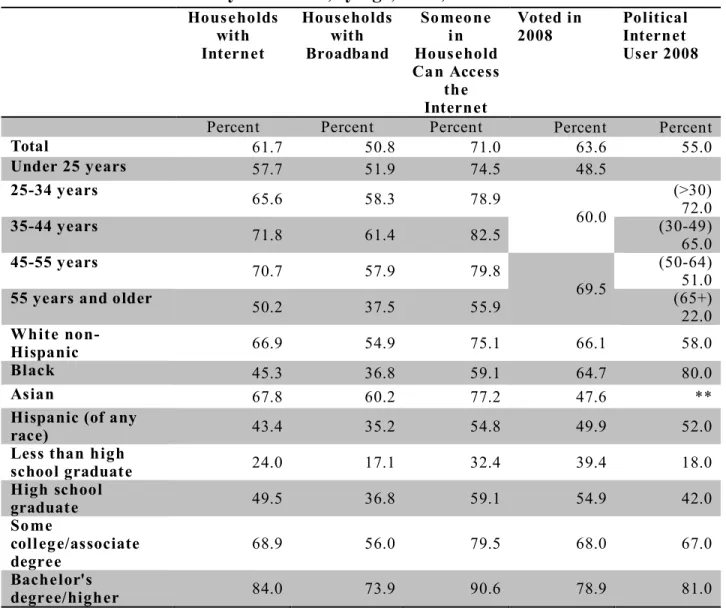
In Table 1, we examine Internet connectivity in 2007, we see that there remain gaps between those who are and are not connected. The better educated are more likely to be online compared to those with high school degrees or less; Whites and Asians are also more likely to be online compared to
3
The Pew Internet & American Life Project publishes an analytical report for each election. See Smith 2009; Rainie and Smith 2008; Rainie, Horrigan, and Cornfield 2005.
6
Blacks and Hispanics. Table 1 also illustrates an interesting point about studying the Internet and politics. When we compare the first three columns—which show household Internet access in 2007—with the fourth column, which are individual voting percentages in 2008, we see that there are often disconnects between households with Internet access and people in those households voting. These disconnects are more apparent when we compare the individual voting in 2008 by
demographics with the data on political Internet use in 2008 from the Pew Internet and American Life Project data. Here, we see that these disconnects remain high, especially for older voters—who vote at high rates but are not political users compared to younger individuals who claim to be
political Internet users but do not vote at nearly the same rate they engage in online political activity. This basic question about the relationship between Internet political use and voting is something for further exploration, especially for populations with high Internet penetration and low voting rates (e.g., younger individuals).
[Table 1 about here]
Internet Use in the Political Process: Changes from 2004-2008
Our examination of changes in the use of the Internet in politics starts with a descriptive review of data from the Pew Internet and American Life Project.4 The changes in the use of the Internet in politics can be seen first in the differences in survey questions asked in 2004 compared to 2008. For example, the 2008 survey asked questions about the use of Facebook and Twitter, technologies that were not in wide circulation in 2004. The 2008 survey also asks questions about blogging more directly than was done previously, when it was included generally as a part of discussions of online forums and listservs. Below, we conduct paired sample t-tests on the means of a series of variables where we compare Internet users to non-Internet users using the 2004 and 2008 data. It is
particularly convenient to compare 2004 data to 2008 data as both years represent presidential election contests, where general interest about politics is likely to be particularly high.
2004 Survey Data
Full-time employment again was a statistically significant demographic characteristic differentiating Internet and non-Internet users in 2004. Almost twice as many Internet users as non-Internet users were fully employed. 51% of Internet users reported that they lived in suburban areas but only 43% of non-Internet users said they lived in suburban communities. Marriage rates between Internet and
4
Data from this project and related reports can be found at http://pewinternet.org/Reports/2009/6--The-Internets-Role-in-Campaign-2008.aspx (2008 report); http://pewinternet.org/Reports/2007/Election-2006-Online.aspx (2006 report); and http://pewinternet.org/Reports/2005/The-Internet-and-Campaign-2004.aspx (2004 report).
7
non-Internet users differed by about 10%, with more Internet users than non-Internet users being married.
Although 36% of Internet users and 35% of non-Internet users considered themselves conservative, 45% of Internet users and 39% of non-Internet users voted for Bush. Similarly, 32% of Internet users called themselves Republican but only 23% of non-Internet users categorized themselves as Republican. These statistics suggest that, as a broad generalization, Internet users are slightly more Republican than non-Internet users.
The differences between Internet and non-Internet users who follow current political affairs “most of the time” show that Internet users are more up-to-date with current politics than non-Internet users. Non-Internet users were less politically active than Internet users, too. Though statistically
insignificant, 10% fewer non-Internet users were registered to vote in November 2004 than Internet users. Internet usage also made no difference in when respondents decided for whom to vote. These results suggest that although the Internet may keep people better informed about current issues, this does not influence how or whether Americans vote.
2008 Pew Internet and American Life Survey Data
By 2008, 55% of Internet users and 45% of non-Internet users lived in suburbia. In addition, 57% of Internet users and only 38% of non-Internet users reported that they were married. Full-time
employment is no longer statistically significant when comparing mean employment for the Internet and non-Internet user groups. Almost a majority of both non-Internet and Internet users voted for Obama and Biden in the 2008 election; 48% of Internet users and 54% of non-Internet users voted Democratic, but only 38% of Internet users and 27% of non-Internet users voted for McCain (25% of survey respondents refused to specify which candidate they voted for.) Finally, 10% more
Internet users claim to get their political information from online sites that share their point of view than sites that challenge their point of view.
Multivariate Survey Analysis
The previous section described only minimal differences between Internet users and non-Internet users and noted that there were no dramatically different differences in our analyses between the patterns of use in 2004 compared to 2008. In our multivariate analysis, we consider the factors that affect five types of behaviors involving Internet—(1) general Internet access, (2) accessing news online, (3) acquiring political information online, (4) using e-government, and (5) sending and receiving political emails.5 Our goal is to examine the extent to which these behaviors are predicted
8
by covariates in our survey data, especially political variables. The political variables we examine are (1) Democratic Party candidate choice, (2) party identification (Democrat), and (3) campaign contact. The first two of these variables are personal political attributes and the third attribute is a proxy for whether or not the respondent has been exposed to other information about the campaign. To the extent each of these variables are predictive, we then gain some insight into the degree to which Internet use may result in different outcomes. In particular, we would like to challenge the commonly held belief that particular groups of partisans are more or less likely to have access to the Internet.
First, we generate a binary variable if the respondent reports any Internet use. We then generate additional variables if the respondent reports getting news online, getting political campaign
information online, or getting information from governmental web pages online. Our final variable is an indicator that describes whether the respondent sends or receives political emails. We
summarize each of our variables in Table 3. These variables can be interpreted as a percentage (with a value of 1 being 100 percent), so that for example in 2004 31% of the respondents report sending or receiving political emails.
[Table 3 about Here]
These variables are very closely comparable across years despite variations in survey wording – there are examples which make comparisons difficult, in 2006 for example the survey wording was quite different for whether or not the respondent sent or received political emails, and this makes it difficult to draw an actual comparison for email across years – but most survey questions are nearly identical. Yet for most questions, the question wording is sufficiently comparable that we are able to discern clear patterns in the respondents’ Internet use patterns. Additionally, within each year, each question does allow us to investigate the relationship between these variables and the demographic and socioeconomic characteristics of the survey respondents.
Starting in 2004, we see that 60% of the respondents report having Internet access. This increases to 66% in 2006 and to 70% in 2008. Only 42% of respondents report accessing their news online in 2004, where 50% report accessing their news online in 2008. The difference is particularly stark in terms of the 2004 to 2008 difference for respondents who report getting their political information online: 39% in 2004 and 74% in 2008. We also see a slight increase in the percentage of
respondents who report accessing the Internet to gain information about e-Government: 34% in 2004 increases to 42% in 2008. There is a decrease in 2006 for the number of individuals who report sending and receiving political emails in comparison to 2004 and 2008; perhaps because of lower interest due to it being an off-year election.
9
In Table 4, we summarize each of the characteristics we observe for each respondent. We are particularly interested in determining to what extent a respondent’s political affiliations – party identification or vote choice – will be different between Internet users and non-Internet users. While most of these variables are again percentages, income and education are categorical and age is
reported in years.
[Table 4 about Here]
Because of the breadth of the data, we are able to determine whether or not the respondent recalls being contacted by a political campaign. We are also able to ascertain if the respondent believes the country is heading in the right direction. We know a large number of demographic variables about each respondent, including their age, marital status, employment status, party identification, income, race, and gender. In each of the regressions, these become key independent variables in our models. Our respondents are slightly older in 2008 than in 2004 (49.4 years old in 2004 compared to 55.2 years old in 2008) and have slightly more income. They are also less likely believe that the country is heading in a satisfactory direction.
Tables 5-9 present the coefficients from logistic regressions, which incorporate each of the variables we observe for each respondent as independent variables and try to predict the online behaviors. Each unit of observation is an individual while each column represents the coefficients from that regression for this particular year. Our primary goal from these exercises is to look for trends in prediction; that is, trends in participation in online government or online politics in some way and in particular, trends in internet use. We bold the statistically significant coefficients so that these patterns emerge. Because our dependent variable in each case is binary—whether an individual engages or does not engage in a specific online activity—we use logistic regression for each analysis.
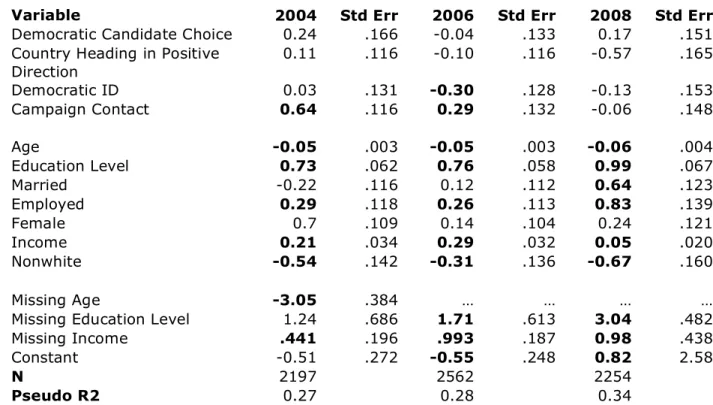
Internet Access
Across each of the five models, the regression coefficients show a clear trend: the role of the Internet in political life is not dominated by politics. Looking first at Internet access in 2004-2008 (Table 5), we see that there are differences across the three elections, especially between the off-year 2006 election and the two presidential elections. The constants across all three elections are that older individuals use the Internet significantly less, that better educated individuals access the Internet more, and that individuals who are employed access the Internet more. When we look at the
political variables, we see that there is no effect of voting for the Democratic candidate nor for identifying with the Democratic party. Only in 2008 is there any effect for the direction of the country on Internet access. Campaign contact is correlated with increased Internet access in 2004
10
and 2006 but not in 2008, and race (nonwhite) is negatively associated with Internet access in 2004 and 2008.
[Table 5 here]
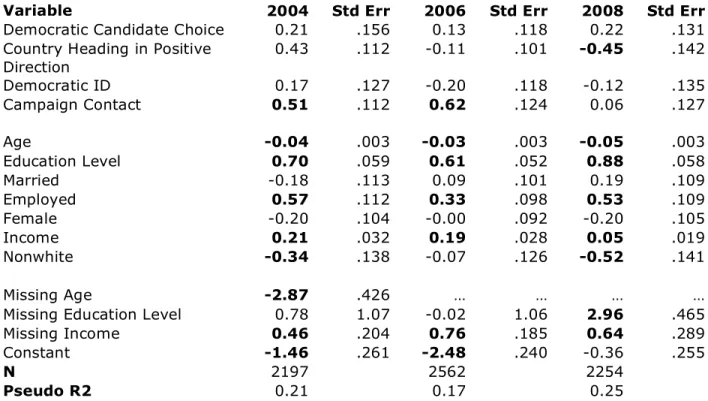
Accessing News and Acquiring Political Information Online
Table 6 shows that, when we consider who accessed online news in 2004 and 2006, we see that older people access news less than young people. We also see that education level matters in both the 2004 and 2006 elections, as does income. Importantly, we do not see any explicitly political factors having an effect on accessing the news online in 2004 or 2006. In 2008, there is a statistically significant effect of decreased access of news online for individuals who report that the country is heading in a positive direction.
[Table 6 here]
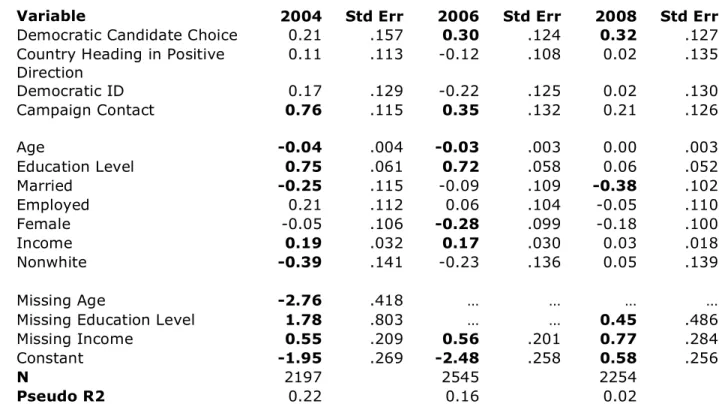
When we move to acquiring political information online, we see the same age affects as with accessing news online. We also see in Table 7 that in 2004 and 2006, the individuals contacted by candidates also acquired more political information than did others. Vote choice and party identification did not affect the decision about acquiring political information online in 2004, suggesting that the Internet is not purely the playground of one party or the other. Yet in both 2006 and 2008, there is a statistically significant and positive effect of voting for the Democratic presidential candidate (Obama) and acquiring political information.
[Table 7 about here]
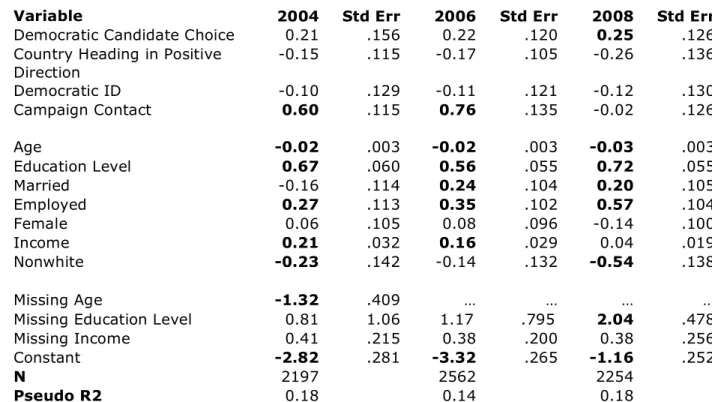
Using E-Government
In Table 8, we see a strong digital divide affect in 2004 and 2006 —but not a political affect—in those who use e-government. Age, education, income, and employment all are strong predictors of using e-government. In 2008, there was an indication that individuals who voted for Democratic candidates were also more likely to be using e-government than were others.
[Table 8 here]
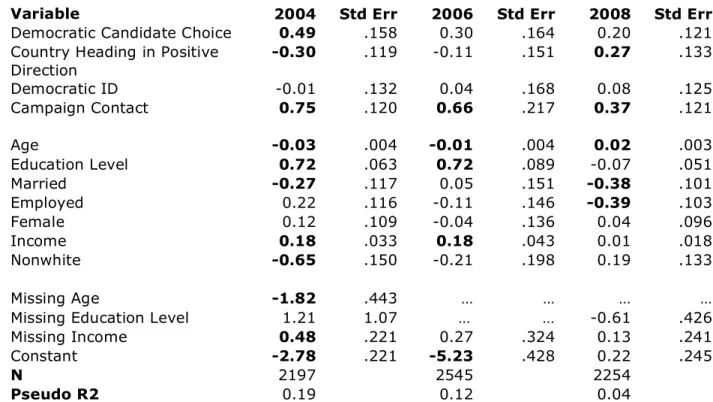
Sending Political Emails
The seeking of information is different from the active use of the Internet for expressing oneself or proactive political activities. We also see, across all three elections, that individuals who were
contacted by candidates or political parties also engaged in more emailing than did others. This could be the result of candidates contacting more high propensity voters, who would be more likely to
11
engage in such activities. In 2004 we also see that individuals who voted for Democrats were more likely to contact others.
[Table 9 about here]
To summarize our findings across each of these behaviors, we again look for patterns of use. Individuals who use the Internet at all or for accessing news online were less likely to do so if they were older (6/6 age coefficients are negative and statistically significant) or nonwhite (5/6
coefficients are negative and statistically significant). Individuals are more use the Internet or to access news online if they were better educated (6/6 education coefficients are positive and statistically significant), had higher incomes (6/6 coefficients are positive and statistically significant), were employed (6/6 coefficients are positive and statistically significant) or were contacted by the campaign (4/6 coefficients are positive and statistically significant). The
coefficients for the missing data variables are mixed (4/14 negative and statistically significant, 9/14 positive and statistically significant). We observe one political coefficient that is significant – in 2008, individuals who report that the country is heading in a positive direction are less likely to access news online.
We contrast these patterns with the variables used to describe the political use of the Internet: accessing specifically political information, using the Internet as an e-government resources, or sending and receiving political emails. Here we again see less use associated with age (7/9 age
coefficients are negative and statistically significant, 1/9 age coefficients are positive and statistically significant) or nonwhite race (4/9 negative and statistically significant). We also see more use associated with education (7/9 coefficients are positive and statistically significant), were contacted by the campaign (7/9 coefficients are positive and significant) and income (6/9 positive and statistically significant). This pattern is less clear for employment (3/9 positive and statistically significant, 1/9 negative and statistically significant) and for the coefficients for missing data variables (3/21 negative and statistically significant and 7/21 positive and statistically significant). We observe many more political variables that are significant. Of the nine coefficients for the indicator if the respondent has voted for the Democratic candidate, four are statistically significant and positive. Twice the coefficient for the indicator if the country is heading in a positive direction is significant, but the coefficient is once negative and once positive. Key to all of these regressions, however, is that not a single time does the party identification indicator yield a statistically
12
Conclusion
We find that, although there are observable variables that drive Internet use and consumption of news and political information online, they are not variables that are broadly characterized as
political, but instead follow general patterns of those relating to the allocation of time. This suggests that in fact any differences which we observe emerging from American Internet voter are those due to exposure to the medium of the Internet itself and will allow us to in future research investigate mechanisms which can drive differences in policy preferences. We conclude with a single set of regression coefficients in Table 10. Here, we look at two pairs of variables. First, we compare an indicator variable for whether or not the respondent reported turning out to vote with their self-stated reason for going online – whether they went online to confirm their own political views. Consistent with work by Diana Mutz (2006), those who went online to confirm their views are in fact more likely to vote. Additionally, again contrasting 2004 to 2008, we focus on individuals who made political donations in those years and consider the relationship between political donation and whether or not the respondent has Internet access. Here, those with Internet access are more likely to make political donations. Worthy of note, however, is that the coefficient in 2008 is 3.5 times larger than that in 2004. The role of the Internet in individual’s political lives is changing.
[Table 10 Goes Here]
Yet, the basic American Internet voter has not yet become polarized by party identification. Across each of our regressions, we see very zero statistically significant coefficients for Democratic
identification. Other socioeconomic or demographic variables that predict other types of political participation as well, such as education, and age, are good predictors of Internet activities.
13
Tables and Figures
Figure 1: Internet Access in the United States, 1997-2007
14
Table 1: Internet Access by Household, by Age, Race, and Education
Households with Internet Households with Broadband Someone in Household Can Access the Internet Voted in 2008 Political Internet User 2008Percent Percent Percent Percent Percent
Total 61.7 50.8 71.0 63.6 55.0 Under 25 years 57.7 51.9 74.5 48.5 25-34 years 65.6 58.3 78.9 (>30) 72.0 35-44 years 71.8 61.4 82.5 60.0 (30-49) 65.0 45-55 years 70.7 57.9 79.8 (50-64) 51.0
55 years and older 50.2 37.5 55.9 69.5 (65+)
22.0 White
non-Hispanic 66.9 54.9 75.1 66.1 58.0
Black 45.3 36.8 59.1 64.7 80.0
Asian 67.8 60.2 77.2 47.6 **
Hispanic (of any
race) 43.4 35.2 54.8 49.9 52.0
Less than high
school graduate 24.0 17.1 32.4 39.4 18.0 High school graduate 49.5 36.8 59.1 54.9 42.0 Some college/associate degree 68.9 56.0 79.5 68.0 67.0 Bachelor's degree/higher 84.0 73.9 90.6 78.9 81.0
15
Table 2: Internet Access by Individual, by Age, Race, and Education
Households
with
Internet
Households
with
Broadband
Someone in
Household
Can Access
the Internet
Voted in
2008
(individuals
)
Percent
Percent
Percent
Percent
Total
61.7 50.8 71.0 63.6Under 25 years
57.7 51.9 74.5 48.525-34 years
65.6 58.3 78.935-44 years
71.8 61.4 82.5 60.045-55 years
70.7 57.9 79.855 years and older
50.2 37.5 55.9 69.5White non-Hispanic alone
66.9 54.9 75.1 66.1Black alone
45.3 36.8 59.1 64.7Asian alone
67.8 60.2 77.2 47.6Hispanic (of any race)
43.4 35.2 54.8 49.9Less than high school
graduate
24.0 17.1 32.4 39.4
High school graduate
49.5 36.8 59.1 54.9Some college, associate degree
68.9 56.0 79.5 68.0Bachelor's degree or higher
84.0 73.9 90.6 78.916
Table 3: Internet Usage Summary by Variable Mean: 2004, 2006 and 2008
Variable 2004 2006 2008 Internet Usage 0.60 (.49) (.47) 0.66 (.46) 0.70 News Online 0.42 (.49) (.49) 0.40 (.50) 0.50 Politics Online 0.39 (.49) 0.29 (.46) 0.74 (.44) E-Government 0.34 (.47) (.47) 0.32 (.49) 0.42 Sends/Receives Political Email (.46) 0.31 (.31) 0.11 (.46) 0.69 Total Observations 2197 2562 2254
Source: PEW Internet and Life Project November 2004-2008 surveys. Specific question wording is including in the appendix. Standard deviations are in parenthesis below each mean. While these patterns denote potentially interesting trends, note that no values are statistically distinguishable across years.
17
Table 4: Independent Variable Summary by Year: 2004, 2006 and 2008
Variable 2004 2006 2008
Country Heading in Positive
Direction 0.46 0.31 0.16 Age 49.4 50.7 55.2 Education Level 2.82 2.84 2.83 Married 0.57 0.55 0.56 Employed 0.47 0.48 0.41 Democratic ID 0.33 0.32 0.35 Income 4.79 4.93 5.96 Campaign Contact 0.66 0.79 0.20 Nonwhite 0.19 0.18 0.17 Female 0.53 0.52 0.53 Total Observations: 2197 2562 2254
18
Table 5: Logistic Regression Coefficients for Internet Access 2004, 2006 and 2008
Variable 2004 Std Err 2006 Std Err 2008 Std Err
Democratic Candidate Choice 0.24 .166 -0.04 .133 0.17 .151 Country Heading in Positive
Direction 0.11 .116 -0.10 .116 -0.57 .165 Democratic ID 0.03 .131 -0.30 .128 -0.13 .153 Campaign Contact 0.64 .116 0.29 .132 -0.06 .148 Age -0.05 .003 -0.05 .003 -0.06 .004 Education Level 0.73 .062 0.76 .058 0.99 .067 Married -0.22 .116 0.12 .112 0.64 .123 Employed 0.29 .118 0.26 .113 0.83 .139 Female 0.7 .109 0.14 .104 0.24 .121 Income 0.21 .034 0.29 .032 0.05 .020 Nonwhite -0.54 .142 -0.31 .136 -0.67 .160 Missing Age -3.05 .384 … … … …
Missing Education Level 1.24 .686 1.71 .613 3.04 .482 Missing Income .441 .196 .993 .187 0.98 .438 Constant -0.51 .272 -0.55 .248 0.82 2.58
N 2197 2562 2254
Pseudo R2 0.27 0.28 0.34
Values in bold indicate coefficients that are statistically significant at the 95% level. Dependent variable is an indicator which describes whether or not the respondent has Internet access.
19
Table 6: Logistic Regression Coefficients for Accessing News Online 2004, 2006 and 2008
Variable 2004 Std Err 2006 Std Err 2008 Std Err
Democratic Candidate Choice 0.21 .156 0.13 .118 0.22 .131 Country Heading in Positive
Direction 0.43 .112 -0.11 .101 -0.45 .142 Democratic ID 0.17 .127 -0.20 .118 -0.12 .135 Campaign Contact 0.51 .112 0.62 .124 0.06 .127 Age -0.04 .003 -0.03 .003 -0.05 .003 Education Level 0.70 .059 0.61 .052 0.88 .058 Married -0.18 .113 0.09 .101 0.19 .109 Employed 0.57 .112 0.33 .098 0.53 .109 Female -0.20 .104 -0.00 .092 -0.20 .105 Income 0.21 .032 0.19 .028 0.05 .019 Nonwhite -0.34 .138 -0.07 .126 -0.52 .141 Missing Age -2.87 .426 … … … …
Missing Education Level 0.78 1.07 -0.02 1.06 2.96 .465 Missing Income 0.46 .204 0.76 .185 0.64 .289 Constant -1.46 .261 -2.48 .240 -0.36 .255
N 2197 2562 2254
Pseudo R2 0.21 0.17 0.25
Values in bold indicate coefficients that are statistically significant at the 95% level. Dependent variable is an indicator for whether or not the respondent accesses news online.
20
Table 7: Logistic Regression Coefficients for Acquiring Political News and Information O nline, 2004, 2006 and 2008
Variable 2004 Std Err 2006 Std Err 2008 Std Err
Democratic Candidate Choice 0.21 .157 0.30 .124 0.32 .127 Country Heading in Positive
Direction 0.11 .113 -0.12 .108 0.02 .135 Democratic ID 0.17 .129 -0.22 .125 0.02 .130 Campaign Contact 0.76 .115 0.35 .132 0.21 .126 Age -0.04 .004 -0.03 .003 0.00 .003 Education Level 0.75 .061 0.72 .058 0.06 .052 Married -0.25 .115 -0.09 .109 -0.38 .102 Employed 0.21 .112 0.06 .104 -0.05 .110 Female -0.05 .106 -0.28 .099 -0.18 .100 Income 0.19 .032 0.17 .030 0.03 .018 Nonwhite -0.39 .141 -0.23 .136 0.05 .139 Missing Age -2.76 .418 … … … …
Missing Education Level 1.78 .803 … … 0.45 .486 Missing Income 0.55 .209 0.56 .201 0.77 .284 Constant -1.95 .269 -2.48 .258 0.58 .256
N 2197 2545 2254
Pseudo R2 0.22 0.16 0.02
Values in bold indicate coefficients that are statistically significant at the 95% level. The dependent variable is an indicator for whether the respondent acquires political news online.
21
Table 8: Logistic Regression Coefficients for Using E-Government, 2004, 2006 and 2008
Variable 2004 Std Err 2006 Std Err 2008 Std Err
Democratic Candidate Choice 0.21 .156 0.22 .120 0.25 .126 Country Heading in Positive
Direction -0.15 .115 -0.17 .105 -0.26 .136 Democratic ID -0.10 .129 -0.11 .121 -0.12 .130 Campaign Contact 0.60 .115 0.76 .135 -0.02 .126 Age -0.02 .003 -0.02 .003 -0.03 .003 Education Level 0.67 .060 0.56 .055 0.72 .055 Married -0.16 .114 0.24 .104 0.20 .105 Employed 0.27 .113 0.35 .102 0.57 .104 Female 0.06 .105 0.08 .096 -0.14 .100 Income 0.21 .032 0.16 .029 0.04 .019 Nonwhite -0.23 .142 -0.14 .132 -0.54 .138 Missing Age -1.32 .409 … … … …
Missing Education Level 0.81 1.06 1.17 .795 2.04 .478 Missing Income 0.41 .215 0.38 .200 0.38 .256 Constant -2.82 .281 -3.32 .265 -1.16 .252
N 2197 2562 2254
Pseudo R2 0.18 0.14 0.18
Values in bold indicate coefficients that are statistically significant at the 95% level. The dependent variable is an indicator for whether the respondent reports accessing e-government resources.
22
Table 9: Logistic Regression Coefficients for Sending Political Emails, 2004, 2006 and 2008
Variable 2004 Std Err 2006 Std Err 2008 Std Err
Democratic Candidate Choice 0.49 .158 0.30 .164 0.20 .121 Country Heading in Positive
Direction -0.30 .119 -0.11 .151 0.27 .133 Democratic ID -0.01 .132 0.04 .168 0.08 .125 Campaign Contact 0.75 .120 0.66 .217 0.37 .121 Age -0.03 .004 -0.01 .004 0.02 .003 Education Level 0.72 .063 0.72 .089 -0.07 .051 Married -0.27 .117 0.05 .151 -0.38 .101 Employed 0.22 .116 -0.11 .146 -0.39 .103 Female 0.12 .109 -0.04 .136 0.04 .096 Income 0.18 .033 0.18 .043 0.01 .018 Nonwhite -0.65 .150 -0.21 .198 0.19 .133 Missing Age -1.82 .443 … … … …
Missing Education Level 1.21 1.07 … … -0.61 .426 Missing Income 0.48 .221 0.27 .324 0.13 .241 Constant -2.78 .221 -5.23 .428 0.22 .245
N 2197 2545 2254
Pseudo R2 0.19 0.12 0.04
Values in bold indicate coefficients that are statistically significant at the 95% level. The dependent variable is an indicator for whether the respondent reports sending political emails.
23
Table 10: Implications of Online Participation, 2004, 2006 and 2008
Variable
(Std Err) Voted 2004 Voted 2006 Voted 2008 Donations Political 2004 Political Donations 2008 Went online to confirm views (.234) 1.17 (.192) 1.00 (.233) 1.30 … … Uses Internet … … … 1.00 (.130) (.714) 3.54 Constant 1.25 (.054) (.043) 0.69 (.062) 1.59 (.112) -2.19 (.708) -5.83 N 2197 2562 2254 2197 2254 Pseudo R2 0.01 .01 0.02 0.03 0.08
24 Bibliography
Altman, M., & Klass, G. (2005). Current Research in Voting, Elections, and Technology. Social Science Computer Review , 23, 3: 269-273.
Ambinder, M. (2008, June). HisSpace. The Atlantic , pp. http://www.theatlantic.com/doc/200806/ambinder-obama.
Anderson, D. M., & Cornfield, M. (2003). The Civic Web: Online Politics. Ranham, Maryland: Rowman and Littlefield.
Best, Samuel J. and Brian S. Krueger. 2005. Analyzing the Representativeness of Internet Political Participation. Political Behavior. 27, 2: 183-216.
Bimber, B. (2003). Information and American Democracy: Technology in the Evolution of Political Power. NY: Cambridge University Press.
Bimber, B., & Davis, R. (2003). Campaigning Online: The Internet in U.S. NY: Oxford University Press.
Browning, G. (1996). Electronic Democracy: Using the Internet to Influence American Politics. . Wilton, CT: Pemberton Press.
Chadwick, A. (2006). Internet Politics: States, Citizens, and New Communication Technologies. NY: Oxford University Press.
Cornfield, M. (. (2004). Politics Moves Online: Campaigning and the Internet. NY: The Century Foundation.
Foot, K., & Schneider, S. (2006). Web Campaigning. Cambridge, Massachusetts: MIT Press.
Frantzich, S. (2003). Cyberage Politics 101: Mobility, Technology, and Democracy. NY: Peter Lang Publishing.
Graff, G. (2007). The First Campaign: Globalization, the Web, and the Race for the White House. New York: Farrar, Straus, and Giroux.
Hara, N., & Estrada, Z. (2005). Analyzing the Mobilization of Grassroot Activities via the Internet: A Case Study. Journal of Information Science , 31, 1: 503-514.
Hirschorn, M. (2008, May). Only Connect. The Atlantic .
Karmarck, E., & Nye, J. (2002). Governance.com: Democracy in the Information Age. Washington, D.C.: Brookings Institution Press.
Kenski, Kate and Natalie Jomini Stroud. 2006. “Connections Between Internet Use and Political Efficacy, Knowledge, and Participation.” Journal of Broadcasting & Electronic Media. 50, 2: 173 - 192.
25
Kimball, David C. and Cassie A. Gross. 2006. "The Growing Polarization of American Voters." in The State of the Parties: The Changing Role of Contemporary American Parties Fifth Edition. Eds. John C. Green and Daniel J. Coffey. Lanham, MD: Rowman & Littlefield.
Klotz, R. (2004). The Politics of Internet Communication. Lanham, Maryland: Rowman and Littlefield Publishers, Inc.
Klotz, R. (2007). Internet Campaigning for Grassroots and Astroturf Support. Social Science Computer Review , 25, 1: 3-11.
Krueger, Brian S. 2002. "Assessing the Potential of Internet Political Participation in the United States: A Resource Approach." American Politics Research. 30, 5: 476-498.
Mossberger, K., Tolbert, C., & McNeal, R. 2008. Digital Citizenship: The Internet, Society, and Participation. Cambridge, MA: MIT Press.
Mossberger, Karen, Caroline Tolbert, and Mary Stansbury. 2003. Virtual Inequality: Beyond the Digital Divide. Washington, D.C.: Georgetown University Press.
Mutz, Diana C. (2006) Hearing the Other Side. Cambridge University Press.
Norris. Pippa. 2001. Digital Divide: Civic Engagement, Information Poverty, and the Internet Worldwide. Cambridge: Cambridge University Press.
Park, H., & Perry, J. (2008). Do Campaign Websites Really Matter in Electoral Civic Engagement?: Empirical Evidence from the 2004 Post-Election Internet Tracking Survey. Social Science
Computer Review. , 26, 2: 190-212.
Rainie, Lee and Aaron Smith. 2008. The Internet and the 2008 Election. Pew internet & American Life Project. Jun 15. http://www.pewinternet.org/Reports/2008/The-Internet-and-the-2008-Election.aspx.
Rainie, Lee, John Horrigan, and Michael Cornfield. 2005. The Internet and Campaign 2004. Pew internet & American Life Project. Mar 6. http://www.pewinternet.org/Reports/2005/The-Internet-and-Campaign-2004.aspx
Shane, P. (2004). Democracy Online: The Prospects for Political Renewal Through the Internet. New York: Rutledge Press.
Smith, Aaron, Kay Lehman Schlozman, Sidney Verba, and Henry Brady. 2009. The Internet and Civic Engagement. Pew internet & American Life Project. Sep 1.
http://www.pewinternet.org/Reports/2009/15--The-Internet-and-Civic-Engagement.aspx Smith, Aaron. 2009. The Internet's Role in Campaign 2008. Pew internet & American Life Project. Apr 15. http://www.pewinternet.org/Reports/2009/6--The-Internets-Role-in-Campaign-2008.aspx
Tolbert, Caroline J. and Ramona S. McNeal. 2003. “Unraveling the Effects of the Internet on Political Participation?” Political Research Quarterly. 56, 2: 175-185.
26
Trent, JS and RV Friedenberg. 2007. Political Campaign Communication: Principles and Practices. Lanham, MD: Rowman & Littlefield.
Wagner, K. M. & Gainous, J. 2009. "Electronic Grassroots: Does Online Campaigning Work?" The Journal of Legislative Studies, 15, 4: 502-520.
Williams, A., & Trammell, K. (2005). Candidate Campaign E-Mail Messages in the Presidential Election . American Behavioral Scientist. , 49, 4: 560-574. .
27 Appendix: Survey Questions
Use the Internet:
(1) Please tell me if you ever use your cell phone to do any of the following things. Do you ever use it to access the Internet? (Q4b, 2008)
(2) Do you use the Internet, at least occasionally? (Q6a, 2006; Q6a, 2008)
(3) Do you ever go online to access the Internet or World Wide Web or to send and receive email? (Q6, 2004)
News Online:
(1) Again, thinking about YESTERDAY, did you read a news story from a newspaper in any of the following ways: Online on a computer? (Q12b, 2008)
(2) Again, thinking about YESTERDAY, did you watch the news online on a computer? (Q14b, 2008)
(3) Please tell me if you ever use the internet to do any of the following things. Do you ever use the internet to…Get news online (WebA, 2006; Web1, 2008)
(3) Please tell me if you do any of the following when you go online. Do you ever get news online? Did you happen to do this yesterday, or not? (Responses: Have ever done this, Did yesterday, Have not done this, Don’t know/Refused) (Web1, 2004)
Politics Online:
(1) Did you ever go online to get news or information about the 2008 elections? (Q17, 2008) (2) Please tell me if you ever use the internet to do any of the following things. Do you ever use
the internet to…Look online for news or information about politics or the 2008 campaigns (Web1, 2008)
(3) How have you been getting most of your news about the November elections… from television, from newspapers, from radio, from magazines, or from the Internet? (Q15, 2008; Q19, 2006)
(4) How have you been getting most of your news about the presidential election campaign? From television, from newspapers, from radio, from magazines, or from the Internet? (Q17, 2004)
(5) Do you ever go online to get news or information about the 2004 elections? How often do you go online to get news about the elections…more than once a day, every day, three-to-five days per week, one-to-two days per week, or less often? (Q19, 2004)
(6) Please tell me if you do any of the following when you go online. Do you ever look for news or information about politics and the campaign? Did you happen to do this yesterday, or not? (Responses: Have ever done this, Did yesterday, Have not done this, Don’t
know/Refused) (Web 1, 2004) Access E-Government:
(1) Please tell me if you ever use the internet to do any of the following things. Do you ever use the internet to…Visit a local, state or federal government website (WebA, 2006; Web1, 2008)
28
(2) Please tell me if you do any of the following when you go online. Do you ever look for information from a local, state, or federal government website? Did you happen to do this yesterday, or not? (Responses: Have ever done this, Did yesterday, Have not done this, Don’t know/Refused) (Web 1, 2004)
Send/Receive Political Email:
(1) Did you communicate with others about politics, the campaign or the 2008 elections using the internet, whether by email, text messaging, instant messaging or using a Social Networking site? (Q18, 2008)
(2) Thinking about this year’s presidential election, people have been communicating with each other and with the political campaigns in many ways, to talk about issues or where the campaign stands. What about you? Over the past several months, how often did you… Send or receive EMAIL to or from friends, family members or others about the campaign (Q19, 2008)
(3) Did you send or receive emails about the candidates or the campaigns, either with personal acquaintances or political organizations, or did you not happen to do this? (Q26, 2006)
(4) Have you sent or received e-mails about the candidates or campaigns, either with personal acquaintances or from groups or political organizations? (Q20, 2004) (5) Have you sent emails about the 2004 campaign to groups of family or friends who
are part of an email list or online discussion group? (Q22, 2004)
(6) During this year’s election campaigns, have you sent emails urging people to get out and vote without reference to a particular candidate? Sent emails urging people to vote for a particular candidate? (Q27, 2004)
(7) When you went online to get information about the elections, did you ever get or send email with jokes about the campaigns and elections? (Q37, 2004)
Make Political Donations:
(1) During this year’s election campaign, have you given money to a political candidate? (Q27, 2004)
(2) When you went online to get information about the elections, did you ever contribute money online to a candidate running for public office? (Q37, 2004)
(3) There are many different campaign-related activities a person might do on the internet. I’m going to read a list of things you may or may not have done online in the months leading up to the November elections. Just tell me if you happened to do each one, or not. Did you contribute money online to a candidate running for public office? (Q26, 2006; Q25, 2008) Was Contacted by Campaign (Other Than Email):
(1) In the past two months, have you received mail urging you to vote for a particular presidential candidate? Received telephone calls urging you to vote for a particular
presidential candidate? Been visited at home by someone urging you to vote for a particular presidential candidate? (Q23, 2004)
29
(2) In the past two months, have you received mail urging you to vote for a particular candidate? Been visited at home by someone urging you to vote for a particular candidate? Received prerecorded telephone calls urging you to vote for a particular candidate? Received a phone call from a live person urging you to vote for a particular candidate? (Q2, 2006)
(3) Thinking about this year’s presidential election, people have been communicating with each other and with the political campaigns in many ways, to talk about issues or where the campaign stands. What about you? Over the past several months, how often did you…receive mail from a candidate or political party? Receive text messages from a candidate or political party? (Q19, 2008)
(4)
Voted for the Democratic Candidate:
(1) In the presidential election, did you vote for the Democratic ticket of Barack Obama and Joe Biden or the Republican ticket of John McCain and Sarah Palin? (Vot03, 2008)
(2) In the election on November 7, did you vote for the Republican candidate or the Democratic candidate for Congress in your district? (Vot03, 2006)
(3) In the election on November 2, did you vote for the Republican ticket of George Bush and Dick Cheney, the Democratic ticket of John Kerry and John Edwards, the ticket of Ralph Nader and Peter Camejo, or someone else? (Vote 03b, 2004) Direction of country:
(1) Overall, are you satisfied or dissatisfied with the way things are going in this country today? (Responses: Satisfied, Dissatisfied, (Not Read) Don’t know/Refused). (Q1, 2004; Q1, 2006; Q1, 2008)
Why online:
(1) When you go online looking for political or campaign information, would you say most of the sites you go to share your point of view, don’t have a particular point of view, or challenge your own point of view? (Q41, 2004; Q35, 2006; Q23, 2008)
Voted:
(1) A lot of people have been telling us they didn’t get a chance to vote in the elections this year on November 4. How about you…did things come up that kept you from voting, or did you happen to vote? (Vote, 2008)
(2) A lot of people have been telling us they didn’t get a chance to vote in the congressional elections this year on November 7. How about you…did things come up that kept you from voting, or did you happen to vote? (Vot02, 2006)
(3) A lot of people have been telling us they didn’t get a chance to vote in the elections this year on November 2. How about you…did things come up that kept you from voting, or did you happen to vote? (Vot02, 2004)