Carbon Emissions Analysis of Rail Resurfacing Work: A Case
Study, Practical Guideline, and Systems Thinking Approach
The MIT Faculty has made this article openly available. Please share how this access benefits you. Your story matters.
Citation Krezo, S., O. Mirza, Y. He, S. Kaewunruen, and J.M. Sussman.
"Carbon Emissions Analysis of Rail Resurfacing Work: A Case Study, Practical Guideline and Systems Thinking Approach." Proceedings of the Second International Conference on Railway Technology: Research, Development and Maintenance, April 8-11, 2014, Ajaccio, Corsica, France, Civil-Comp Press, 2014.
As Published http://dx.doi.org/10.4203/ccp.104.288
Publisher Civil-Comp Press
Version Author's final manuscript
Citable link http://hdl.handle.net/1721.1/84951
Terms of Use Creative Commons Attribution-Noncommercial-Share Alike 3.0
Carbon Emissions Analysis of Rail Resurfacing Work: A
Case Study, Practical Guideline, and Systems Thinking
Approach
S. Krezo¹, O. Mirza¹, Y. He¹, S. Kaewunruen
2,3, J.M. Sussman
3¹ School of Computing, Engineering and Mathematics, University of Western Sydney, Kingswood, Penrith 2751, New South Wales, Australia.
² RailCorp - Transport for NSW, Level 13, 477 Pitt St, Sydney 2000 New South Wales, Australia
3
Department of Civil and Environmental Engineering, Massachusetts Institute of Technology, 77 Massachusetts Ave, Cambridge, MA 02139-4307 USA.
Abstract
Carbon pollution has become a sensitive topic across the globe in recent times. In Australia, incentive has been provided to industry in order to reduce carbon emissions in heavy polluting industries. The railway transportation system is one of the industries expected to reduce the emissions and contribute to a long term reduction strategy, although comparatively rail sector contributes much less carbon unit compared with other modes of transportation. Railway operations provide fast and safe transport of passengers and cargo whilst providing alternative transport modes to road and aviation. Railway maintenance is the process of restoring railway track to an appropriate condition which improves ride comfort and safety through its life cycle. The railway maintenance practices need to be cost effective, with longevity of railway infrastructure a key long term consideration. Railway maintenance activities included tamping, rail grinding and track renewals. In order to understand the contribution railway maintenance machinery has on overall greenhouse gas emissions, this study presents a method for estimating emissions from rail resurfacing practices. A study was conducted to survey diesel engines used in various resurfacing machineries. Emissions are estimated using a fuel consumption and operating time analysis. The contribution machineries has on greenhouse gas emissions and other air pollutants include CO₂, CO, NO3, SO₂,
PM₁₀, TVOC and Polycyclic Aromatic Hydrocarbons. The results were compared to the National Greenhouse and Accounts Factors and the Australian National Pollution inventory databases, to verify the accuracy of the estimations.
Keywords: railway, railway maintenance, rail resurfacing, greenhouse gas
1 Introduction
Carbon pollution is a human occurrence which had seen increased environmental incidence over the past century. Environmental incidence had included rising sea levels, the greenhouse effect, increased in global temperatures and increased level of species extinction [1]. Demand from fossil fuel energy production, increased use of carbon intensive fuels and outdated vehicle technology had seen carbon emissions rise steadily in established and developing nations [2].
Carbon emissions, which were responsible for causing harm to human health, include carbon dioxide, carbon monoxide, oxides of nitrogen, hydrofluerocarbons and methane [3]. Rao [4] explained that carbon emissions from the transportation sector globally have consistently been increasing. The author claimed that the transportation sector was responsible for 13 % of total emissions in 2010 across the globe, predominately due to increased ridership of single car journeys. Railway transportation in Australia is used to transport passengers and freight to various locations across Australia. Passenger train services utilised electrified power and freight services were powered by diesel locomotives.
Railway maintenance is used to prolong the life of the rail infrastructure [5]. With each passing movement of trains along a ballasted railway track, the track bed is exposed to live loads which deteriorate the condition of the infrastructure [6]. Von Rozycki et al. [7] found that track bed constructions did not contribute to excessive emissions in overall railway emissions, nor did selection of track bed, as slab track emitted the same emissions as ballast track when the 60 year life expectancy of slab track was considered and less maintenance requirements were required.
Railway resurfacing is performed in Australia to restore ballasted railway track to acceptable conditions. The process of ballast tamping allows for the compaction of ballast material and improves ride comfort and safety. Tamping is used to remove the voids, which are caused by excessive train movements and restores track alignment and ballast compaction of the infrastructure [5]. Rail transportation has the capacity to emit fewer emissions than other transport modes due to increased passengers and freight carried per journey when compared to other transport modes. Railway maintenance is an important factor in the longevity of railway infrastructure. Zhang et al. [5] explained that railway track will not suddenly deteriorate to an unacceptable condition, but will gradually deteriorate to an unacceptable condition, thus maintenance is performed to keep railway systems and components to acceptable conditions.
The construction of new rail infrastructure in Australia was expected to boom over the next two decades with rail transportation being a key growth area targeted by the Australian government transportation sector growth.
2 Methodology
2.1 Rail resurfacing machinery
Metropolitan railway services in the Australian state of New South Wales (NSW) are provided by Transport for NSW and operated by Sydney Trains. Sydney Trains is the infrastructure manager, which owns and operates the rail infrastructure in the metropolitan region in NSW. It is the responsibility of the rail maintainer to ensure the network operates effectively and to ensure periodic checks and maintenance and performed.
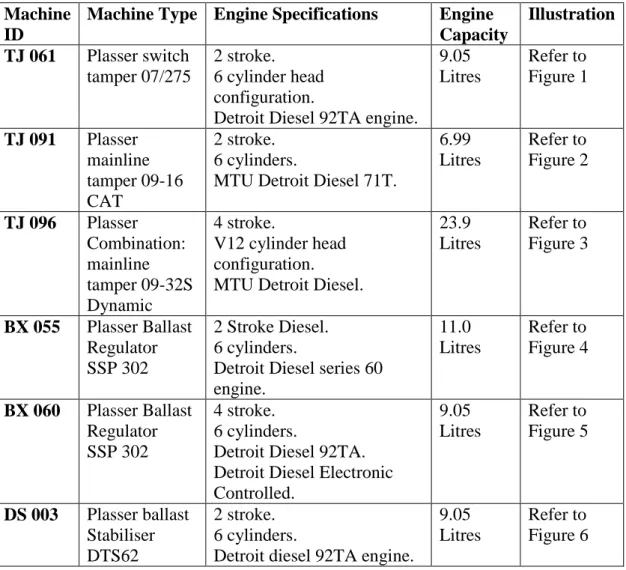
This study will focus on an evidence-based estimation of the emissions from the resurfacing fleet currently used in NSW, Australia. The machineries to be tested include tampers, regulators and stabilisers which are shown in table 1.
Table 1. Rail resurfacing machineries to have carbon emissions estimated.
Machine ID
Machine Type Engine Specifications Engine Capacity Illustration TJ 061 Plasser switch tamper 07/275 2 stroke. 6 cylinder head configuration.
Detroit Diesel 92TA engine.
9.05 Litres Refer to Figure 1 TJ 091 Plasser mainline tamper 09-16 CAT 2 stroke. 6 cylinders.
MTU Detroit Diesel 71T.
6.99 Litres Refer to Figure 2 TJ 096 Plasser Combination: mainline tamper 09-32S Dynamic 4 stroke. V12 cylinder head configuration. MTU Detroit Diesel.
23.9 Litres Refer to Figure 3 BX 055 Plasser Ballast Regulator SSP 302 2 Stroke Diesel. 6 cylinders.
Detroit Diesel series 60 engine. 11.0 Litres Refer to Figure 4 BX 060 Plasser Ballast Regulator SSP 302 4 stroke. 6 cylinders.
Detroit Diesel 92TA. Detroit Diesel Electronic Controlled. 9.05 Litres Refer to Figure 5 DS 003 Plasser ballast Stabiliser DTS62 2 stroke. 6 cylinders.
Detroit diesel 92TA engine.
9.05 Litres
Refer to Figure 6
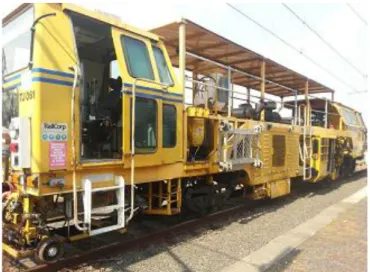
Figure 1. Ballast tamper TJ 061
Figure 2: Ballast tamper TJ091
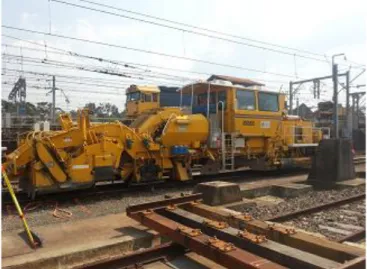
Figure 4. Ballast regulator BX 055
Figure 5. Ballast regulator BX 060
2.2 Carbon Emissions from Rail Resurfacing Machineries
2.2.1 Carbon emissions from rail resurfacing fleet
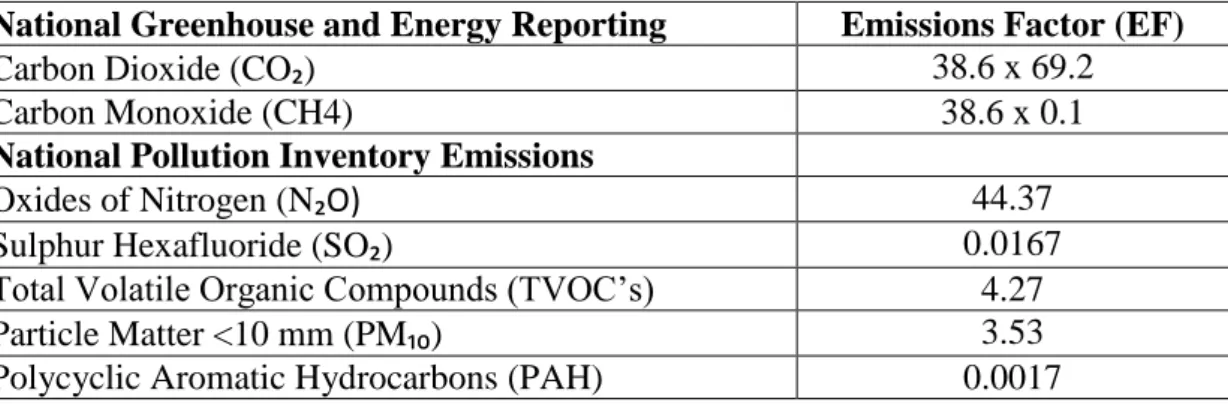
In Australia, industries emitting greenhouse gas emissions have been emitted are required to report on associated greenhouse gas emissions to the ‘National Greenhouse and Energy Reporting’ (NGER) [8] register. Non-greenhouse gas emissions are reported to the ‘National Pollution Inventory’ (NPi) [9]. Table 1 highlights the emissions covered in this study and the emissions factor as set by [8] and [9] organisations.
The emissions factor used were set from the NGER [8] and the NPi [9]. The Australian Government set out to make organisations report the amount of emissions from their activities in high polluting industries. The NGER [8] document covers emissions from a range of material, fuels and activities. The document is focused on capturing data which emit greenhouse gases. The NPi [9] document is focused on emissions which are not greenhouse gases, but are still considered harmful emissions.
Table 2. Emissions reported to the national greenhouse and energy reporting and the national pollutions inventory. Courtesy NGER (2013) [8] and NPi (2008) [9].
National Greenhouse and Energy Reporting Emissions Factor (EF)
Carbon Dioxide (CO₂) 38.6 x 69.2
Carbon Monoxide (CH4) 38.6 x 0.1
National Pollution Inventory Emissions
Oxides of Nitrogen (N₂O) 44.37
Sulphur Hexafluoride (SO₂) 0.0167
Total Volatile Organic Compounds (TVOC’s) 4.27
Particle Matter <10 mm (PM₁₀) 3.53
Polycyclic Aromatic Hydrocarbons (PAH) 0.0017
2.2.2 Estimating emissions from diesel machineries
According to NPi [9], emissions from each diesel machinery are calculated by;
DVE = EF x FU (1)
Where;
DVE = diesel vehicle emissions measured in kg per hour. EF = emissions factor (kg / m³).
The estimation of fuel is given in Equation 2;
FU =
(2)
Where;
= Is the maximum output of the selected resurfacing machine (kW). = Is the diesel engine efficiency.
ΔH = Is the heat of combustion of the diesel fuel. = Density of diesel fuel.
3 Results and Discussion
3.1 Estimating carbon emission from railway resurfacing
machineries
Equation 2 was used to estimate the fuel consumption rate of diesel engines. An engine efficiency of 33 % has been used with consideration of the resurfacing machines age, degree of skill of the operator and wear and tear of machine components varying in the 6 selected machineries. The average chemical formula for common diesel C₁₂H₂₃ has been obtained from [10] and [11]; whilst the specific net heat of combustion of 45.575 KJ/g was used from [12]. Density of diesel fuel is assumed to be 0.850 kg / l as in Australia, the standard density of diesel fuel is to be between 0.820 and 0.860 kg / l.
The rail resurfacing machines operate in three modes; idle, travel and work modes. When the resurfacing machineries are operating in idle mode (600 revolutions per minute (rpm)), there is not sufficient load applied to the motor and thus emissions from idle cannot be estimated. The other two modes of operation, travel and work, apply load to the engine and thus emissions from these modes can be estimated. When the resurfacing machines are in travel mode, the diesel engine is loaded to 2250 rpm. Thus, to estimate emissions from travel mode, 2250 rpm is used for all calculations. Engine load when in work mode in the resurfacing machineries varies depending on the engine capacity of the machinery. The TJ 073 tamper, TJ 091 tamper, TJ 096 tamper and the DS 003 stabiliser operate under reduced capacity when operating in work mode. The tamping and stabilising machinery as specified by the manufacturer (Plasser ®) requires work operations at speeds of 35 Hz, which is lower than in travel mode, thus machineries need to operate at 1600 rpm.
The results of the rail resurfacing machineries emissions are detailed in Tables 3 to 8.
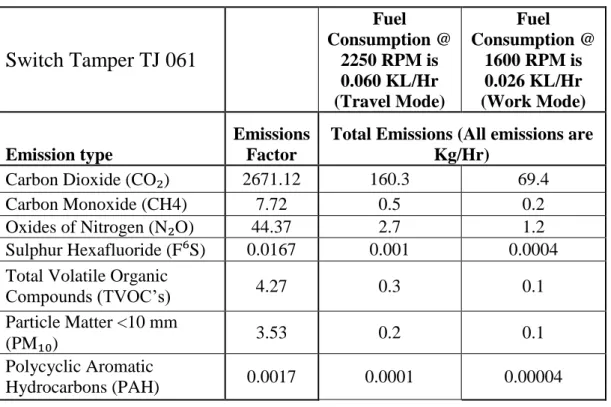
Table 3. Emissions estimates of switch tamper TJ 061
Switch Tamper TJ 061
Fuel Consumption @ 2250 RPM is 0.060 KL/Hr (Travel Mode) Fuel Consumption @ 1600 RPM is 0.026 KL/Hr (Work Mode) Emission type Emissions FactorTotal Emissions (All emissions are Kg/Hr)
Carbon Dioxide (CO₂) 2671.12 160.3 69.4
Carbon Monoxide (CH4) 7.72 0.5 0.2
Oxides of Nitrogen (N₂O) 44.37 2.7 1.2
Sulphur Hexafluoride (F⁶S) 0.0167 0.001 0.0004 Total Volatile Organic
Compounds (TVOC’s) 4.27 0.3 0.1
Particle Matter <10 mm
(PM₁₀) 3.53 0.2 0.1
Polycyclic Aromatic
Hydrocarbons (PAH) 0.0017 0.0001 0.00004 Table 4. Emissions estimates for line tamper TJ 091
Line Tamper TJ 091
FuelConsumption @ 2250 RPM is 0.043 KL/Hr (Travel Mode) Fuel Consumption @ 1600 RPM is 0.021 KL/Hr (Work Mode) Emission type Emissions
Factor
Total Emissions (All emissions are Kg/Hr)
Carbon Dioxide (CO₂) 2671.12 114.9 56.1
Carbon Monoxide (CH4) 7.72 0.3 0.2
Oxides of Nitrogen (N₂O) 44.37 1.9 0.9
Sulphur Hexafluoride (F⁶S) 0.0167 0.001 0.0004 Total Volatile Organic
Compounds (TVOC’s) 4.27 0.2 0.1 Particle Matter <10 mm (PM₁₀) 3.53 0.2 0.1 Polycyclic Aromatic Hydrocarbons (PAH) 0.0017 0.0001 0.00004
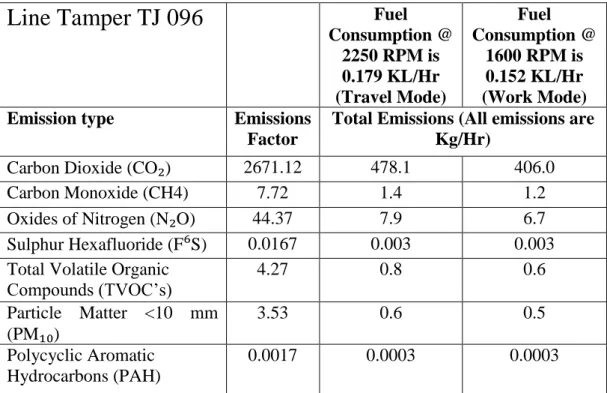
Table 5. Emissions estimates for line tamper TJ 096
Line Tamper TJ 096
FuelConsumption @ 2250 RPM is 0.179 KL/Hr (Travel Mode) Fuel Consumption @ 1600 RPM is 0.152 KL/Hr (Work Mode) Emission type Emissions
Factor
Total Emissions (All emissions are Kg/Hr)
Carbon Dioxide (CO₂) 2671.12 478.1 406.0
Carbon Monoxide (CH4) 7.72 1.4 1.2
Oxides of Nitrogen (N₂O) 44.37 7.9 6.7
Sulphur Hexafluoride (F⁶S) 0.0167 0.003 0.003 Total Volatile Organic
Compounds (TVOC’s) 4.27 0.8 0.6 Particle Matter <10 mm (PM₁₀) 3.53 0.6 0.5 Polycyclic Aromatic Hydrocarbons (PAH) 0.0017 0.0003 0.0003
Table 6. Emissions estimates for ballast regulator BX 055
Ballast Regulator
BX 055
Fuel Consumption @ 2250 RPM is 0.068 KL/Hr (Travel Mode) Fuel Consumption @ 1600 RPM is 0.059 KL/Hr (Work Mode) Emission type EmissionsFactor
Total Emissions (All emissions are Kg/Hr)
Carbon Dioxide (CO₂) 2671.12 181.6 157.6
Carbon Monoxide (CH4) 7.72 0.5 0.5
Oxides of Nitrogen (N₂O) 44.37 3.0 2.6
Sulphur Hexafluoride (F⁶S) 0.0167 0.001 0.001 Total Volatile Organic
Compounds (TVOC’s) 4.27 0.3 0.3 Particle Matter <10 mm (PM₁₀) 3.53 002 0.2 Polycyclic Aromatic Hydrocarbons (PAH) 0.0017 0.0001 0.0001
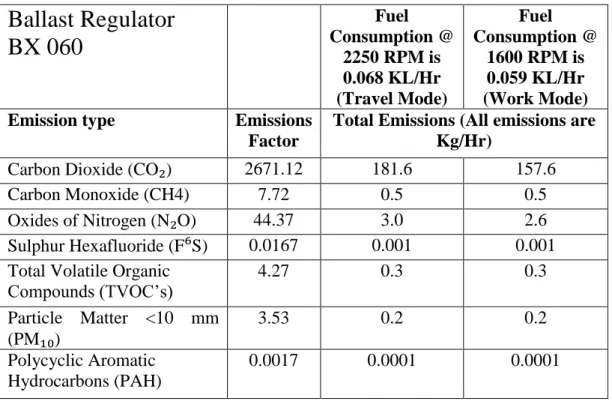
Table 7. Emissions estimates for ballast regulator BX 060
Ballast Regulator
BX 060
Fuel Consumption @ 2250 RPM is 0.068 KL/Hr (Travel Mode) Fuel Consumption @ 1600 RPM is 0.059 KL/Hr (Work Mode) Emission type EmissionsFactor
Total Emissions (All emissions are Kg/Hr)
Carbon Dioxide (CO₂) 2671.12 181.6 157.6
Carbon Monoxide (CH4) 7.72 0.5 0.5
Oxides of Nitrogen (N₂O) 44.37 3.0 2.6
Sulphur Hexafluoride (F⁶S) 0.0167 0.001 0.001 Total Volatile Organic
Compounds (TVOC’s) 4.27 0.3 0.3 Particle Matter <10 mm (PM₁₀) 3.53 0.2 0.2 Polycyclic Aromatic Hydrocarbons (PAH) 0.0017 0.0001 0.0001
Table 8. Emissions estimates for rail stabiliser DS 003
Ballast Stabiliser
DS 003
Fuel Consumption @ 2250 RPM is 0.060 KL/Hr (Travel Mode) Fuel Consumption @ 1600 RPM is 0.026 KL/Hr (Work Mode) Emission type EmissionsFactor
Total Emissions (All emissions are Kg/Hr)
Carbon Dioxide (CO₂) 2671.12 160.3 69.4
Carbon Monoxide (CH4) 7.72 0.5 0.2
Oxides of Nitrogen (N₂O) 44.37 1.2 1.2
Sulphur Hexafluoride (F⁶S) 0.0167 0.001 0.0004 Total Volatile Organic
Compounds (TVOC’s) 4.27 0.3 0.1 Particle Matter <10 mm (PM₁₀) 3.53 0.2 0.1 Polycyclic Aromatic Hydrocarbons (PAH) 0.0017 0.0001 0.00004
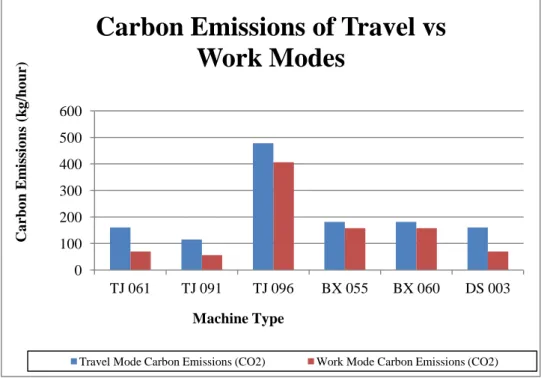
The emissions from rail resurfacing machines used in the resurfacing fleet show that carbon emissions is the highest emitting pollutant from the categories investigated. Figure 7 illustrates the comparison of carbon emissions between travel and work modes for the machineries surveyed.
Figure 7. Comparison of carbon emissions from rail resurfacing machineries. The results show that the emissions are dependent on the size of the machines engine. The graph shows that the larger engine capacity engines emit the highest amounts of carbon emissions, thus the amount of emissions are directly related to the size and capacity of the engine, with larger and more powerful engines emitting higher levels of emissions.
3.2 Comparison of rail resurfacing emissions estimates compared
to other studies
A study conducted by Kiani et al. 2008 [13] investigated life cycle assessments of various track bed constructions. The comprehensive study covered all facets of rail construction including maintenance. This study assumed the rail resurfacing requirements for the maintenance of the ballasted track system, thus providing a doubt as to the correctness of the data.
Chang and Kendall 2011 [14] and Chester and Horvath 2010 [15] investigated greenhouse gas emissions of infrastructure and life-cycle assessment of high speed
0 100 200 300 400 500 600 TJ 061 TJ 091 TJ 096 BX 055 BX 060 DS 003 Ca rbo n E m is sio n s (k g /ho ur) Machine Type
Carbon Emissions of Travel vs
Work Modes
rail in the United States of America respectively. The studies did not investigate the on-going emissions involved with rail maintenance, including rail resurfacing. Milford and Allwood 2010 [16] conducted a study into the CO₂ impact of current and future rail projects in the United Kingdom. The authors calculated emissions from rail resurfacing practices indirectly and used assumptions to form this part of the study. Moreover, the research suggested that due to the uncertainty in the rail maintenance assumptions, further work was required to complete this study.
4 Conclusion
This study presented an estimate of the expected emissions from a variety of railway resurfacing machineries. The machineries examined were of different size and characteristics. This provides planners and engineers a range of emissions estimates to be used for forecasting life-cycle maintenance emissions as fuel consumption over operating time analysis.
The results provide the railway industry a practical case study with reasonably accurate estimates from rail resurfacing practices. These results are estimated on a kg / hour basis and can be used in future rail construction life cycle assessments and for feasibility studies for planned rail construction projects. The results can be used by planners and designers of new rail infrastructures to ensure reasonably accurate life-cycle maintenance estimates are used when planning and maintaining new rail construction infrastructure.
5 Systems thinking approach and future work
Questions concerned with carbon emissions are often best understood in the context of complex sociotechnical systems. While the railways should strive to minimise their carbon emissions due to rail resurfacing work – and we hope this paper advances that cause – but it is important that we draw the system boundary more widely. In fact, the sustainability associated with rail freight and passenger movements has been demonstrated, a movement compared with highway – and air-oriented transportation systems. So while the industry has a responsibility to minimise its carbon emissions from a systems point of view the overall sustainability of the rail mode should be taken into account in any analyses that are performed on a more global scale. Research at Massachusetts Institute of Technology (MIT) dealing with high-speed rail transportation in the US and especially in the Northeast Corridor of the United States demonstrates the importance of taking the broad view [17-18].
To improve this research, a field survey will be conducted to measure the fuel consumption of a railway resurfacing fleet. The field survey is important in verify
the results of this study whilst reducing the uncertainties involved in estimating lifecycle emissions from railway maintenance practices.
6 Acknowledgements
I would like to thank Railcorp, in particular the Asset Operations Group for their guidance, assistance and patience for the term of this study. I would like to thank Mr. Dennis Douset for his knowledge, time and advice with regard to MTU Detroit Diesel engines and appreciate all his hard work, time and effort.
7 References
[1] G. Marsden and T. Rye, “The governance of transport and climate change”, in “Journal of transport geography”, Volume 18, Elsevier Ltd, 2010.
[2] P. Droenge, “Urban energy transition: An introduction” Elsevier Ltd, 2007. [3] R. Wood and C. Dey, “Australia’s carbon footprint”, in “Economic systems
research”, Volume 21, Issue 3, Routledge Press, 2009.
[4] S. Rao, “Reducing carbon emissions from transport projects”, in “Evaluation knowledge brief”, H. Dalkmann (editor), Volume 1, Cambridge, 2010.
[5] T. Zhang, J. Andrews, R. Wang, “Optimal scheduling of track maintenance on a railway network”, in “Quality and reliability engineering international”, John Wiley & Sons, Ltd, 2013.
[6] J. Farnham, F. Franklin, D. Fletcher, A. Kapoor, C. Davis, “Predicting the life of steel rails”, in “proceedings of the institution of Mechanical Engineers”, Proquest Central, 2007.
[7] C. Von Rozycki, H. Koeser, H. Schwarz, “Ecology profile of the German high-speed rail passenger transport system, ICE”, in “Railway passenger transport”, ecomed publishers, 2003.
[8] National Greenhouse Accounts Factors (NGA) (2013), ‘National greenhouse and energy reporting, Australian Government department of Industry, Innovation, Climate change, Science, Research and Tertiary Education. [9] National Pollution Inventory (NPi) (2008), ‘Exhaust emissions from road
vehicles v3.0.0.
[10] Y. Haseli, G. F. Naterer, I. Dincer, “Comparative assessment of greenhouse gas mitigation of hydrogen passenger trains”, in “International journal of hydrogen energy”, Volume 33, Elsevier Ltd, 2008.
[11] S. P. Singh and D. Singh, “Biodiesel production through the use of different sources and characterization of oils and their esters as the substitute for diesel: A review”, in “Journal of renewable and sustainable energy reviews”, Volume 18, Elsevier Ltd, 2010.
[12] Biomass energy data book, The greenhouse gases, regulated emissions and energy use in transportation model, GREET, 1.8d.1, developed by Argonne
National Laboratory, http//:greet.es.anl.gov/, viewed 1st September 2013, 2011.
[13] M. Kiani, T. Parry and H. Ceney, “Environmental life-cycle assessment of railway track beds” in “Environmental sustainability”, Volume 161, Issue 2, ICE publications, 2008.
[14] B. Chang and A. Kendall, “Life cycle greenhouse gas assessment of infrastructure construction for California’s high-speed rail system”, in “Transprtation research”, Volume 16, Elsevier Ltd, 2011.
[15] M. Chester and A. Horvath, “Life-cycle assessment of high speed rail: the case of California”, in “Environmental research letters”, Volume 5, IOP Publishing, 2010.
[16] R. L. Milford and J. M. Allwood, “Assessing the CO₂ impact of current and future rail track in the UK”, in “Journal of transportation research”, Volume 15, Elsevier Ltd, 2010.
[17] R. Clewlow, “The climate impacts of high-speed rail and air transportation: a global comparative analysis,” PhD Thesis, Massachusetts Institute of Technology, Engineering Systems Division, 2012.
[18] R. Clewlow, J. Sussman and H. Balakrishnan, "Interaction of High-Speed Rail and Aviation: Exploring Air-Rail Connectivity," Transportation Research Record: Journal of the Transportation Research Board, No. 2266, 2012.