HAL Id: hal-01071335
https://hal.archives-ouvertes.fr/hal-01071335
Submitted on 3 Oct 2014
HAL is a multi-disciplinary open access archive for the deposit and dissemination of sci-entific research documents, whether they are
pub-L’archive ouverte pluridisciplinaire HAL, est destinée au dépôt et à la diffusion de documents scientifiques de niveau recherche, publiés ou non,
Anthropogenic perturbations of the silicon cycle at the
global scale: Key role of the land-ocean transition
Goulven G. Laruelle, Vincent Roubeix, Agata Sferratore, B. Brodherr, D.
Ciuffa, D.J. Conley, H. H. Durr, Josette Garnier, Christiane Lancelot, Q. Le
Thi Phuong, et al.
To cite this version:
Goulven G. Laruelle, Vincent Roubeix, Agata Sferratore, B. Brodherr, D. Ciuffa, et al.. Anthropogenic perturbations of the silicon cycle at the global scale: Key role of the land-ocean transition. Global Biogeochemical Cycles, American Geophysical Union, 2009, 23, pp.GB4031. �10.1029/2008GB003267�. �hal-01071335�
Anthropogenic perturbations of the silicon cycle at the global scale: the key role of the 1
land-ocean transition 2
3
G. G. Laruelle1, V. Roubeix2, A. Sferratore3, B. Brodherr4, D. Ciuffa5, D. J. Conley6, H. H. 4
Dürr2,7, J. Garnier3, C. Lancelot2, Q. Le Thi Phuong3, J.-D. Meunier8, M. Meybeck3, P. 5
Michalopoulos9, B. Moriceau10, S. Ní Longphuirt10, S. Loucaides1, L. Papush11, M. Presti9, O. 6
Ragueneau10, P. A. G. Regnier1,12, L. Saccone13, C. P. Slomp1, C. Spiteri1, P. Van Cappellen1 7
8
1 Department of Earth Sciences, Utrecht University, The Netherlands. 9
2 Aquatic Systems Ecology, Université Libre de Bruxelles, Belgium. 10
3
UMR 7619 Sisyphe, Université Pierre et Marie Curie, Paris, France. 11
4
Department of Marine Biology, Baltic Sea Research Institute, Warnemünde, Germany. 12
5
Centre for Research and Monitoring of the Marine Environment, University of Rome Tor 13
Vergata, Italy. 14
6 GeoBiosphere Science Centre, Department of Geology, Lund University, Sweden 15
7 Department of Physical Geography, Utrecht University, The Netherlands. 16
8
CEREGE, CNRS/Université Paul Cezanne, Aix en Provence, France. 17
9
Hellenic Center for Marine Research, Athens, Greece. 18
10
European Institute for Marine Studies, University of Western Brittany, Plouzané, France. 19
11 Department of Water and Environment Studies, Linköping University, Sweden. 20
12 Department of Earth and Environmental Sciences, Université Libre de Bruxelles, Belgium 21
13 National Environmental Research Institute, Denmark 22
23
Corresponding author: G. G. Laruelle, g.laruelle@geo.uu.nl 24
25
FOR SUBMISSION TO 26
Global Biogeochemical Cycles
27 June 2009 28 29 30 31 32
Abstract 1
Silicon (Si), in the form of dissolved silicate (DSi), is a key nutrient in marine and continental 2
ecosystems. DSi is taken up by organisms to produce structural elements (e.g., shells and 3
phytoliths) composed of amorphous biogenic silica (bSiO2). A global mass balance model of 4
the biologically active part of the modern Si cycle is derived based on a systematic review of 5
existing data regarding terrestrial and oceanic production fluxes, reservoir sizes, and residence 6
times for DSi and bSiO2. The model demonstrates the high sensitivity of biogeochemical Si 7
cycling in the coastal zone to anthropogenic pressures, such as river damming and global 8
temperature rise. As a result, further significant changes in the production and recycling of 9
bSiO2 in the coastal zone are to be expected over the course of this century. 10 11 12 13 14 15 16 17 18 19 20 21 22 23 24 25
1. Introduction 1
2
Silicon (Si) is the second most abundant element in the Earth’s crust after oxygen. 3
Most Si, however, is bound in the form of quartz and silicate minerals, and is therefore 4
unavailable for uptake by organisms. Thus, despite its abundance, Si is a major limiting 5
element in many aquatic systems (Conley and Malone, 1992; Egge and Aksnes, 1992; 6
Paasche, 1980; Leynaert et al., 2001), and is also an essential nutrient for the growth of many 7
terrestrial plants (Epstein, 1999; Datnoff et al., 2001). Key aspects of the global 8
biogeochemical silicon cycle remain poorly understood, such as the biological cycling of Si 9
on the continents (Conley, 2002a), the role of the coastal zones in regulating the transfer of 10
reactive Si from land to the open ocean (Conley, 1997; DeMaster, 2002), the fate of biogenic 11
silica produced in oceanic surface waters and its decoupling from carbon during sinking 12
(Nelson et al., 1995; Ragueneau et al., 2002, 2006a), and ongoing changes to the Si cycle by 13
human activities (Chauvaud et al., 2000; Conley et al., 1993; Friedl and Wuest, 2002; Friedl et 14
al., 2004; Humborg et al., 2000, 2006; Ragueneau et al., 2005, 2006b, 2006c, Conley et al., 15
2008). 16
Global scale studies of the biogeochemical Si cycle have focused mainly on the marine 17
aspect. An important landmark in the assessment of Si fluxes in the world ocean is the work 18
of Tréguer et al. (1995). These authors, however, provide no estimates of the amounts of 19
biogenic silica stored in the oceans and underlying sediments. Furthermore, only a crude 20
representation of the land-ocean interface is included in their global Si budget. In this respect, 21
the current state of knowledge and modeling of global carbon, nitrogen, phosphorus and 22
sulfur cycles (Mackenzie et al., 1993, 1998; Ver, 1998; Rabouille et al., 2001) are 23
significantly more advanced than for silicon. 24
In this study, we provide global scale estimates of reservoir sizes and fluxes of reactive 1
Si on the continents in the ocean and at the continent-to-ocean transition. Emphasis is placed 2
on the biogeochemical dynamics of Si at the Earth’s surface, from the recent past to the end of 3
the 21st century. We therefore do not explicitly represent the long-term endogenic Si cycling, 4
but rather include the Earth’s lithosphere as the ultimate source and sink of reactive Si. The 5
two forms of reactive Si considered are dissolved silicate (DSi) and biogenic silica (bSiO2). 6
The main transformation processes in the global biogeochemical Si cycle are uptake of DSi 7
followed by biomineralization as bSiO2 in terrestrial plants and aquatic organisms, and the 8
dissolution of bSiO2 into DSi. 9
The resulting mass balance model is used to explore the sensitivity of the global Si 10
cycle and gain insight into its function. Special attention is paid to the role of the coastal zone 11
and continental shelves on the coupling of terrestrial and oceanic Si dynamics. In addition, the 12
response of the global biogeochemical Si cycle to two anthropogenically-driven forcings is 13
analyzed: global temperature rise and river damming. These forcings are selected because 14
both siliceous production and bSiO2 dissolution are sensitive to temperature (Wollast 1974; 15
Cossins and Bowler, 1987; Rickert, 2000; Van Cappellen et al., 2002), while increased river 16
damming, especially since the 1950’s, has considerably modified the reactive Si delivery to 17
the oceans (Conley, 2002b, Humborg et al., 2006). 18
19
2. Global biogeochemical Si model 20
2.1 Water cycle 21
The Earth’s surface environment is divided into four compartments (Figure 1): 22
continents (box 1), proximal (box 2) and distal (box 3) coastal zones, and the open ocean (box 23
4). The proximal and distal coastal zones are those proposed by Rabouille et al. (2001). As 24
shown by these authors, this division of the global coastal zone provides a more realistic 25
representation of the role of continent to ocean transition in the biogeochemical cycling of 1
carbon and nutrients. The proximal zone consists of large bays, the open water parts of 2
estuaries, inner deltas, inland seas and coastal marshes (Woodwell et al., 1973). The distal 3
zone comprises the rest of the continental margins up to the shelf break. 4
These compartments are linked to one another via the water cycle (Figure 1). Water on 5
the continents is subdivided into an aquatic reservoir, which comprises exorheic rivers and 6
lakes including their floodplains (Box 1a), and a groundwater reservoir (Box 1b). The open 7
ocean is by far the largest compartment, with a mean water depth of 3600 m and covering 8
92% of the world ocean (Tréguer et al., 1995). Three vertical subcompartments of the water 9
column are considered: a 100 m thick surface layer where photosynthesis takes place (Box 10
4a), mesopelagic oceanic waters (100-1000 m depth) (Box 4b) and deep waters (Box 4c). 11
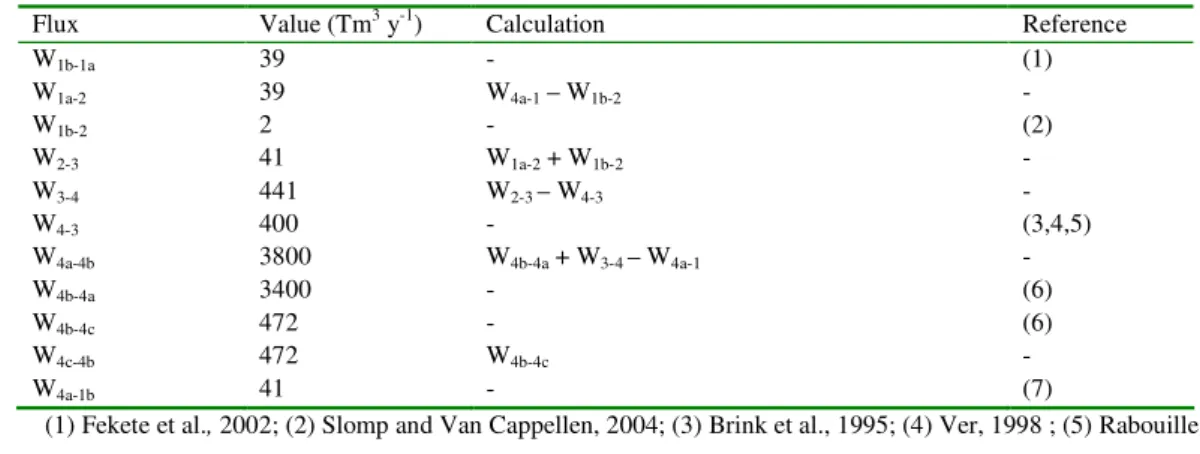
Water fluxes (W) considered in the baseline scenario are based on the simplified 12
steady-state water cycle summarized in Table 1. It should be noted that a contribution from 13
subsurface groundwater discharge to the proximal coastal zone is explicitly considered (W1b-2, 14
Slomp and Van Cappellen, 2004). The combination of water reservoir sizes with water fluxes 15
yields water residence times that agree well with previous studies (Garrels and Mackenzie, 16
1971; Broecker and Peng, 1982; Macdonald, 1998). 17
18
2.2 Reactive Si reservoirs 19
The DSi and bSiO2 reservoir masses are time-dependent variables of the Si cycle 20
model (Figure 2). DSi mainly consists of undissociated monomeric silicic acid, Si(OH)4, and 21
represents the main form under which silicon can be assimilated by organisms (Del Amo and 22
Brzezinski, 1999). Organisms use DSi to build structural elements made of amorphous, 23
hydrated silica, part of which is preserved after the death of the organisms (Simpson and 24
Volcani, 1981; Conley and Schelske, 2001). Here, bSiO2 includes the amorphous silica in 25
both living biomass and biogenic detritus in open waters, soils and sediments. It should be 1
noted that bSiO2 may undergo significant chemical and mineralogical changes (Van 2
Cappellen et al., 2002), even including a complete diagenetic transformation of the opaline 3
silica into alumino-silicate minerals (Michalopoulos et al., 2000). 4
In marine environments, the major producers of bSiO2 are diatoms, although other 5
organisms, such as radiolarians, sponges, and chrysophytes, may locally be important sources 6
of bSiO2 (Simpson and Volcani, 1981). On land, large quantities of DSi are fixed by higher 7
plants and deposited as amorphous silica in so-called phytoliths (Piperno, 1988). The 8
significant contribution of phytolith production and dissolution in the global Si cycle has only 9
recently been highlighted (Bartoli, 1983; Meunier et al., 1999; Conley, 2002a). 10
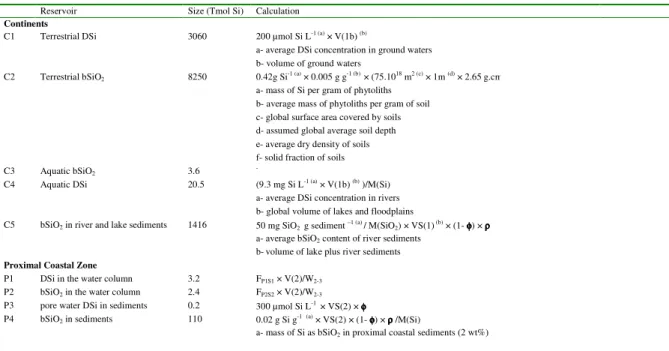
Estimations of DSi and bSiO2 reservoir sizes in the four earth surface compartments
11
are summarized in Table 2. Reservoir masses are mostly derived from estimates of the 12
average DSi or bSiO2 concentrations and the volumes of the corresponding reservoirs. In 13
some cases, however, the reservoir mass is calculated from flux estimates, assuming steady-14
state conditions. For example, the mass of DSi in the water column of the distal coastal ocean 15
(72 Tmol Si) is obtained from the export flux of DSi and the water flux to the open ocean 16
(Table 2). This estimate, combined with the reservoir volume (3600 Tm3, Figure 1), then 17
yields an average DSi concentration of the distal ocean of 20 µM, which can be compared to 18
the wide range of observed, depth-integrated DSi concentrations in shelf waters from <5µM 19
(Alvarez-Salgado et al., 1997; Gibson et al., 1997, Lacroix et al., 2007) to ~ 15µM (Heiskanen 20
and Keck, 1996) to >30µM, (Serebrennikova and Fanning, 2004; Zhang, 2002). 21
The ultimate source of DSi for the global Si cycle is chemical weathering of silicate 22
rocks of the continental and oceanic crust (Gerard and Ranger, 2002). The total mass of 23
silicate rock exposed at the Earth’s surface largely exceeds that of the reactive DSi plus bSiO2 24
reservoirs. Thus, on the time scales investigated (years to centuries), the reservoir size of 25
silicate rocks remains essentially unchanged. A large fraction of DSi released by weathering is 1
converted by plants into phytoliths and temporarily stored in soils (Saccone et al., 2008; 2
Figure 2). A rough estimate of the reservoir mass of bSiO2 in soils is obtained based on 3
average phytolith concentrations for different types of soils (Conley et al., 2002b), the average 4
soil bSiO2 concentration, and the global volume of soils. The latter is derived from the FAO 5
world soil map (FAO/UNESCO, 1986), assuming a mean soil depth of 1 meter (Pouba, 1968; 6
Batjes, 1997). 7
The sediment reservoirs correspond to the topmost layers where decomposition of 8
biogenic constituents drives the return of dissolved nutrient species to the water column 9
(including DSi). The corresponding volumes (VS, Table 2) are estimated by assigning a mean 10
thickness of 10 cm to the active layer of aquatic sediments on the continents and in the 11
proximal coastal zone (Heinze et al., 1999), and 20 cm for distal coastal zone and deep sea 12
sediments (De Master, 2002). An average porosity of 0.7 and an average dry density of 2.5 g 13
cm-3 are assumed for all sediments (Maher et al., 2004). The calculated sediment volumes of 14
boxes 1, 2, 3 and 4 are 1.73, 0.18, 5.5 and 75 Tm3, respectively. 15
16
2.3 Reactive Si fluxes 17
The fluxes of reactive Si are obtained from the literature, or constrained by assuming 18
that the Si cycle is initially at steady-state (Table 3). The assumption of an initial steady-state 19
is a common practice in the modeling and budgeting of global elemental cycles (e.g., 20
Mackenzie et al., 1993; Tréguer et al., 1995; Yool and Tyrrell, 2003). It is most likely that, 21
given the oceanic residence time of reactive Si is 15000-17000 years (Tréguer et al., 1995), 22
the marine Si cycle was not at steady state prior to 1950, due to glacial-interglacial changes. 23
Nonetheless, considering the time scales investigated in the simulations (≤ 150 years), these 24
much longer term changes have little effect on the system’s response to the imposed 1
perturbations. 2
The fluxes include the sources and sinks of reactive Si for the Earth’s surface 3
environment (Figure 2). The sources are chemical weathering on land (Fw) and flux of DSi to 4
the oceans resulting from basalt-seawater interactions (Fhyd). The sinks are burial of bSiO2 in 5
sediments (FC5-burial, FP4-burial, FS4-burial, FO8-burial), and removal of DSi due to reverse weathering 6
reactions in shelf sediments (FS3rw, Mackenzie and Garrels, 1966; Michalopoulos and Aller, 7
1995, 2004). Note that, because we assume an initially steady-state Si cycle, the sinks and 8
sources of reactive Si balance each other exactly. 9
All other fluxes either transform or transport reactive Si within the Earth’s surface 10
environment and are thus internal fluxes. Si fluxes are represented by the symbol “F” 11
followed by a subscript that identifies the initial (source) and final (sink) reservoir. The 12
reservoir symbols are listed in Tables 1 and 2, for water and reactive Si reservoirs, 13
respectively. Fluxes describing the uptake of DSi by organisms to produce bSiO2 (FC1C2, 14
FC3C4, FP1P2, FS1S2, FO1O2) scale to the primary production rates in the various compartments of 15
the earth surface environment (Table 3). Most bSiO2 is efficiently recycled via dissolution in 16
the water column (FC4C3, FP2P1, FS2S1, FO2O1, FO4O3, FO6O5), soils (FC2C1) and sediments (FC5C3, 17
FP4P3, FS4S3, FO8O7). The accumulation of DSi in the pore waters of sediments and progressive 18
loss in the reactivity of biogenic silica surfaces (ageing) ultimately allows a small fraction of 19
bSiO2 production to be buried and preserved in sediments (Van Cappellen et al., 2002). 20
The groundwater discharge flux of DSi to the coastal zone (FC1P1) is derived from the 21
corresponding water flux (W1a-2 in Figure 1) and the average DSi concentration in 22
groundwater. The riverine supply of DSi to the proximal zone (FC3P1) is derived by averaging 23
the estimated river DSi delivery fluxes computed for 150 coastal segments in the GEMS-24
GLORI (Meybeck and Ragu, 1995) and GEMS-PRISRI (Meybeck et al., 2003) databases, 25
under pristine conditions, that is, prior to human perturbation (Dürr et al., submitted). The 1
estimated river DSi flux (6.2 Tmol y-1) thus implicitly corrects for the drop in DSi 2
concentration in the downstream reaches of rivers that has accompanied the extensive 3
building of dams since the 1950s (Humborg et al., 2006). Note that, while the main source of 4
reactive Si for the oceans is in the form of DSi, the contribution of riverine bSiO2 delivery 5
(FC4P2) is far from negligible (Conley et al., 2000). Reactive Si is also supplied to the oceans 6
via the atmosphere with eolian dust (FC2O2), although this flux is most likely very small 7
(Tréguer et al. 1995) and its origin (biogenic vs. mineral) remains poorly know (Cole et al., 8
2009; Dürr et al., submitted). 9
Transport fluxes of DSi into the ocean (FP1S1, FS1O1, FO3S1, FO3O1, FO5O3), as well as 10
export fluxes of bSiO2 from the proximal zone to the distal zone (FP2S2) and from the distal 11
zone to the open ocean (FS2O2), are assumed to be directly coupled to the water cycle. That is, 12
the flux of DSi or bSiO2 exiting the reservoir is related to the mass of DSi or bSiO2 in that 13
reservoir according to: 14 Fij Si =Qij Vi (1) 15
where Fij and Qij are, respectively, the fluxes of reactive Si and water from reservoir i to 16
reservoir j, Si is the mass of DSi or bSiO2 in reservoir i, and Vi is the volume of the reservoir. 17
The remaining transport fluxes correspond to sedimentation (FO2O4, FO4O6) and 18
deposition of bSiO2 (FC4C5, FP2P4, FS2S4, FO6O8), and the efflux of DSi from sediments (FC5C3, 19
FP3P1, FS3S1, FO7O6). In the marine realm, these fluxes are relatively well constrained by 20
observations. Sedimentation rates and DSi fluxes from sediments can be determined directly 21
with sediment traps and benthic chambers, respectively (Koning et al., 1997; Rao and Jahnke, 22
2004). Furthermore, numerous estimates of benthic DSi efflux have been calculated from 23
measured pore water profiles (Rabouille et al., 1993; Dixit and Van Cappellen, 2003). 24
A widely used approach in biogeochemical box modeling is to relate the reservoir 1
sizes and fluxes via linear expressions, 2
Fij= kijSi (2)
3
where kij is a first order rate constant (Lasaga, 1981; Chameides and Perdue, 1997; Mackenzie 4
et al., 1998). Values of kij range from values of 1 y-1, for example for biological DSi uptake 5
and bSiO2 dissolution in aquatic environments, to values of 10-3 y-1 or less for groundwater 6
transport of DSi or burial of bSiO2 in the deep-sea sediments. 7
8
2.4 Model simulations 9
The mass balance equations for the various reactive Si reservoirs, based on the linear 10
flux equations (2), are solved in MATLAB using Euler’s method. The steady-state silica cycle 11
represented in Figure 2 is taken as the initial condition. After verifying that the state variables 12
exhibit no drift under time-invariant conditions, a time-dependent change in forcing is 13
imposed, as detailed below. The system behavior is monitored for a period of 150 years, using 14
an integration time step of 0.01 y. The starting time of the imposed perturbations is nominally 15
set to 1950. 16
To simulate the response of the Si cycle to a global temperature increase, three 17
different time-courses for mean surface air temperature are considered (low, medium and 18
high; Figure 3), based on projections of the Intergovernmental Panel on Climate Change 19
(IPCC, 1995). The three scenarios diverge after the year 2000. For simplicity, linear functions 20
are used to describe the rising air-temperature. Temperatures of surface waters (Box 1a, Box 21
2, Box 3 and Box 4a) are assumed to follow air temperature, while the magnitude of the 22
temperature rise of the intermediate oceanic waters is four times lower (Levitus, 2000). The 23
initial temperature of the intermediate water is set to 5°C (Yool and Tyrell, 2003). 24
The processes that are directly affected by temperature in the simulations are 1
biological DSi uptake, bSiO2 dissolution and chemical weathering. The model assumes that, 2
at the spatial and temporal scales resolved, an increase (decrease) in siliceous phytoplankton 3
production results in an increase (decrease) in DSi fixation. In particular, we assume that a 4
temperature-dependent change in primary production by diatoms causes a proportional change 5
in DSi uptake. The temperature dependence of DSi uptake in continental and marine 6
environments is described by the Eppley function (uptake rate ∝ e(0.07•T), where T is 7
temperature in °C, Eppley, 1972). This exponential function is widely used to describe the 8
response of planktonic communities to temperature variations, except under extreme 9
temperature conditions (Pasquer et al., 2005). This formulation implies the assumption that 10
changes in DSi uptake linearly follow diatom growth. In the absence of relationships 11
specifically describing the temperature dependence of DSi uptake by higher plants on land, 12
we opt for a simple Q10 function, whereby the uptake rate doubles with every 10°C 13
temperature increase (Winkler et al., 1996). The Arrhenius equation is used to correct the rates 14
of bSiO2 dissolution and silicate weathering (Lasaga, 1998). Reported activation energies for 15
the dissolution of framework silicates and bSiO2 fall mostly in the range 25-90 kJ mol-1 (Blum 16
and Stillings, 1995; Van Cappellen et al., 2002). Here, a single Arrhenius activation energy of 17
60 kJ mol-1 is imposed, to account for the effect of temperature changes on both silicate rock 18
weathering and bSiO2 dissolution. 19
Another major effect of human activity on the cycling of reactive Si at the Earth’s 20
surface is the construction of dams, known to trap large quantities of bSiO2 (Conley et al., 21
2000; Humborg et al., 2006). To test the sensitivity to damming, a correction coefficient is 22
added to the flux equation describing bSiO2 accumulation in sediments on the continents 23
(FC4C5). This coefficient is assigned a value of 1 at the start of the simulation and afterwards 24
varies proportionally with changes in the number of dams. Gleick (2003) has projected future 25
damming pressure over the next 25 years by relating global water use to the number of new 1
dams (Rosenberg et al., 2000). Based on this work, and the assumption that global water use 2
is proportional to the world’s population, we estimate that the number of dams should 3
increase by 20% with an increase of the world’s population by 1.9 billion people. Three 4
damming scenarios are then considered, based on three projections for the change in the world 5
population until the year 2100 (UN, 2005). The low, medium, and high damming scenarios 6
are shown in Figure 4. 7
Additional effects of anthropogenic modifications of the earth surface environment are 8
likely to affect Si cycling along the land-to-ocean continuum. On the time scales considered 9
here (≤ 150 years), shifts in precipitation patterns and vegetation, changes in land-use and 10
erosion will affect the cycling of Si on land and the delivery of reactive Si to the oceans 11
(Conley et al., 2008). On even longer time scales, changes in thermohaline circulation 12
accompanying a warming of the surface ocean will modify the exchanges of DSi between the 13
surface and deeper parts of the oceans, thereby affecting marine biosiliceous productivity (see, 14
e.g., Yool and Tyrell, 2005). A complete assessment of the response of the biogeochemical Si 15
cycle to human-induced global change will thus require further work. 16
17
3. Results and Discussion 18
3.1 The global silica cycle 19
Most previous global scale mass balance studies of the Si cycle have focused on the 20
oceans (Tréguer et al., 1995; De Master, 2002; Ragueneau et al., 2002; Yool and Tyrell, 2003, 21
2005; De La Rocha and Bickle, 2005). A novelty of the Si cycle presented here is that it 22
includes an explicit representation of DSi and bSiO2 cycling on the continents. Nevertheless, 23
due to the relative scarcity of data, the estimates of the continental reservoir masses and fluxes 24
have large uncertainties associated with them. For instance, the calculation of bSiO2 stock in 25
soils assumes an average concentration of 5 mg phytoliths per g of soil. While the latter value 1
is consistent with the bSiO2 determinations in soils that have been made so far (Alexandre et 2
al., 1997; Conley, 2002b; Clarke, 2003; Sferratore et al., 2006), it remains to be seen how 3
representative the relatively limited set of existing measurements is for the global soil 4
reservoir. 5
According to our estimates, phytoliths in soils and living terrestrial biomass constitute 6
the largest fraction (65%) of the continental reactive Si reservoir. The amount of Si fixed by 7
terrestrial and aquatic organisms on the continents on a yearly basis is estimated to be 89 8
Tmol y-1. This value lies within the range of 60-209 Tmol y-1 given in the literature (Conley, 9
2002b) and is of the same order of magnitude as the rate of Si fixation in the oceans (244 10
Tmol y-1). Thus, Si biomineralization on the continents is an important component of 11
biological Si cycling on Earth (Conley, 2002a). As in the marine realm, siliceous productivity 12
on the continents relies on the efficient regeneration of nutrient DSi through bSiO2 13
dissolution. In our budget, 80% of the continental bSiO2 produced is recycled, while the 14
remainder accumulates in lacustrine sediments and in soils (Kendrick and Graham, 2004), or 15
is exported to the oceans. Based on the estimates in Figure 2, the residence time of reactive Si 16
on the continents is estimated to be 775 years. 17
Most reactive Si is delivered to the oceans by rivers under the form of DSi (FC1P1; 6.2 18
Tmol y-1). Nonetheless, the alternative supply routes of riverine bSiO2 delivery (FC4P2; 1.1 ± 19
0.2 Tmol y-1), submarine groundwater discharge (FC1P1; 0.4 ± 0.4 Tmol y-1) and atmospheric 20
transport (FC2O2; 0.5 ± 0.5 Tmol y-1), together contribute about 25% of the transfer of reactive 21
Si from the continents to the oceans. When hydrothermal inputs are also included (Fhyd; 0.6 ± 22
0.4 Tmol y-1), we estimate the total reactive Si delivery to the ocean to be 8.8 ± 1.5 Tmol y-1. 23
In comparison, Tréguer et al. (1995) estimated the total reactive Si supply to the oceans to be 24
6.7 ± 1.5 Tmol y-1. These authors, however, did not account for the reactive Si input from 25
groundwater discharge and riverine bSiO2. It should further be recognized that all regional 1
sources of Si may not have been identified yet. For example, the venting of crustal fluids in 2
the North Pacific has only recently been suggested to contribute as much as 1.5 ± 0.5 Tmol y-1 3
to the global oceanic Si budget (Johnson et al., 2006). 4
Assuming an initial steady-state, the sum of the inputs to the ocean is balanced by that 5
of the outputs, and thus burial and reverse weathering should together yield a total removal 6
flux of 8.8 Tmol y-1. This value falls within the range for total reactive Si removal from the 7
ocean of 8.4 to 9.4 Tmol y-1, obtained when combining the estimated sediment burial fluxes of 8
biogenic Si of DeMaster (2002; 7.4 - 8.4 Tmol y-1) with that for reverse weathering (1.0 Tmol 9
y-1). 10
The explicit consideration of the proximal coastal zone enables us to account for the 11
important filter function of estuaries, lagoons and embayments in nutrient cycles (Rabouille et 12
al. 2001; Wollast, 1993; Seitzinger, 1996; Mackenzie et al., 2000). Significant Si processing 13
decreases the DSi/bSiO2 ratio from around 3 in rivers to 1.2 in the proximal zone. A net 14
transformation of DSi into bSiO2 is commonly observed in nearshore environments and 15
causes a large fraction (43%, according to our model) of reactive Si to be delivered from the 16
proximal to the distal coastal zone in the form of bSiO2. 17
The fluxes in Figure 2 emphasize the role of the continental margins in removing 18
reactive Si by sediment burial. Although the proximal and distal zones are only responsible 19
for about 18% of the total biological fixation of DSi in the oceans, they may account for 40% 20
of the total marine bSiO2 burial, in line with the assessment of DeMaster (2002). The sum of 21
the bSiO2 burial fluxes in the proximal and distal coastal zones in our budget (3.1 Tmol y-1) 22
corresponds to the maximum of the range estimated by DeMaster (2002) for bSiO2 burial 23
along the continental margins (2.4 - 3.1 Tmol y-1). It should be noted, however, that 24
DeMaster’s oceanic silica budget omits riverine supply of bSiO2 and groundwater DSi 25
discharge. Our relatively high estimate for bSiO2 accumulation in coastal sediments is 1
consistent with the inclusion of these additional reactive Si inputs to the coastal zone, as well 2
as the upward revision of the riverine DSi supply (6.2 versus 5.6 Tmol y-1). The preferential 3
burial of bSiO2 in nearshore and shelf sediments is not only due to the relatively high 4
sedimentation rates, but also to enhanced preservation resulting from interactions between 5
deposited bSiO2 and constituents solubilized from lithogenic minerals and the formation of 6
new aluminosilicate phases (Van Cappellen et al., 2002; Dixit and Van Cappellen, 2003; 7
Michalopoulos and Aller, 1995, 2004). In the proximal zone and especially in deltaic settings, 8
there is a tight coupling between biogenic Si burial and reverse weathering, and analytical 9
procedures for the measurement of biogenic silica account for reverse weathering products 10
(Michalopoulos et al, 2000, Michalopoulos and Aller 1995, 2004:, Presti and Michalopoulos 11
2008). Thus, the Si burial flux used here for the proximal zone may include reverse 12
weathering products. 13
The main inflow of DSi to the distal zone is caused by coastal upwelling, which is 14
estimated to be on the order of 10 Tmol y-1 (Figure 2). The intermediate water masses of the 15
open ocean (100-1000 m water depth) are assumed to be the source region for coastal 16
upwelling. This assumption is consistent with mesopelagic DSi concentrations (25-30 µmol 17
kg-1; Dittmar and Birkicht, 2001; Brezinski et al., 1997), and Si/N ratios close to one (Hill and 18
Wheeler, 2002; Brzezinski et al., 1997) reported for coastal upwelling waters. Deeper source 19
regions (i.e., >1000 m) would yield higher DSi concentrations and Si/N ratios between 2 and 20
3 (Sverdrup et al., 1942). 21
Tréguer et al. (1995) estimated the whole-ocean residence time of reactive Si to be on 22
the order of 15000 years. The latter value likely represents a lower limit, however, as these 23
authors excluded the active surface layer of marine sediments in their calculation. According 24
to the reservoir masses considered here, reactive Si in the water column and surface sediments 25
of the proximal coastal zone, distal coastal zone, plus the open ocean amounts to 149927 1
Tmol. The removal rate of reactive Si through burial and reverse weathering of 8.8 Tmol y-1 2
then implies a whole-ocean residence time of 17037 years. If the proximal coastal zone is 3
excluded, the oceanic residence time of reactive Si is 20245 years. Estimated residence times 4
for various marine reservoirs and their combinations are summarized in Table 4. 5
Interestingly, the residence times of reactive Si in the open ocean (10104 years) and 6
the distal coastal zone (141 years) alone are significantly lower than the whole-ocean 7
residence time (17037 years). This reflects the large exchange fluxes of reactive Si between 8
the continental margins and the open ocean. For the distal zone in particular, these exchanges 9
dominate the inputs and outputs of reactive Si and, hence, explain the relatively short 10
residence time of reactive Si on the continental shelves. 11
Water column residence times of reactive Si are somewhat shorter than the 12
corresponding water residence times (Table 4), because sinking of bSiO2 by sedimentation 13
decouples the Si cycle from the water cycle. Nonetheless, they are significantly lower than the 14
values obtained when including sediments. The relative differences are particularly large for 15
the proximal and distal coastal zone, because of the importance of benthic exchange fluxes of 16
reactive Si. This is especially the case in the distal coastal zone, where benthic regeneration of 17
silica accounts for nearly one-third of the reactive Si influx and is, therefore, a major source of 18
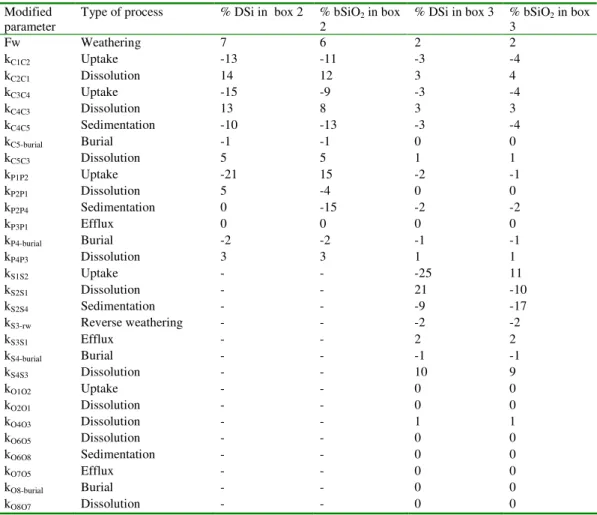
reactive Si sustaining siliceous productivity in the overlying water column (Ragueneau et al., 19 2005). 20 21 3.2 Sensitivity analysis 22
To identify the most sensitive processes controlling Si cycling across the continent-23
ocean transition, we compute the relative changes in water column DSi and bSiO2 24
concentrations of the coastal proximal and distal zones, induced by varying the rate constants 25
kij in the flux equations (Equation 2). In each simulation the value of one rate constant is
1
increased by 50%, while all other model parameters remain unchanged. The sensitivity of the 2
model to continental rock weathering (Fw) is similarly tested by increasing the value of Fw by 3
50%. Sensitivities are expressed as relative changes in DSi and bSiO2 concentrations after 150 4
years of simulation time, relative to the initial, steady-state values. 5
The rate constants included in the sensitivity analysis correspond to the reactive Si 6
fluxes that are not directly coupled to the water cycle via Equation (1). These fluxes include 7
uptake and biomineralization of DSi, dissolution, sedimentation, and burial of bSiO2, plus DSi 8
efflux across the sediment-water interface. In addition, on the time scale considered (150 9
years), Si cycling in the proximal zone is not affected by processes occurring in the 10
downstream distal coastal zone and open ocean reservoirs. Hence, the sensitivity analysis for 11
the proximal zone is further limited to rate constants kij corresponding to processes occurring
12
in the upstream, continental reservoir or within the proximal zone itself. In contrast, Si cycling 13
in the distal coastal zone may also be affected by processes in the downstream open ocean 14
reservoir, because of the return of oceanic waters onto the shelves via coastal upwelling. 15
The results of the sensitivity analysis are summarized in Table 5. DSi and bSiO2 16
concentrations of proximal coastal waters are most sensitive to chemical weathering of 17
continental rocks (Fw), terrestrial (FC1C2), riverine (FC3C4) and proximal coastal siliceous 18
production (FP1P2), and bSiO2 dissolution on the continents (FC2C1, FC4C3, FC5C3). Overall, 19
enhanced production and sedimentation lead to lower DSi and bSiO2 concentrations, while 20
increased dissolution results in larger stocks of reactive Si in the water column. The main 21
difference in the sensitivity of DSi and bSiO2 concentrations in the proximal zone is related to 22
the deposition of bSiO2 in nearshore sediments (FP2P4). While increasing kP2P4 causes a
23
significant drop (-15%) of the bSiO2 concentration in proximal waters, the DSi concentration 24
is hardly affected. The latter reflects the fact that internal recycling of DSi via dissolution of 25
bSiO2 within the proximal zone (FP2P1, FP4P3) is much less important than continental DSi 1
input (Figure 2). Thus, with the exception of nearshore siliceous production, reactive Si 2
dynamics in the proximal zone are primarily controlled by processes taking place on the 3
continents. 4
The sensitivity analysis reveals a different picture for the distal coastal zone (Table 5). 5
DSi and bSiO2 concentrations in the distal coastal waters are most sensitive to internal 6
processes. These include DSi uptake and bSiO2 dissolution in the water column (FS1S2, FS2S1), 7
as well as deposition (FS2S4) and dissolution of bSiO2 in the sediments (FS4S3). Among the 8
sensitive upstream processes, those on the continents, especially terrestrial bSiO2 production 9
and dissolution (FC1C2, FC2C1) and weathering (Fw), are more important than those in the 10
adjacent proximal coastal zone, although absolute changes larger than 4% are not observed. 11
Reactive Si cycling in the distal coastal zone is also sensitive to downstream processes, 12
foremost open ocean water column dissolution and sinking of bSiO2 (FO4O3, FO4O6), as these 13
processes control the accumulation of DSi in the source waters of coastal upwelling. 14
On the time scale investigated, permanent removal of reactive Si through burial plays 15
a minor role in Si cycling at the Earth’s surface. This contrasts with the dominant role of 16
sedimentary burial in the global biogeochemical Si cycle on geological time scales (De 17
Master, 2002; Van Cappellen, 2003). Nonetheless, even on the time scale of decades and 18
centuries, benthic-pelagic coupling is crucial to Si cycling in distal coastal waters (Conley, 19
1997; Ragueneau et al., 2002, 2005), as indicated by the high sensitivities to the deposition 20
(FS2S4) and subsequent benthic dissolution of bSiO2 (FS4S3). 21
Changes in Si cycling at the land-ocean transition may also be caused by changes in 22
the water cycle. Nevertheless, reliable scenarios for the future evolution of the water cycle are 23
difficult to constrain. In addition to bSiO2 retention, river damming causes a decrease of net 24
river flow to the oceans. In the proximal coastal zone, a reduction by 20% of the river 25
discharge (W1a2) to the oceans results, after 150 years, in a relatively small decrease (4 %) in 1
the concentration of DSi, but no change in that of bSiO2. For the distal coastal zone, the 2
corresponding changes are 3 and 4 % reductions in the concentrations of DSi and bSiO2. The 3
latter concentrations are further reduced (by 5 and 4 %, respectively) when the decrease in 4
river discharge by 20% is accompanied by a 20% reduction in the coastal upwelling water 5
flux (W43). On longer time scales, changes in the water cycle (e.g., upwelling) may have 6
significantly larger effects on global Si cycling (e.g., Yool and Tyrell, 2005). 7 8 3.3. Applications 9 3.3.1. Temperature rise 10
The three temperature scenarios yield the same general trends, but with different 11
magnitudes (Figure 5). Except for open surface ocean DSi, increasing temperatures result in 12
higher water column DSi and bSiO2 concentrations. bSiO2 concentrations in sediments of the 13
continents and deep-sea are hardly affected, while they show opposite trends in the proximal 14
(increase) and distal coastal ocean (decrease). 15
Rising concentrations of DSi and bSiO2 in the continental aquatic environment (Box 16
1a, Figure 2) reflect enhanced DSi fluxes from weathering and bSiO2 dissolution in soils. In 17
combination with the relatively small volume of the aquatic environment, this causes 18
significant, and parallel, increases in the DSi and bSiO2 concentrations. Because of more rapid 19
bSiO2 dissolution kinetics, the additional reactive Si mobilized does not accumulate in 20
sediments and soils, but is exported to the ocean. 21
Increased continental supply of reactive Si enhances siliceous productivity in proximal 22
and distal coastal ecosystems. The largest relative change is observed in the bSiO2 23
concentration of nearshore waters. That is, increased temperatures further decrease the water 24
column DSi/bSiO2 ratio of the proximal zone. The higher deposition flux of bSiO2 offsets the 25
faster bSiO2 dissolution kinetics, resulting in a net increase in the bSiO2 concentration of 1
proximal coastal sediments. Sediment bSiO2 concentrations in the distal coastal zone show an 2
opposite response, reflecting the very different recycling efficiencies of reactive Si in the two 3
coastal systems (Figure 2). The latter is also reflected in the relative increases in water column 4
DSi and bSiO2 concentrations. In the proximal zone, rising temperatures cause a larger 5
relative increase in bSiO2, compared to DSi, while the reverse is observed for the distal zone. 6
Possible indicators of a global warming effect on the Si cycle thus include opposite changes 7
of water column DSi/bSiO2 ratios and sediment bSiO2 accumulation rates in proximal versus 8
distal coastal environments. 9
Because of its much larger volume and of the buffering effect of the coastal zone, the 10
open ocean exhibits much smaller modifications in Si cycling. The most pronounced changes 11
are in the surface ocean, as it directly experiences changes in air temperature. Both DSi uptake 12
and bSiO2 dissolution rates are enhanced by rising temperature, resulting in faster Si turnover 13
in the upper ocean. For the model structure and parameter values used here, the net effect is a 14
slight increase in the bSiO2 standing stock, at the expense of the DSi pool. 15
16
3.3.2. River damming 17
River damming leads to opposite trends of DSi and bSiO2 concentrations compared to 18
those of temperature rise, with the exception of bSiO2 in distal coastal sediments (Figure 5, 19
broken lines). Predicted concentration changes also imply that damming should increase water 20
column DSi/bSiO2 ratios in continental aquatic systems and the proximal coastal zone. A 21
number of studies have indeed reported measurable increases in DSi/bSiO2 ratios of riverine 22
and nearshore waters (Conley 1997, 2002b; Friedl and Wuest, 2002). 23
As expected, the sedimentary bSiO2 pool on the continents increases as biosiliceous 24
debris accumulates behind the growing number of dams. The decreased continental supply of 25
reactive Si causes a relative drop in sediment bSiO2 in nearshore marine sediments and an 1
increase on the continents. It should be borne in mind, however, that the reservoir size of 2
proximal coastal zone sediment bSiO2 (110 Tmol Si) is much smaller than that of continental 3
sediments (1417 Tmol Si). At the scale investigated in our simulations, damming causes more 4
bSiO2 to be trapped in continental sediments than lost from proximal sediments. 5
A general feature of the response of Si cycling to changes in damming is the “dilution” 6
of the relative effects from rivers to the open ocean (Figure 5). Typically, the largest changes 7
in reactive Si concentrations are observed in aquatic systems on land and in the proximal 8
coastal zone, while the open ocean system experiences little changes. For example, the open 9
ocean surface DSi concentration is predicted to change by less than 1% after 150 years, even 10
for the highest damming scenario. 11
According to the damming scenarios, the largest increase in the number of dams 12
should have taken place between the 1950s and the present. After 2000, the different 13
damming scenarios hypothesize the same decreasing damming pressure until 2025, after 14
which the three scenarios diverge (Figure 4). The time-dependent features imposed to the 15
damming scenarios are recorded nearly instantaneously by the water column DSi and bSiO2 16
concentrations in the continental aquatic system and the proximal coastal zone, because of the 17
correspondingly very short residence times of reactive Si (2.1 and 0.7 years, Table 4). This is 18
not the case for the sediment bSiO2 concentrations in the same reservoirs. Because of much 19
longer residence, and hence response times, the initial trends (i.e., for the period 1950-2000) 20
are projected into the future with still little differentiation in sediment bSiO2 concentrations 21
among the scenarios by the year 2050. 22
23 24 25
3.3.3. Combined river damming and temperature rise 1
A set of nine permutations of the three temperature and three damming scenarios were 2
run. The results are illustrated in Figure 6 for the intermediate temperature rise plus maximum 3
damming scenario. This particular scenario was selected because it exhibits the main features 4
observed in all the various simulations. The comparison between Figures 5 and 6 suggests that 5
river damming is driving the changes in Si cycling in the combined scenario, particularly 6
during the initial period (1950-2000). On the continents, the results of the combined 7
simulation closely follow those of the damming-only simulation, except for the slight rise in 8
water column DSi concentration simulated beyond 2050. The slowing down of dam 9
construction after 2000 and continued rise in temperature cause much more pronounced 10
reversals in the water column DSi concentrations of the coastal ocean. By the end of the 11
simulation, the DSi concentration in the proximal zone has returned to within 2% of its 12
starting value, while in the distal zone the DSi concentration increases above the initial value. 13
The water column bSiO2 concentration in the proximal coastal zone mainly records the 14
changing damming pressure. This is no longer the case for the distal coastal zone, since 15
reactive Si cycling in this reservoir is largely driven by internal recycling, via temperature-16
dependent DSi uptake and bSiO2 dissolution. Thus, as far as the water column DSi and bSiO2 17
concentrations are concerned, when moving from the continents to the open ocean, the 18
relative influence of changes in river damming decreases, while that of global warming 19
increases. 20
Changes in sediment bSiO2 concentrations in the combined scenario are essentially the 21
same as in the damming-only scenario, for all reservoirs. The lack of temperature-induced 22
changes reflects the much longer residence times of reactive Si in the sediment reservoirs, 23
relative to the water column. That is, over the 150 years of simulation time, the sediments 24
only record the initial rapid growth in the number of dams after the 1950s. The observed loss 25
of sediment bSiO2 in coastal environments over the simulation period is therefore mainly due 1
to reactive Si retention by dams. 2
The results presented in Figures 5 and 6 illustrate the complex response of Si cycling 3
to human influences. In particular, the temporal trends in DSi and bSiO2 concentrations in the 4
combined damming plus temperature rise scenario are not simply the sum of the individual 5
responses to the two perturbations. Nonetheless, the results also indicate that by combining 6
temporal trends in DSi and bSiO2 concentrations in multiple reservoirs it may become 7
possible to extricate the relative effects of the different anthropogenic forcings acting on the 8
biogeochemical Si cycle. 9
4. Conclusions 10
Silicon is a key nutrient whose biogeochemical cycling is closely coupled to those of 11
carbon, nitrogen, phosphorus, iron and trace compounds. Large amounts of dissolved Si (DSi) 12
are biologically fixed annually as biogenic silica (bSiO2), both on land (89 Tmol y-1) and in 13
the oceans (240 Tmol y-1). The estimated residence time of reactive Si on the continents (775 14
years), however, is about 20 times smaller than for the oceans (17037 years), reflecting the 15
much larger marine reservoir of reactive Si. 16
While reactive Si is mainly exported from the continents as riverine DSi (6.2 Tmol y -17
1), a non-negligible fraction is delivered to the oceans as bSiO
2 in river suspended matter and 18
in eolian dust deposits (1.6 Tmol y-1), and as DSi in submarine groundwater discharge (0.4 19
Tmol y-1). Because of the net transformation of DSi into bSiO2 in nearshore waters, nearly 20
half (43%) of land-derived reactive Si reaching the distal coastal zone is in the form of bSiO2. 21
Nevertheless, the major input of reactive Si to the continental shelves is via coastal upwelling. 22
The coastal ocean represents a dynamic interface between the continents and the open 23
ocean. Although coastal and shelf environments account for only 18% of all biological Si 24
fixation in the oceans, an estimated 40% of all marine bSiO2 burial takes place in nearshore 25
and shelf sediments (3.2 Tmol y-1). Nearshore ecosystems also attenuate the downstream 1
propagation of land-based perturbations of the Si cycle that results from damming of rivers or 2
land-use changes. 3
The biogeochemical Si cycle is currently undergoing significant modifications due to 4
human activities. The proposed model can help delineate the expected changes, through 5
sensitivity analyses and scenario simulations. A major difficulty is that multiple 6
anthropogenic perturbations are simultaneously acting on the Si cycle. The results presented 7
here, and observed changes in rivers and nearshore waters, indicate that riverine export of 8
reactive Si, and the riverine bSiO2/DSi ratio, are likely to continue to drop in the near future, 9
as a result of reactive Si retention by dams. However, enhanced bSiO2 dissolution due to 10
global warming may ultimately allow coastal siliceous productivity to recover from the 11
downward trend caused by river damming. 12
Our work represents a first step towards modeling the global biogeochemical Si cycle 13
along the entire land to ocean continuum. Further progress will rely especially on the 14
increased understanding and characterization of the spatial heterogeneity of continental Si 15
cycling, caused by differences in lithology, vegetation, land-use and hydrology. This 16
information is needed to account for the regional variability in reactive Si delivery to the 17
coastal zone by rivers and submarine groundwater discharge. 18
19
Acknowledgements 20
This project was initiated during the 2004 Summer School of the EU-funded Research 21
Training Network SiWEBS (contract number HPRN-CT-2002-000218). Further work on the 22
project was made possible by financial support from the EU (SiWEBS), Utrecht University 23
(High Potential project G-NUX to C.P. Slomp) and the Netherlands Organisation for 24
Scientific Research (NWO Pioneer grant to P. Van Cappellen). We thank the editor and the 1
anonymous reviewers for their useful and constructive comments. 2 3 4 5 6 7 8 9 10 11 12 13 14 15 16 17 18 19 20 21 22 23 24 25
References 1
Alexandre, A., J.-D. Meunier, F. Colin and J. M. Koud (1997) Plant impact on the 2
biogeochemical cycle of silicon and related weathering processes. Geochim. Cosmochim. 3
Acta, 61, 677-682.
4 5
Alvarez-Salgado, X.A., C.G. Castro, F.F. Pérez and F. Fraga (1997) Nutrient mineralization 6
patterns in shelf waters of the Western Iberian upwelling, Continental Shelf Research 17, 7
1247–1270. 8
9
Anikouchine, W.A and R.W. Sternberg (1981) The World Ocean: An Introduction to 10
Oceanography, Prentice-Hall, NJ, USA.
11 12
Appelo, C. A. J. and D. Postma (1993) Geochemistry, Groundwater and Pollution, Balkema, 13
Amsterdam. 14
15
Arhondistis, G. E. and M. T. Brett (2005) Eutrophication model for Lake Washington (USA) 16
Part II—model calibration and system dynamics analysis. Ecological Modelling, 187, 179-17
200. 18
19
Batjes, N.H. (1997) A world data set of derived soil properties by FAO UNESCO soil unit for 20
global modeling, Soil Use Manage. 13, 9–16. 21
22
Bartoli, F. (1983) The biogeochemical cycle of silicon in two temperateforest ecosystems. 23
Ecological Bulletin 35, 469–476.
24 25
Berelson, W. M., D. E. Hammond and K. S. Johnson (1987) Benthic fluxes and the cycling of 26
biogenic silica and carbon in the two southern California Borderland Basins. Geochim. 27
Cosmochim. Acta, 51, 1345–1363.
28 29
Berner, E. A. and R. A. Berner (1996) Global Environment: Water, Air and Geochemical 30
Cycles Prentice-Hall.
31 32
Biscaye, P. E., C. N. Flagg and P. G. Falkowski (1994) The shelf edge exchange processes 33
experiment, SEEP-II: an introduction to hypotheses, results and conclusions. Deep-Sea Res. 34
ΙΙ, 41, 231-252. 35
36
Blum, A.E. and L.L. Stillings (1995) Feldspar dissolution kinetics, in Chemical Weathering 37
Rates of Silicate Minerals edited by A.E. White and S.L. Brantley, pp. 291-351. Mineralogical
38
Society of America. 39
40
Bonn, W.J. (1995) Biogenic opal and barium: Indicators for late Quarternary changes in 41
productivity at the Antarctic continental margin, Atlantic Sector. Reports on Polar Research, 42
180, 186pp., Alfred Wegener Institute for Polar and Marine Research, Bremerhaven. 43
44
Brink, K. H., F. F. G. Abrantes, P. A. Bernal, R. C. Dugdale, M. Estrada, L. Hutchings, R. A. 45
Jahnke, P. J. Muller and R. L. Smith (1995) Group report: How do coastal upwelling systems 46
operate as integrated physical, chemical, and biological systems and influence the geological 47
record?, in Upwelling in the Ocean: Modern Processes and Ancient Records edited by C. P. 48
1
Broecker, W.S. and T.-H. Peng (1982) Tracers in the Sea. A publication of the L-D 2
geological Observatory. Columbia University, Palisades, New York. Eldigio Press. 3
4
Brzezinski, M.A., D. R. Phillips, F. P. Chavez, G. E. Friederich and R. C. Dugdale (1997) 5
Silica production in the Monterey, California, upwelling system. Limnol. Oceanogr., 42, 6
1694-1705. 7
8
Chauvaud, L., F. Jean, O. Ragueneau and G. Thouzeau (2000) Long-term variation of the Bay 9
of Brest ecosystem: benthic–pelagic coupling revisited. Mar. Ecol. Prog. Series, 200, 35–48. 10
11
Chameides, W. L. and E. M. Perdue (1997) Biogeochemical Cycles. A Computer-Interactive 12
Study of Earth System Science & Global Change. Oxford University Press, New York /
13
Oxford, 1997 14
15
Clarke, J. (2003) The occurrence and significance of biogenic opal in the regolith, Earth Sci 16
Rev., 60, 175-194.
17 18
Cole, J. M., Goldstein, S. L., deMenocal, P. B., Hemming, S. R. and F. E. Grousset (2009) 19
Contrasting compositions of Saharan dust in the eastern Atlantic Ocean during the last 20
deglaciation and African Humid Period. Earth and Planetary Science Letters, 278, 257–266. 21
22
Conkright, M., S. Levitus and T. P. Boyer (1994) NOAA Atlas NESDIS 1. World Ocean 23
Atlas 1994, Nutrients, vol. 1, U.S. Government Printing Office, Washington, D.C., USA. 24
25
Conley, D. J. (1988) Biogenic silica as an estimate of siliceous microfossil abundance in 26
Great-Lakes sediments. Biogeochemistry, 6(3), 161-179. 27
28
Conley, D. J. (1997) Riverine contribution of biogenic silica to the oceanic silica budget. 29
Limnol. Oceanogr., 42, 774-777.
30 31
Conley, D. J. (2002a) The biogeochemical silica cycle: Elemental to global scales. Océanis, 32
28, 353-368. 33
34
Conley, D. J. (2002b) Terrestrial ecosystems and the global biogeochemical silica cycle. 35
Global Biogeochem. Cycle, 16, 1121, doi: 10.1029/2002GB001894.
36 37
Conley D.J., Kilham, S.S. and E. Theriot (1989) Differences in silica content between marine 38
and freshwater diatoms. Limnol. Oceanogr. 34, 205-213. 39
40
Conley, D. J., C.L. Schelske, and E.F. Stoermer (1993) Modification of the biogeochemical 41
cycle of silica with eutrophication. Mar. Ecol. Prog. Series, 101, 179-192. 42
43
Conley, D. J., P. Stålnacke, H. Pitkänen, and A. Wilander (2000) The transport and retention 44
of dissolved silicate from rivers in Sweden and Finland. Limnol. Oceanogr., 45, 1850-1853. 45
46
Conley, D. J. and T. C. Malone (1992) Annual cycle of dissolved silicate in Chesapeake Bay-47
implications for the production and fate of phytoplankton biomass. Mar. Ecol. Prog. Series, 48
81, 121–128. 49
Conley D. J. and C. L. Schelske (2001) Biogenic silica. in: Tracking Environmental Changes 1
Using Lake Sediments: Biological Methods and Indicators, edited by J. P. Smol, H. J. B.
2
Birks and W. M. Last, pp. 281-293. Kluwer Academic Press, Dordrecht. 3
4
Conley D. J., G. E. Likens, D. Buso, L. Saccone, S. W. Bailey, and C. Johnson (2008) 5
Deforestation causes increased dissolved silicate losses in the Hubbard Brook Experimental 6
Forest. Global Change Biol. 14, 2548-2554. 7
8
Cossins, A.R. and K. Bowler (1987) Temperature biology of animals. Chapman and Hall, 9
New York, New York. 10
11
Datnoff, L. E., G. H. Snyder and G. H. Korndörfer (2001) Silicon in agriculture, edited by L. 12
E. Datnoff, , G. H. Snyder and G. H. Korndörfer, Elsevier Sci., Amsterdam. 13
14
Del Amo, Y. and M.A. Brzezinski (1999) The chemical form of dissolved Si taken up by 15
marine diatoms. Journal of Phycology, 35 (6), 1162-1170. 16
17
De La Rocha, C. L. and M. J. Bikle (2005) Sensitivity of silicon isotopes to whole-ocean 18
changes in the silica cycle, Mar. Geol., 217, 267–282. 19
20
DeMaster, D.J., (2002) The accumulation and cycling of biogenic silica in the Southern 21
Ocean: revisiting the marine silica budget. Deep-Sea Res. ΙΙ, 49, 3155-3167. 22
23
Dittmar, T. and M. Birkicht (2001) Regeneration of nutrients in the northern Benguela 24
upwelling and the Angola-Benguela Front areas, South African Journal of Science, 97(5-6), 25
239-246. 26
27
Dixit, S. and P. Van Cappellen, (2003) Predicting benthic fluxes of silicic acid from deep-sea 28
sediments. J. Geophys. Res., 108(C10), 3334, doi:10.1029/2002JC001309. 29
30
Dürr H.H., Meybeck M., Hartmann J., Laruelle G.G., Roubeix V. (submitted). Global spatial 31
distribution of natural riverine silica inputs to the coastal zone. under review in 32
Biogeosciences Discussions
33 34
Egge, J.K. and D.L. Aksnes (1992) Silicate as a regulating nutrient in phytoplankton 35
competition. Mar. Ecol. Prog. Series, 83, 281-189. 36
37
Eppley, R. W. (1972) Temperature and phytoplankton growth in the sea. Fishery Bull., 70, 38
1063-1085. 39
40
Epstein, E. (1999) Silicon. Ann. Rev. Plant Physiol. Plant Molec. Biol., 50, 641-664. 41
42
Fekete, B.M., Vörösmarty, C.J. and W. Grabs (2002). High-resolution fields of global runoff 43
combining observed river discharge and simulated water balances. Global Biogeochemical 44
Cycles, 16(3), 1042, doi:10.1029/1999GB001254.
45 46
Food and Agriculture Organization/U.N. Educational, Scientific and Cultural Organization 47
(FAO/UNESCO), (1986). Gridded FAO/UNESCO soil units: UNEP/GRID, FAO soil map of 48
the world in digital form, digital raster data on 2-minute geographic (lat x lon) 5400 x 10800 49
1
Friedl, G. and A. Wüest, (2002) Disrupting biogeochemical cycles – Consequences of 2
damming.Aquatic Science, 64, 55-65. 3
4
Friedl, G., C. Teodoru and B. Wehrli (2004) Is the Iron Gate I reservoir on the Danube River 5
a sink for dissolved silica? Biogeochemistry, 68, 21-32. 6
7
Garnier, J., A. D’Ayguesvives, J. Billen, D. J. Conley and A. Sferratore (2002) Silica 8
dynamics in the hydrographic network of the Seine River. Océanis, 28, 487-508. 9
10
Garrels, R. M. and F. T. Mackenzie (1971) Evolution of Sedimentary Rocks, edited by W.W. 11
Norton, 397pp., New York. 12
13
Gerard, F. and J. Ranger (2002) Silicate weathering mechanisms in a forest soil. Océanis, 28, 14
384-415. 15
16
Gibson, C.E., B.M. Stewart and R.J. Gowen (1997) A synoptic study of nutrients in the north– 17
west Irish Sea, Estuarine, Coastal and Shelf Science 45, 27–38. 18
19
Gleick, P.H. (2003) Global freshwater resources: Soft-path solutions for the 21st Century. 20
Science, 302,1524-1528.
21 22
Heinze, C., E. Maier-Reimer, A. M. E. Winguth and D. Archer (1999) A global oceanic 23
sediment model for long-term climate studies, J. Geophys. Res., 13(1), pp. 221, 24
doi:98GB02812. 25
26
Heiskanen, A.S. and A. Keck (1996) Distribution and sinking rates of phytoplankton, detritus, 27
and particulate biogenic silica in the Laptev Sea and Lena River (Arctic Siberia), Mar. Chem. 28
53, 229–245. 29
30
Hill, J.K. and P. A. Wheeler (2002) Organic carbon and nitrogen in the northern California 31
current system: comparison of offshore, river plume and coastally upwelled water. Progress 32
in Oceanography, 53, 369-387.
33 34
Humborg, C., D. J. Conley, L. Rahm, F. Wulff, A. Cociasu and V. Ittekot (2000) Silicon 35
retention in river basins: far-reaching effects on biogeochemistry and aquatic food webs in 36
coastal marine environments. Ambio, 29(1), 45–51. 37
38
Humborg, C., M. Pastuszak, J. Aigars, H. Siegmund, C. M. Morth, V. Ittekkot (2006) 39
Decreased silica land-sea fluxes through damming in the Baltic Sea catchment - Significance 40
of particle trapping and hydrological alterations. Biogeochemistry 77(2), 265-281. 41
42
Jahnke, R. A., S. R. Emerson and J. W. Murray (1982) A model of oxygen reduction, 43
denitrification, and organic matter mineralization in marine sediments. Limnol. Oceanogr., 27, 44
610-630. 45
46
Johnson, H. P., S. L. Hautala, T. A. Bjorklund, and M. R. Zarnetske (2006) Quantifying the 47
North Pacific silica plume. Geochem., Geophys., Geosys. 7: doi:10.1029/2005GC001065. 48
Kendrick, K. J. and R. C. Graham. (2004) Pedogenic silica accumulation in chronosequence 1
soils, Southern California. Soil Sci. Soc. Amer. J. 68, 1295-1303. 2
3
Koning, E., G,-J. Brummer, W. Van Raaphorst, J. Van Bennekom, W. Helder and J. Van 4
Ipperen (1997) Settling, dissolution and burial of biogenic silica in the sediments off Somalia 5
(northwestern Indian Ocean). Deep-Sea Res. II, 44, 1341–1360. 6
7
Lacroix, G., Ruddick, K., Park, Y., Gypens, N. and C. Lancelot (2007). Validation of the 3D 8
biogeochemical model MIRO&CO with field nutrient and phytoplankton data and MERIS-9
derived surface chlorophyll a images. Journal of Marine Systems 64 (1–4), 66–88. 10
11
Lasaga, A. C. (1981) Rate laws of chemical reactions, in Kinetics of Geochemical Processes, 12
Vol. 8, edited by Lasaga, A. C. and R. J. Kirkpatrick, pp. 1–169. Mineralogical Society of 13
America. 14
15
Lasaga, A.C. (1998) Kinetic Theory in the Earth Sciences. Princeton, New Jersey: Princeton 16
University Press. 17
18
Ledford-Hoffman, P. A., D. J. DeMaster and C. A. Nittrouer (1986) Biogenic silica 19
accumulation in the Ross Sea and the importance of Antarctic continental-shelf deposits in the 20
marine silica budget. Geochim. Cosmochim. Acta, 50, 2099-2110. 21
22
Levitus, S.J.L., T.P. Antonov, Boyer, and C. Stephens, (2000) Warming of the world ocean. 23
Science, 287., 2225 – 2229.
24 25
Leynaert, A., P. Tréguer, and C. Lancelot (2001) Silicic acid limitation of Equatorial Pacific 26
diatom populations : evidence from 32Si kinetic experiments. Deep-Sea Res., 48, 639-660. 27
28
Macdonald, A. M. (1998) The global ocean circulation: a hydrographic estimate and regional 29
analysis. Progress in Oceanography, 41, 281–382. 30
31
Mackenzie, F. T. and R.A. Garrels (1966) Chemical mass balance between rivers and oceans. 32
Amer. J. Sci., 264, 507-525.
33 34
Mackenzie, F. T., A. Lerman, and L. M. Ver (1998) Role of the continental margin in the 35
global carbon balance during the past three centuries. Geology, 26, 423–426. 36
37
Mackenzie, F. T., L. M. Ver and A. Lerman (2000) Coastal-zone biogeochemical dynamics 38
under global warming. Int. Geol. Rev., 42, 193–206. 39
40
Mackenzie, F. T., L. M. Ver, C. Sabine, M. Lane and A. Lerman (1993) C, N, P, S global 41
biogeochemical cycles and modeling of global change. in Interactions of C, N, P and S 42
Biogeochemical Cycles and Global Change, edited by Wollast, R., F. T. Mackenzie and L.
43
Chou, pp.1–62. Springer-Verlag. 44
45
Maher, K., DePaolo D. J. and Lin J. C.-F. (2004) Rates of silicate dissolution in deep-sea 46
sediment: in situ measurement using 234U/238U of pore fluids. Geochim. Cosmochim. Acta, 47
68(22), 4629-4648. 48