Publisher’s version / Version de l'éditeur:
Electrochimica Acta, 37, 3, pp. 477-487, 1992
READ THESE TERMS AND CONDITIONS CAREFULLY BEFORE USING THIS WEBSITE.
https://nrc-publications.canada.ca/eng/copyright
Vous avez des questions? Nous pouvons vous aider. Pour communiquer directement avec un auteur, consultez la première page de la revue dans laquelle son article a été publié afin de trouver ses coordonnées. Si vous n’arrivez pas à les repérer, communiquez avec nous à PublicationsArchive-ArchivesPublications@nrc-cnrc.gc.ca.
Questions? Contact the NRC Publications Archive team at
PublicationsArchive-ArchivesPublications@nrc-cnrc.gc.ca. If you wish to email the authors directly, please see the first page of the publication for their contact information.
NRC Publications Archive
Archives des publications du CNRC
This publication could be one of several versions: author’s original, accepted manuscript or the publisher’s version. / La version de cette publication peut être l’une des suivantes : la version prépublication de l’auteur, la version acceptée du manuscrit ou la version de l’éditeur.
Access and use of this website and the material on it are subject to the Terms and Conditions set forth at
Mechanism of anodic dissolution and passivation of iron - I. Behavior in
neutral acetate buffer solutions
Takahashi, K.; Bardwell, J. A.; MacDougall, B.; Graham, M. J.
https://publications-cnrc.canada.ca/fra/droits
L’accès à ce site Web et l’utilisation de son contenu sont assujettis aux conditions présentées dans le site LISEZ CES CONDITIONS ATTENTIVEMENT AVANT D’UTILISER CE SITE WEB.
NRC Publications Record / Notice d'Archives des publications de CNRC:
https://nrc-publications.canada.ca/eng/view/object/?id=2c8e6749-9bfa-4097-97e5-be11e4a40904
https://publications-cnrc.canada.ca/fra/voir/objet/?id=2c8e6749-9bfa-4097-97e5-be11e4a40904
Elecrrochimica km, Vol. 37, No. 3, pp. 477-487, 1992
zyxwvutsrqponmlkjihgfedcbaZYXWVUTSRQPONMLKJIHGFEDCBA
Printed in Chat Britain.
001346S6/92 $5.00 +
zyxwvutsrqponmlkjihgfedcbaZYXWVUTSRQPONMLKJIHGFEDCBA
0.00 Pergamon Press pk.MECHANISM
OF ANODIC DISSOLUTION
AND
PASSIVATION
OF IRON-I.
BEHAVIOR IN NEUTRAL
ACETATE BUFFER SOLUTIONS
K. TAKAHASHI,* J. A. BARDWELL, B. MACDOUGALL and M. J. GRAHAM
Institute for Microstructural Sciences, National Research Council of Canada, Ottawa, Canada KIA OR9
zyxwvutsrqponmlkjihgfedcbaZYXWVUTSRQPONMLKJIHGFEDCBA
(Received 12 M arch 1991; in revised form 15 May 1991)
Abstract-The kinetics of the anodic dissolution and passivation of Fe have been studied in neutral and slightly acidic acetic acid/sodium acetate buffer solution as a function of the total acetate buffer concentration and pH. The results have been obtained from potential sweep experiments at 5 mV SK’, which corresponds to quasi-steady state conditions. Two anodic peaks were found in the active dissolution region of the voltammogram. A reaction order of -0.7 f 0.2 with respect to acetate concentration and of 1.4 f 0.2 with respect to pH has been found for the Tafel region of the first peak; more complicated behavior was found for the remainder of the voltammogram. Galvanostatic cathodic reduction experi- ments were used to characterize the surface film formed during the anodic sweep. A mechanism is proposed which accounts for the observed reaction orders, and simulates the observed anodic voltammograms in a semi-quantitative fashion. The mechanism provided a simple, physical explanation for the observed negative reaction order with respect to acetate concentration.
Key words: iron, dissolution, acetate, passivation, oxide film.
JNTRODUCTION
Over the last three decades, extensive research on the mechanism and kinetics of the anodic dissolution of Fe has been performed. Studies have been made over a wide range of pH’s and in many kinds of electrolytes, and a number of different dissolution mechanisms have been proposed. Bockris et al.[l, 21 suggested that Fe dissolution in acid solution pro- ceeds according to a consecutive mechanism, with the initial step being the formation of an adsorbed inter- mediate, ie (FeOH),d, and the rate determining step being the discharge of this intermediate. The general form of this mechanism has been confirmed by many experimental observations[3-141, and other authors [15-17] suggested that the adsorbate was water in acid solution and hydroxyl ion in alkaline solution. Heusler et ul.[ l&20] proposed a catalytic mechanism, where (FeGH),d acts catalytically in the initial step of Fe dissolution. Some authors[21-241 observed behavior corresponding to both mechanisms in the same solution; the catalytic mechanism applied to cold-worked Fe surfaces, while the consecutive mechanism applied for annealed surfaces.
Kinetic studies have been made in acid[3,4,6, 10, 12, 13,25-311, neutral[5,8, 14,32-361 and alkaline [5,7,9, 11,37-421 solutions, and the influence of the electrolyte species has also been investigated. In acidic chloride solution, the reaction order for Cl- is not zero; ie Cl- participates in the reaction. However, different values of the reaction order were reported 143-461. The effects of other anions such as bromide, iodide, acetate, sulfate, sulfide, phosphate and bicarb- *Visiting scientist at NRC. Present address: Ku&a Water
Industries, Morinosato, Atsugi, 243-01, Japan.
onate have also been investigated[47-531. In particu- lar, Beth-Nielsen et a1.[23,54-571 have performed a series of investigations into the effects of the acetate ion on Fe dissolution.
With regard to the industrial application of corro- sion inhibitors, it is clearly important to investigate the effects of the electrolyte species on the corrosion behavior of Fe in neutral solutions. Compared with the detailed research on the effect of corrosive anions such as the halides, very little fundamental knowledge exists on the action of functional groups found in inhibitor formulations. Such functional groups include phosphate, carboxyl, amino, and sulfonate. The pres- ent paper presents results on the active dissolution and passivation of Fe in neutral and slightly acid acetic acid/sodium acetate buffer solution, ie solu- tions containing the carboxyl group. A systematic study has been performed to investigate the effect of both pH and acetate concentration, and a mechan- ism is proposed which provides a semi-quantitative explanation for the results. In addition, the technique of galvanostatic cathodic reduction is used to provide an in situ monitor of the presence of surface oxide and/or hydroxide films on the Fe surface as a function of potential.
EXPERIMENTAL
Fe samples were cut from 99.9% + foil of 0.5 mm thickness, supplied by Goodfellow Metals, England. They were polished to 600 grit Sic and were subse- quently annealed in vacuum at 850°C for 24 h. The samples were electropolished in 20: 1 acetic: perchloric acid before each electrochemical experiment. Thus, the electrode samples should be free from any cold-work effects.
478 K. TAKAHASH~ et al.
Acetate buffer solutions were made by mixing equimolar solutions of acetic acid (Aristar, BDH) and sodium acetate (AnalaR, BDH). In the dis- cussion below, [acetate] will refer to the total acetate buffer concentration [CH, COOH] + [CH, COO-]. [CH,COOH] will be abbreviated [HA] and [CH,COO-] as [A-]. The ratio [HA]/[A-] will, of course, vary with pH. The concentration of the various species may be calculated from
[HA] = 10epH [acetate] K. + 10-p” [A-] = [acetate] - [HA],
where K. is the equilibrium constant for the dissociation of HA and is given by
K
* =
[H+l[A-l=
1 75 x 10-s[HA] *
Solutions were deaerated with nitrogen before use. and were quiescent. Experiments were performed at room temperature (20-22”(Z). Potentials were
measured relative to a Hg/Hg,SO,/O. 15 N
zyxwvutsrqponmlkjihgfedcbaZYXWVUTSRQPONMLKJIHGFEDCBA
Nar SO, reference electrode (0.421 V us SW, 0.661 V us she).All electrodes were galvanostatically reduced at 20 PA cm-* for 300 s to remove the electropolish film before initiating a potential sweep. All sweep exper- iments were initiated at - 1.5 V. A PAR model 173 Potentiostat with a custom modified 276 interface was used as described previously[58]. The potentio- stat could be switched from the sweep voltammetry mode to the galvanostatic mode within a few
milliseconds.
zyxwvutsrqponmlkjihgfedcbaZYXWVUTSRQPONMLKJIHGFEDCBA
RESULTS
An anodic direction linear sweep voltammogram at 5 mV s-l of Fe in pH 7,1 M acetate solution is shown in Fig. 1. A number of anodic peaks are observed; most prominently a small peak at - 1.16 V, and a larger peak at -0.88 V, which will be referred to as peak A and peak B, respectively. An extensive range of passivity is observed in this solution, followed by oxygen evolution at high potentials. These two active dissolution peaks have been observed for Fe in many electrolytes, eg sulfate[4], carbonate[59-611,
and borate[62].
zyxwvutsrqponmlkjihgfedcbaZYXWVUTSRQPONMLKJIHGFEDCBA
-1.6 -110 -014 0:2 016 E Wm. WMij04)
Fig. 1. Anodic sweep vokammograms for Fe at 5 mV s-l in
pH 7 solution with [acetate] = 1 M and 0.1 M: Peak A’ obtained at [acetate] = 0.1 M is an artifact due toinsu55ent
buffer capacity.
(i) Limitations of the experimental data
In the present work, a systematic investigation of the behavior of Fe in the region of peaks A and B was made as a function of pH and [acetate]. However, it is important to recognize that meaningful results cannot be obtained unless the solution has adequate buffer capacity; this limited the range of pH and [acetate] over which experiments could be performed. Adequate buffer capacity is necessary, since during the cathodic galvanostatic treatment and during the sweep at cathodic potentials, hydrogen is evolved, resulting in a depletion of H+ at the electrode surface. If the solution has insu8icient buffer capacity, this surface pH change will be significant, and will be an uncontrolled parameter in the experiment. Shown in Fig. 1 is an experiment where buffer capacity was insufficient, viz. pH 7, 0.1 M [acetate]. This sweep shows three anodic peaks in the region where norm- ally only two are observed. The first peak, labelled A’, is an artifact of the polarization-induced basicity near the electrode surface. Peak A’ appears when [acetate] ~0.5 M in pH 7 solution and when [acetate] co.075 M in pH 6 solution. These solutions have approximately the same buffer index, confirming the origin of peak A’ as insuflicient buffer capacity. Peak A’ disappears at slower sweep rates, indicating that it will not occur if sufficient time is allowed for the surface pH to equilibrate after the cathodic treat- ment. As a further supporting argument, three peaks are commonly observed in this potential region in strong alkaline solution[38,39,63]. In the present paper, results were considered only when buffer capacity was not a problem.
Since the experiments were performed under quiescent conditions, the accumulation of Fe2’ at the surface of the electrode is to be expected at high current densities; moreover, it may hydrolyse, result- ing in a local acidification at the electrode surface. Furthermore, most experiments were performed at a sweep rate of 5 mV s-‘. However, experiments done at slower sweep rates in pH 7 solution indicated that many kinetic parameters, including the Tafel slopes, varied with sweep rate. Therefore, the chosen sweep rate of 5 mV s-i should be considered to correspond to quasi steady-state conditions only. In addition, there is no guarantee that a sweep rate of 5 mV s-l is an equally good approximation to steady-state when the pH and/or [acetate] is varied. While the parameters obtained in this study at 5 mV s-I are probably not rigorous, steady state values, they are comparable to results obtained by many other workers using slow sweeps. Finally, no IR compensation was made to the data.
For the above reasons, the data obtained in this work cannot be used in a rigorous, quantitative way. However, it will be shown that a semi-quantitative treatment provides useful information about this important system.
(ii) Effect of acetate buffer concentration
The effect of acetate buffer concentration on the anodic voltammograms of Fe in pH 6 solution is shown in Fig. 2. Significant effects of [acetate] are observed, suggesting that either the acetate anion and/or the undissociated acetic acid is involved in the
Dissolution and passivation of iron-1
-1.4 -1.2 -1.0 -0.6 -0.6 -0.4 -1.4 -1.2 -1 .o -0:s i.6 -6.4 E (V vs. Hg/Hg$O,) E (V vs. Hg/Hg&)
Fig. 2. Effect of [acetate] on anodic sweep voltammograms for Fe at 5 mV s-r in pH 6 solution with [acetate] = 1 M and
0.1 M.
Fig. 4. Effect of pH on anodic sweep voltammograms for Fe at 5 mV s-’ in [acetate] = 1 M solution, with pH 6 and 5.
reaction. In the Tafel region of peak A, the reaction order with respect to [acetate] (defined as Y,,,,,~) is negative, ie the presence of additional [acetate] reduces the reaction rate. However, in the Tafel region of peak B, the results are more complicated. At pH G 6, there is a positive reaction order with respect to [acetate], ye,lWtitcl, but this reaction order decreases to approximately zero at pH 7. In general, the maximum currents at both peaks A and B (jr,* and jr,,) are larger with higher [acetate]. The peak potential for peak A (E,,,) is nearly constant as [acetate] is varied, while the peak potential for B (E,,,) shifts cathodically with increasing [acetate]. The Tafel slopes calculated from the linear portions of the rising edges of peaks A and B are shown in Fig. 3 as a function of [acetate]. Peak A has a Tafel slope of about 40 mV/decade, while peak B exhibits a higher Tafel slope, about 120mV/decade. Both Tafel slopes decrease with increasing [acetate]. The effect of [acetate] at pH 7 shows similar trends, except that E,,, B as well as EP, A is nearly constant with respect to [acetate].
(iii) Eflect ofpH
The effect of pH on the anodic voltammograms of Fe in 1 M [acetate] buffer is shown in Fig. 4. The Tafel regions of both peaks A and B clearly indicate that the apparent reaction orders with respect to pH,
YA.~H and YB,~H, are positive. The maximum peak
currents, j,,A andj,, a, increase with decreasing pH, as shown quantitatively in Fig. 5. In addition Ep,A and
Ep,B change linearly with pH; for 1 M solutions the
zyxwvutsrqponmlkjihgfedcbaZYXWVUTSRQPONMLKJIHGFEDCBA
1
10“ 10”
[acetate] (M)
Fig. 3. The Tafel slope for peaks A and B as a function of [acetate] of pH 6 solution.
Fig. 6. The Tafel slopes for peaks A and B as a function of pH for [acetate] = 1 M and 0.1 M.
0
5
( 01
5 6 7 6
PH
Fig. 5. The maximum current, j,,, at peaks A and B as a function of pH for [acetate] = 1 M and 0.1 M solution.
shift is -76 and - 140 mV/(pH unit), respectively. The values of these slopes were found to be a function of [acetate], however, changing to - 106mV/(pH unit) and - 207 mV/(pH unit) respectively at [acetate]
= 0.1 M. The Tafel slopes for peaks A and B are shown in Fig. 6 for both 1 M and 0.1 M [acetate]. The Tafel slope of peak B seems to show a dependence on [acetate] and pH.
(iv) Calculation of reaction orders
In order to calculate the reaction orders, yA,taatatel and yA, pli, values of j, , which is the current density at a fixed potential, were obtained by interpolation or extrapolation of the Tafel lines to - 1.2 V. This potential was chosen since it was within the Tafel region in most cases. The results are summarized in
I
6 7 a
480 K. TAKAHASHI CI al. 5 0 [acsmie].lM : x
zyxwvutsrqponmlkjihgfedcbaZYXWVUTSRQPONMLKJIHGFEDCBA
[acela+o.lM - 6 7 6 PHFig. 7. (a) The relationship between j+ for peak A, extrapolated to a constant potential of - 1.2 V, and pH for [acetate] = 1 M and 0.1 M. A reaction order of 1.4 with respect to pH is calculated from the slopes, while the separation of the two lines indicated by the arrow, gives a reaction order of -0.6 f 0.1 with respect to [acetate]. (b) The relationship between j+ for peak A, extrapolated to a constant potential of - 1.2 V and [acetate] for a constant pH of 6. the slope of the line indicates a reaction order of -0.7 with
respect to [acetate].
Fig. 7a. The slope of the lines yields yp, pH = 1.4, while potential. However, if a different reasonable extrap- the separation between the lines ytelds yA,tacctntcl = olation potential (within the linear Tafel region) is
- 0.6 + 0.1. Some caution is necessary, however, since the Tafel slope depends on [acetate] and pH (see
chosen for each pH, then yA,Ioatntel is calculated to be -0.7 f 0.2, and y,,,, = 1.4 + 0.2, in good agreement Figs 3 and 6). Thus, the estimation of yA,tacetaWl will with the above result for a constant potential of vary depending on the choice of the extrapolation - 1.2 V. Another method of calculating ~*.t,,,~ is
Table 1. Comparison of experimental parameters with those of Beth-Nielsen[23, U-57], and the results of the simulation using the model illustrated in Figs 9 and 10 and the constants given in Table 2
Parameter This work Beth-Nielsen Simulation
YA. ph YB. PH Tafel slope peak A Tafel slope peak B -0.7 f 0.2 =O@H 7) >o(sdpHC6) >o* 0 to 0.45* small* small, CO* 1.4kO.2 <o* -0.39 + 0.1 (1 M) -0.22 f 0. I (0.1 M) -0.37 f
zyxwvutsrqponmlkjihgfedcbaZYXWVUTSRQPONMLKJIHGFEDCBA
0.1zyxwvutsrqponmlkjihgfedcbaZYXWVUTSRQPONMLKJIHGFEDCBA
(1 M) -0.15 f O.l(O.1 M) -76(1 M) - 106 (0.1 M) - 140 (1 M,) - 207 (0. I M) 4Oto50 9Oto200 -0.7, - 1 -0.4, -0.2, -0.18 -0.4 to 0.4zyxwvutsrqponmlkjihgfedcbaZYXWVUTSRQPONMLKJIHGFEDCBA
0 1 -0.2 -0.5 - 120, -60 40 120 -0.68 @H 7) -0.67 @H 6) 0.81 @H 7) 0.56 (pH 6) * 0.87 @H 7) 0.66 @H 6) 30 (PH 7) 17(pH6) 0(.~H7) 7(PH6) 1.48(1 M) 1.62 (0. I M) * -0.60 (1 M) -0.53 (0.1 M) -0.37 (1 M) -0.44 (0.1 M) -71 (1,O.l M) -68 (1 M) -63 (0.1 M) 39 to 47 125 to 142 *No linear relationship.Dissolution and passivation of iron-1 481 shown in Fig. 7b. The slope of a plot ofj, us [acetate]
at pH 6 also yields a value of -0.7. Exact numerical values of YE, [acetate1 and ~+n cannot be obtained from the voltammetric data, since the Tafel slope depends very strongly on both [acetate] and pH.
Table 1 summarizes the parameters for the acetate system, comparing the results from this work with those obtained by Beth-Nielsen[23,54-571. It can be seen that in general there is good agreement. In most cases, the range of values seen in this work is some- what larger, but this may reflect the greater range of pH and [acetate] utilized in the present work. It should be emphasized that the model developed by Beth-Nielsen gives a value of unity for the reaction order of peak A with respect to pH, ~~,~n. Thus, his model cannot account for the value of 1.4 f 0.2 obtained in the present work. The data of Bech- Nielsen were obtained at more acidic pH, where a sweep rate of 5 mV s-t would be expected to give a reasonable approximation to steady-state conditions. The good agreement between the present parameters and those of Beth-Nielsen provides further support for the assumption of quasi steady-state conditions, as discussed above.
(v)
zyxwvutsrqponmlkjihgfedcbaZYXWVUTSRQPONMLKJIHGFEDCBA
Galvanostatic cathodic reduction of thejlm formed during the potential sw eepGalvanostatic cathodic reduction has been often used to characterize the passive film on Fe. In recent work, this technique was used in acetate buffer solu- tion, and the results compared with those obtained in
-1.5
zyxwvutsrqponmlkjihgfedcbaZYXWVUTSRQPONMLKJIHGFEDCBA
-1 .o -0.5 0 0.5 xxxx
0 0vux
! Doooe
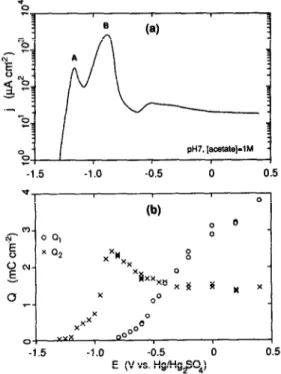
-1.5 -1 .o -0.5 0 0.5 E (V vs. HglHgqOJFig. 8. (a) Experimental anodic sweep voltammogram for Fe at 5 mV s-’ in pH 7 solution with [acetate] = 1 M. (b) The cathodic charges corresponding to the two stages in the galvanostatic (20 pA cm-3 cathodic reduction profile. The potential was swept to a given value at 5 mV s-‘, and then the galvanostatic reduction was started. The charge Q, refers to the reduction of a Fern-containing oxide, while Q2
refers to reduction of a Fen-containing oxide.
the more thoroughly studied borate buffer system[64]. For Fe in pH 7, 1 M [acetate], the arrest structure could be divided into two regions for oxide films formed potentiostatically in the passive region. The first arrest region, referred to as
Q,
,
was concluded to result from an Fe,O, (or Fe”‘-containing) oxide,while the second arrest region, with cathodic charge,
zyxwvutsrqponmlkjihgfedcbaZYXWVUTSRQPONMLKJIHGFEDCBA
Q29
corresponded to reduction of Fe,O, or someother Fen-containing oxide. Both arrests are present for thick passive films, indicating that the oxide consists of two distinct phases. In the present work, this technique was used to characterize the film formed on the Fe surface during the linear potential sweep.
Figure 8a shows the anodic sweep result for pH 7, 1 M [acetate] at 5 mV s-i. Figure 8b shows the cathodic charges in the first and second arrests as a function of the potential at which the anodic sweep was interrupted and galvanostatic cathodic charging at 20j~Actr-* begun. It can be seen that as the anodic current rises in the Tafel region of peak A, an arrest corresponding to an Fe”-containing oxide (Q2) begins to appear, and grows in magnitude through peak A. After the current has decreased in the transition to passivity, the arrest corresponding to the Fe”‘-containing oxide (Q,) appears, and increases steadily with potential. There is a maximum in Q2 during peak B. However, care must be taken in the interpretation of the results for Q2 in this region, since the large amounts of dissolved Fe*+ in the vicinity of the electrode surface may also be reduced in the galvanostatic procedure, and may contribute to the magnitude of Q2.
DISCUSSION
(i) interpretation of the reaction orders in peaks A and B
In buffer solutions such as acetate, one could postulate that the anodic dissolution reaction could depend on any of three solution species: OH-, A- and HA. The results shown above clearly indicate that both OH- and either A- and/or HA participate in the reaction mechanism. It would be of consider- able interest to determine whether A- or HA is the active participant. Normally, this question would be addressed, for example, by holding both [OH-] and [A-] constant, and varying [HA]. However, in buffer solutions, it is not possible to do this, as [HA] is not an independent variable under these conditions. Therefore, in the results above, the apparent reaction order with respect to pH and to total acetate concen- tration, which are the readily observable parameters, were calculated. Nevertheless, it is instructive to consider what the reaction orders would be if A- or HA was the active participant in the reaction mechanism:
At pH > 6, [HA] is small, and 10epH 4 K,, thus [HA] x 10-p” [acetate]/&, while
[A-] R [acetate].
Thus an observed reaction order of -0.7 + 0.2 with respect to [acetate] implies the following three possibilities: (1) -0.7 is the reaction order with
482 K. TAKMMHI et ui.
respect
to
[A-l, (2)
-0.7 is the reaction order with respect to [HA], or (3) -0.7 is the sum of the reaction orders with respect to [HA] and with respect to [A-]. For constant [acetate], the observed reaction order with respect to pH is 1.4 It 0.2. In this case, [HA] varies exponentially with pH, accord- ing to the equation above, while [A-] is approxi- mately independent of PH. Thus, if possibility (1) is correct, then the relevant reaction orders are 1.4 with respect to pH and -0.7 with respect to [A-], while if possibility (2) is correct, then the reaction orders are -0.7 + 1.4 = 0.7 (by addition of the expo- nents) with respect to pH and -0.7 with respect to [HA]. Therefore, it is clear that the reaction order with respect to pH depends on which of A- or HA is the active participant in the anodic dissolution reaction.(ii) Reaction mechanism
used in this work. The approach is an expansion of that used by El Miligy
et a1.[65],
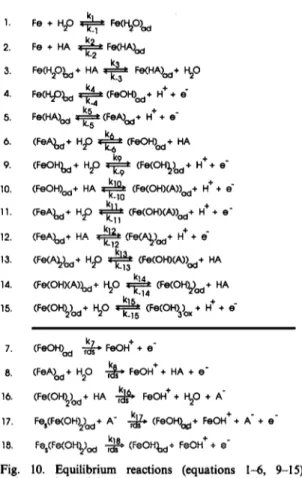
however it has been made much more general by allowing for the surface adsorption of numerous types of aatate-containing species as well as hydroxyl-contahmtg species. In simple terms, the model proposed here accounts for the effect of [acetate] on the experimental results by postulating that there is competitive formation between acetate-containing adsorbed species such as (FeA), and the corresponding hydroxyl-containing species. Passivation is assumed to be conferred by a Fe(OH),-oxide phase, which can be formed only by oxidation of pe(OH),],. The various equilibria considered in the mechanism are shown schematically in Fig. 9. The arrows indicating equilibria have a large arrow in the direction which the equilibrium would be shifted for large values of K, the equilibrium constant. A complete listing of the reactions con- sidered in the model is shown in Fig. 10.The mechanism presented below was designed to The first step is the adsorption of Hz0 or HA in qualitatively model the experimental anodic volt- the undissociated form on the Fe surface. Within the
ammograms over the wide range of [acetate] and pH framework of the reaction scheme shown in Fig. 9, it
zyxwvutsrqponmlkjihgfedcbaZYXWVUTSRQPONMLKJIHGFEDCBA
K
zyxwvutsrqponmlkjihgfedcbaZYXWVUTSRQPONMLKJIHGFEDCBA
Fe O H+
Fig. 9. A schematic of the equilibria considered in the proposed reaction mechanism. The species
considered are enclosed in boxes, and are assigned a surface coverage &,
i = 1 t?
8. The arrowszyxwvutsrqponmlkjihgfedcbaZYXWVUTSRQPONMLKJIHGFEDCBA
connecting the boxes refer to the equilibria which are assumed to exist betworn the various species. The larger arrowindicates the direction in which the reaction would be &iRed for a large value of the equilibrium constant, R,, i = 1 to 6. 9 to 15.
Dissolution and passivation of iron-1 483
zyxwvutsrqponmlkjihgfedcbaZYXWVUTSRQPONMLKJIHGFEDCBA
2. 3. 4. 5. 6. 9. 10. 11. 12. 13. 14. 15. Fe + HA * Fe (HA& Fe (H20&,+ HA + Fe (HA&+ 50Fe w,&, + (Fe O H&+ H+ + 6 - 4
Fe (HA&_, a +$ (FM&,+ H+ + e m
(Fe A.&,+ HP + (Fe O H&+ HA (Fe O H& + H20 ? + (Fe (O H& + H+ + e m
(Fe O H&+ HA +j$ (Fe (O H)(A))d+ H+ + e -
(Fe A&,+ Hp + (Fe (O HXANd+ H+ + e -
(Fe A&,+ HA + $ (Fe (A)_,&+ H’ + 6
Ve VQ &d+ HP * Ve (O HMDd+ HA
(Fe (O HXA))o d+ 30 T$ Ve (O H&+ HA
h5 +
(Fe (O HI&+ 30 .k_15 (Fe (O H)3)o x + H + i
7. (Fe O H& & Fe O H+ + e -
8. (Fe A& + HP0 & Fe O H+ + HA + e s
16. (Fe (O H&,+ HA +j$ Fe O H+ + t$O + A -
17. Fe &Fe (O H)&+ A - - &+ (Fe O H&,+ Fe O H+ + A - + e ’
18. Fe &Fe (O Hyd $ (Fe O H&+ Fe O H+ + e ‘
Fig. 10. Equilibrium reactions (equations I-6, 9-15) and rate determining steps (rds, equations 7, 8, 16-18) considered in the proposed mechanism, shown schematic- ally in Fig. 6. Fe, represents an iron atom in the metallic
substrate. The equilibrium constant K, is given by k,/k_, for
zyxwvutsrqponmlkjihgfedcbaZYXWVUTSRQPONMLKJIHGFEDCBA
i = l-6, 9-15.
is difficult to obtain an apparent reaction order y,, rn of greater than unity if the first step was postulated to be. the adsorption of A- on the Fe surface. The experimental value of y,,,, is 1.4 f 0.2, thus the adsorption of HA was chosen for the first step. This approach was also supported by recent FT-ir work on Pt and Au which indicates that the undissociated acetic acid is the species adsorbed on these surfaces, even at neutral pH [66-681.
For all of the other equilibria where HA or A- is required as a reactant, ie reactions 6, 10, 12, 13 and 14, the model has been formulated so that the undissociated acetic acid is the formal reactant. How- ever, it should be noted that this distinction will not change the outcome of any simulation; if A- was chosen as the reactant, then the equilibrium constant in that case would be the same as the equilibrium constant in the case of HA being the reactant, but divided by a factor of &. It is also apparent that use of the model does not require one to distinguish between the various possibilities for the exact reac- tion orders with respect to [A-], [OH-] and [HA] as discussed in the section above. Since the equilibria between these three species are incorporated into the equations of the model, the results of a simulation are the experimentally observable quantities of the appar- ent reaction orders with respect to pH and [acetate]. The initial steps in the model for the hydroxyl- containing species correspond to the consecutive
mechanism[4,2 1,651, and analogous reactions were chosen for the acetate-containing species. This approach was taken because the Tafel slope in peak A was approximately 40mV/decade, and because the annealed and electropolished electrodes were expected to be free of cold work effects. In addition to the equilibria shown in Fig. 9, six additional reactions are chosen as rate determining steps (rds). They are listed at the bottom of Fig. 10. Reactions 7 and 17 are identical to those chosen by El Miligy et a1.[65], while reaction 16 is accelerated by HA instead of by A- as chosen by those authors. The addition of reaction 18 was necessary in order to provide a satisfactory fit to the experimental data. In reactions 17 and 18, Fe, represents an iron atom in the metallic substrate. As discussed by El Miligy et a1.[65], such reactions are needed to produce the extra anodically-driven dissolution path which becomes important in peak B.
Of course, not all of the equilibria in Fig. 9 need result in substantial amounts of coverage by a specific species. For example, it is possible to obtain &, x 0
by chasing
zyxwvutsrqponmlkjihgfedcbaZYXWVUTSRQPONMLKJIHGFEDCBA
K,, % - K,2, with K,3 large. Similarly, it can be easily seen that not all equilibrium constantsare independent. For example, K, = KJK,&. The
constants K,, K4, K,, Ksr 6, Klo, K12 and
zyxwvutsrqponmlkjihgfedcbaZYXWVUTSRQPONMLKJIHGFEDCBA
K ,, were chosen as the independent parameters for modellingpurposes, while the other equilibrium constants were then fixed by the values of the independent parameters.
Some conclusions can be drawn from inspection of the reaction model. Since there are complex equilibria controlling the converages of the various species, it is not possible to quantitatively predict the coverages of two linked species by consideration of that single equilibrium reaction alone, since a shift in any one equilibrium resulting from a change in [acetate] or pH will result in coverages other than those directly linked by that specific equilibrium constant. Never- theless, the relative coverages of two linked species will be affected in the way that would be predicted by an examination of the single equilibrium reaction. The coverages of acetate-containing adsorbed species will be increased relative to those of hydroxyl- containing species as [acetate] is increased. For example, an increase in [acetate] will result in a relative decrease in the coverage or, compared to 0,. Since the currents from reactions 7 and 8 occur in the same potential region (as both involve the same number of electrons overall) a proper choice of K 6 , k ,
and k, (so that reaction 7 is dominant) will result in an overall negative reaction order with respect to [acetate].
Spreadsheet (Excel on a Macintosh computer) simulations of the above mechanism were performed. The procedure for writing down the kinetic equations followed that given by El Miligy ef a/.[65]. Langmuir isotherm conditions were assumed, and a charge- transfer coefficient a of 0.5, and a temperature T of 298 K, were used. Only two dimensional coverage was assumed, ie the sum of all coverages is unity. The potentials were converted from the hydrogen scale (in which the simulation was done) to the Hg/HgrSOJ 0.15 N Na,SO, scale by subtracting 0.661 V. The parameters were adjusted to give a reasonable corre- spondence (*40%) with the peak currents for pH between 5 and 7, and [acetate] between 0.1 and 2.5 M.
484 K. TAKAHASHI ef al.
zyxwvutsrqponmlkjihgfedcbaZYXWVUTSRQPONMLKJIHGFEDCBA
-1.4 -1.2 -1.0 -0.8 -0.6 -0.4
E (V vs. Hg/Hg204)
Fig. 11. Simulated anodic sweep voltammograms for Fe in pH 6 solution with [acetate] = 1 M and 0.1 M. The constants
shown in Table 2 were used in the simulation.
In addition, the parameters were adjusted to give an appropriate appearance to the relative postitions of the curves for 1 M and 0.1 M, pH 6 and for 1 M, pH 6 and pH 5 pairs as shown in Figs 2 and 4. The corresponding simulated data are shown in Figs 11 and 12, and the values of the rate and equilibrium constants used in the simulation are given in Table 2. Clearly, this procedure will not result in an optimum fit to the data, such as would be obtained from a non-linear least squares analysis, but as the objective was to obtain a semi-quantitative fit to the data, such analysis was not attempted. For reasons which will be explained below, the model is also capable of further refinement to better fit the data. It is recognized that because of the limitations of the experimental data (as described above), particularly the quasi steady-state
-1.4 -1.2 -1.0 -0.8 -0.6 -0.4
E (V vs. HglHg20J
Fig. 12. Simulated anodic sweep voltammograms for Fe in pH 6 and pH 5 solution with [acetate] = 1 M. The constants
shown in Table 2 were used in the simulation.
F.
5
6
i
i
PH
Fig. 13. Simulated values of j+ for peak A, extrapolated to a constant potential of - 1.2 V, as a function of pH for [acetate] = 1 M and 0.1 M. The constants shown in Table 2
were used in the simulation.
approximation, the individual values of the rate and equilibrium constants are not expected to have any quantitative meaning. Moreover, because of the large number of kinetic parameters, compared .to the experimental parameters, it is likely that an equally good fit to the data could have been obtained with a quite different set of values for the model parameters. Thus, no interpretation of the model parameters will be made. Nevertheless, it is believed that the cover- ages, t$, calculated using the model, have some semi-quantitative meaning and can be used to predict trends in the data with respect to solution parameters such as [acetate] and pH.
Shown in Table 1 are the values of the kinetic parameters obtained with the constants of Table 2. Although these parameters could, in theory, be calculated from partial differentiation of the derived equations, such an approach is very time consuming in practice. Therefore, the parameters were obtained from a series of simulated curves under various conditions. It can be seen that there is rather good agreement between the simulated and experimental data. Most importantly, the experimental reaction orders with respect to pH and [acetate] are very well reproduced by the model as seen by comparing the simulation in Fig. 13 with the data in Fig. 7a. In contrast to the model proposed by Beth-Nielsen [23,54-57,691, the model used in the present simula- tion provides a simple physical explanation for the observed dependencies of the reaction order with respect to solution species. The model easily accounts for non-unit reaction orders and could also describe the data of Beth-Nielsen.
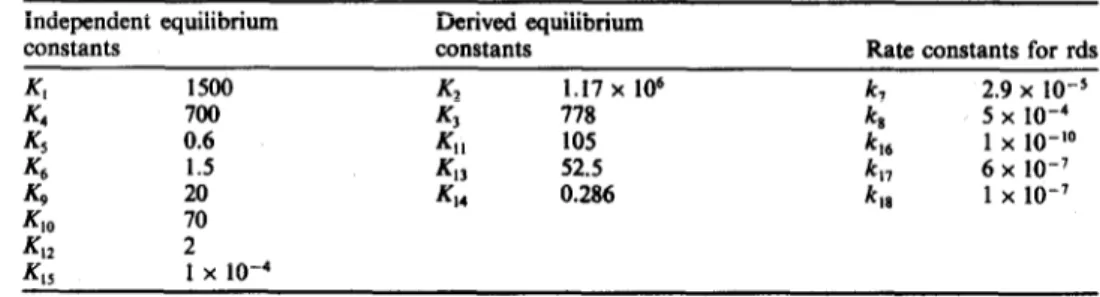
Table 2. Values of the rate and equilibrium constants used in the simulation using the model illustrated in Figs 9 and 10
Independent equilibrium Derived equilibrium
constants constants Kate constants for rds
Kl 1500 K2 1.17 x 10⁶ 4 2.9 x lo-5 K4 700 4 778 5 X 10⁻⁴ 5 0.6 4, 105 t6 1 x lo-‘0 K6 1.5 43 52.5 k 17 6 x lo-’ K9 20 44 0.286 k 18 1 x lo-’ 40 70 42 2 K.. I x 10-4
Dissolution and passivation of iron-1 485
“0
o
o
0i
5 6 7 a
PH
Fig. 14. The maximum current, jP, at peaks A and B as a function of pH for [acetate] = 1 M and 0.1 M solution, as calculated from the model using the constants given in
Table 2.
Figure 14 shows simulated values of&,, andjpV8 for [acetate] = 1 M and 0.1 M as a function of pH. The corresponding experimental data is shown in Fig. 5. As can be seen, there is quite good agreement between the two figures, particularly with regard to the trends of jr. Overall, it is clear that the model provides a good, semi-quantitative fit to the data, and repro- duces most of the experimental kinetic parameters. The only portion of the experimental curves which are not reasonably well represented by the present model is the transition between peak B and the onset of passivation. The experimentally observed transi- tion is much steeper than that in the model, and the model fails to reproduce the dependence on [acetate]
in this region. Consequently, the results for Er,s
zyxwvutsrqponmlkjihgfedcbaZYXWVUTSRQPONMLKJIHGFEDCBA
-1 A
zyxwvutsrqponmlkjihgfedcbaZYXWVUTSRQPONMLKJIHGFEDCBA
-1.2 -1.0 -0.8 -0.6 -0.4-1.4 -1.2 -1 .o -0.8 -0.6 -0.4 E (V vs. Hg/Hg>S$)
Fig. 15. The surface coverages, f?,, i = 1 to 8, calculated from
zyxwvutsrqponmlkjihgfedcbaZYXWVUTSRQPONMLKJIHGFEDCBA
the model for (a) pH 6, [acetate] = 1 M, and (b) pH 6, [acetate] = 0.1 M. t& is negligible for all 5 C pH Q 7 and 0.1 C [acetate] 6 2.5 M. The constants shown in Table 2
were used in simulation.
are not particularly good. At least two reasons are apparent for this discrepancy. First, as discussed by El Miligy et aL[65], the equilibrium represented by I& may not be a good description of the passivation process. These authors suggest several other sub-steps to replace the equilibrium K,,, which result in a more abrupt transition between peak B and the passive region. A second explanation of the discrepancy follows from experimental results which will be discussed below.
The coverages of the various species as a function of potential, calculated from the model for pH 6, 1 M and 0.1 M solutions are shown in Fig. 15. The coverage of Fe0 species (0, and 6,) begins to decrease immediately with increasing potential. Coverage with Fe’ species (0, and 6,) then increases, goes through a maximum and then decreases, to be replaced by coverage with Fe” species (0, and 0,). Finally, the Fe” species are replaced by the oxide phase (Fe”‘, e,), the coverage of which increases to unity. As would be expected, the relative coverage with species which include adsorbed acetate (e,, 6, and 6,) increases with increasing [acetate], compared to the coverage by species which contain no acetate (t?, , OS, and 0,). The coverage OS was negligible for all pHs and [acetate] for the values of the constants used. No assumption was made about the surface coverage of bare Fe, but it turned out to be negligible in the potential region of interest.
Experimental determination of some of the surface coverages could, in principle, be made using the galvanostatic cathodic reduction procedure illustrated in Fig. 8. Unfortunately, it is difficult to quantify the exact coverages corresponding to the quantities of cathodic charge because the reduction efficiency for an oxide such as Fe(OH), in acetate solution is not known. Nevertheless, it is apparent that there is a strong correlation between Qz and the coverage e5 (or 0,) and between Q, and the coverage 0,. These results
provide direct, in
zyxwvutsrqponmlkjihgfedcbaZYXWVUTSRQPONMLKJIHGFEDCBA
situ electrochemical evidence for the coverage of the surface by a Fe”-containing oxideduring the active dissolution in peak A, and thus provide support for the proposed model. The striking difference between the model calculation and the experimental results is that Q2 does not decrease as Q, increases, in other words, experimentally, the Fe”‘-containing oxide is formed on top of the Fe”- containing oxide, rather than replacing the lower oxide. This illustrates an important limitation of the model; the maximum coverage is assumed to be unity, thus, the model cannot account for a true phase oxide. Therefore, it is not expected that the model will satisfactorily describe the transition between peak B and passivation.
SUMMARY
Potential sweep experiments, coupled with galvano- static cathodic reduction, have been used to study the kinetics of the dissolution and passivation of Fe in acetate solutions. Results similar to those obtained previously by Beth-Nielsen were obtained for the various kinetic parameters, although results from this study were obtained at a greater range of pH and concentration. A significant difference was the
486 K. Tm et al. observation of a non-unit reaction order of 1.4 f 0.2
with respect to pH in the Tafel region of the lirst anodic peak. A negative reaction order with respect to the total acetate concentration was found in the same region. A mechanism was proposed which accounts for these reaction orders, and provides a semi-quantitative fit to the experimental data. The tirst steps were postulated to be the adsorption of undissociated acetic acid and water on the Fe surface. The negative reaction order with respect to total acetate concentration arises from a competitive formation between (FeA), and (FeOH),. It is this (FeOH), intermediate which is the reactant in the dominant rate-determining step in the Tafel region of the first anodic peak. In other words, the acetate must be desorbed from the surface in order to yield anodic current in the Tafel region of peak A. The requirement for this desorption results in the negative reaction order. 1. 2. 3. 4. 5. 6. 7. 8. 9. 10. II. 12. 13. 14. 15. REFERENCES
J. O’M. Bockris, D. Drazic and A. R. Despic, Efectro-
chim. Actu 4, 325 (1961).
J. GM. Bockris and D. Drazic, Electrochim. Acta 7,293 (1962).
I. Epelboin and M. Keddam, J. efectrochem. Sot. 117,
1052 (1970).
D. Geana, A. A. El Miligy and W. J. Lorenz, Corros.
Sci. 13, 505 (1973); 14, 657 (1974).
S. Asakura and K. Nobe, J. efecrrochem. Sot. 118, 13, 19 and 536 (1971).
J. Bessone, L. Karakaya, P. Lorbeer and W. J. Lorenz,
Electrochim. Acta 22,-l 147 (1977).
P. Doie and P. E. J. Flewitt. Corros. Sci. 17.369 0977). M. Erbil and W. J. Lore&, Werkst. Korios. i9, Sd5
(1978).
R. S. S. Guzmln, J. R. Vilche and A. J. Arvia,
Elecbochim. Acta 24, 395 (1979).
P. Lorbeer and W. -J. L&enz,~ Corros. Sci. 20, 405 (1980): Electrochim. Acra 25. 375 119801.
D. M:‘Drazic and C. S. Hao, ‘Electr~ch&. Acta 27, 1409
(1982).
H. Bala, Electrochim. Acta 29, 119 (1984).
D. R. MacFarlane and S. I. Smedlev, J. electrochem. _.
Sot. 133, 2240 (1986).
E. B. Castro. S. G. Real. R. H. Milocco and J. R. Vilche, Elect&him. Acta &, 117 (1991).
G. M. Florianovich, L. A. Sokolova and Ya. M. Kolotyrkin, Electrochim. Acto 12, 879 (1967). 16. G. Eichkorn, W. J. Lorenz, L. Albert and H. Fischer,
Elecbochim. Acta 13, 183 (1968).
17. K. Schwabe, H. D. Zushke and M. Time, Zushch.
Metal. 10, 491 (1974).
18. K. E. Heusler, Z. Elektrochem. 62, 582 (1958).
19. W. Allaaier and K. E. Heusler. Z. Phvs. Chcm. WI. 161 (1975)._
20. B. Folleher and K. E. Heusler, J. electroanal. Chem. 180, 77 (1984).
21. F. Hilbert, Y.’ Miyoshi, G. Eichkom and W. J. Lorenz, J. electrochem. Sot. 118, 1919, 1927 (1971).
22. V. H. Rosswag, G. Eiihkom and W. J. Lorenz, Werskt.
Korros. 25, 86 (1974).
23. G. Beth-Nielsen, Electrochim. Acto 19, 821 (1974); 20, 619 (1975).
24. H. Worth and W. Forker, Electrochim. Acta 35, 163 (1990).
25. C. Voigt, EIectrochim. Acta 13, 2037 (1968).
27. 28. 29. 30. 31. 32. 33. 34. 35. 36. 37. 38. 39. 40. 41. 42. 43. 44. 45. 46. 47. 48. 49. 50. 51. 52. 53.
G. J. Bignold and M. Fleisehmann, Electrochim. Actu 19, 363 (1974).
I. Epelboin, C. Gabrielli, M. Keddam and H. Takenouti, Electrochim. Acta 20, 913 (1975). B. Bechet, I. Epelboin and M. Keddam, J. ekctroanal.
Chem. 76, 129 (1977).
H. Sehweickert, W. J. Lorenz and H. Friedburg,
J. electrochem. Sot. 127, 1693 (1980).
M. Keddam, 0. R. Mattos and H. Takenouti,
J. efectrochcm. Sot. 128, 257, 266 (1981).
K. E. Heusler and L. Fischer. Werkst. Korros. 2% 697 (1976).
K. Ogura and T. Majima, Elecrrochim. Acru 23, 1361 (1978).
M. A. Morsi, Y. A. Elewady, P. Lorbeer and W. J. Lorenz, Werkst. Korros. 31, 108 (1980).
F. Mansfeld, M. W. Kendig and S. Tsai, Corros. Sci. 22, 455 (1982).
G. T. Burstein and G. W. Ashley, Corrosion 39, 241
(1983).
R. D. Armstrong and I. Baurhoo, J. electroanal. Chem. 34, 41 (1972); 4& 325 (1972).
D. D. MacDonald and D. Gwen. J. efectrochem. Sot. 120, 317 (1973).
D. D. MacDonald and B. Roberts, Electrochim. Acfa
23, 557, 781 (1978).
L. D. Burke and M. E. G. Lyons, J. electroanal. Chem. 198, 347 (1986).
C. Chanson, P. Blanchard, A. Wattiaux and J.-C. Grenier, J. electrochem. Sot. 136, 3690 (1989). J. Wilinski, J. Flis and P. Kedzierzawski, Br. Corros. J.
u, 184 (1990).
E. McCalTerty and N. Haokertnan, J. electrochem. Sot. 119, 999 (1972).
N. A. Darwish, F. Hilbert, W. J. Lorenz and H. Rosswag, Electrochim. Acra 18, 421 (1973).
H. C. Kuo and K. Nobe, J. electrochem. Sot. 125,853 (1978).
M. Mogensen, G. Beeh-Nielsen and E. Maahn, Electro-
chim. Acra 25, 919 (1980).
J. G. N. Thomas, T. J. Nurse and R. Walker, Br. Corros. J. 5, 87 (1970).
D. W. Shoesmith, P. Taylor, M. G. Bailey and B. Ike&
Electrochim. Acra, 23, 903 (1978). _
V. S. Muralidharan and K. S. Raioaoualan. Electro- - - - ’
chim. Acra 23, 1297 (1978).
G. T. Burstein and D. H. Davies, Corros. Sci. 20, 1143 (1980).
Z. A. Foroulis, Werkst. Korros. 31, 463 (1980). A. Frignani, M. Tassinari and G. Trabanelli, Electro-
chim. Acru 34. 1259 (1989).
0. E. Bareia and 0. ‘R. Mattos, Electrochim. Acta 35,
1003 (1990).
54. K. A. Christiansen, H. Hseg, K. Michelsen, G. Beth-Nielsen and H. Nord, Acta Chem. Stand. 15,300 (1961).
55. H. Nord, C. E. Foverskov and G. Beth-Nielsen,
Actu Chem. Scund. 18, 681 (1964).
56. H. Nord and G. Beth-Nielsen, Electrochim. Acra 16, 849 (1971).
57. G. Beth-Nielsen, Electrochim. Acta 23, 425 (1978).
58. J. A. Bardwell, B. MaeDougall and M. J. Graham,
J. electrochem. Sot. 135, 413 (1988).
59. C. M. Ran@, I. T. Fonseca and R. A. Leinio,
Electrochim. Acra 31, 1659 (1986).
60. C. M. Rangel, R. A. Leit80 and I. T. Fonseca.
Electrochim. Acta 34, 255 (1989).
61. E. B. Castro, J. R. Vilche and A. J. Arvia, Corros. Sci. 35 37 (1991).
62. M. E. Vela, J. R. Vilche and A. J. Arvia, J. appl.
Ebxtrochem. 16, 490 (1986).
26. G. Be&-Nielsen, Hectrochim. Acta 18; 671.(1973); 27, 63. A. Hugot-Le doff, J. I%, N. Boueherit. S. Joiret 1383 (1982). and J. Wilinski, J. electrochem. Sot. 137, 2684 (1990).
Dissolution and passivation of iron-1 481 64. K. Takahashi, B. MacDougall and M. J. Graham, 67. D. S. Corrigan, E. K. Krauskopf, L. M. Rice, A. J. electrochem. Sot. 137, 3023 (1990). Wicckowski and M. J. Weaver, J. phys. Chem. 92, 1596 65. A. A. El Miligy, D. Gcana and W. J. Lorenz, Electro- (1988).
chim. Acta 20, 213 (1975). 68. E. K. Krauskopf and A. Wicckowski, J. electroanal.
66. A. Wicckowski, J. Sobkowski, P. Zelenay and K. Gem. 271, 295 (1989).
Franaszczuk, Electrochim. Acra 26, 1 I1 1 (1981). 69. G. Beth-Nielsen, Electrochim. Acta 21, 627 (1976).
![Fig. 1. Anodic sweep vokammograms for Fe at 5 mV s-l in pH 7 solution with [acetate] = 1 M and 0.1 M: Peak A’](https://thumb-eu.123doks.com/thumbv2/123doknet/14252066.488324/3.819.103.395.836.1032/fig-anodic-sweep-vokammograms-fe-solution-acetate-peak.webp)
![Fig. 6. The Tafel slopes for peaks A and B as a function of pH for [acetate] = 1 M and 0.1 M](https://thumb-eu.123doks.com/thumbv2/123doknet/14252066.488324/4.840.120.718.880.1083/fig-tafel-slopes-peaks-b-function-ph-acetate.webp)
![Fig. 7. (a) The relationship between j+ for peak A, extrapolated to a constant potential of - 1.2 V, and pH for [acetate] = 1 M and 0.1 M](https://thumb-eu.123doks.com/thumbv2/123doknet/14252066.488324/5.817.104.714.92.323/fig-relationship-peak-extrapolated-constant-potential-v-acetate.webp)

![Fig. 14. The maximum current, jP, at peaks A and B as a function of pH for [acetate] = 1 M and 0.1 M solution, as calculated from the model using the constants given in](https://thumb-eu.123doks.com/thumbv2/123doknet/14252066.488324/10.834.97.390.110.305/maximum-current-peaks-function-acetate-solution-calculated-constants.webp)
