Publisher’s version / Version de l'éditeur:
Vous avez des questions? Nous pouvons vous aider. Pour communiquer directement avec un auteur, consultez la première page de la revue dans laquelle son article a été publié afin de trouver ses coordonnées. Si vous n’arrivez pas à les repérer, communiquez avec nous à [email protected]. Questions? Contact the NRC Publications Archive team at
[email protected]. If you wish to email the authors directly, please see the first page of the publication for their contact information.
https://publications-cnrc.canada.ca/fra/droits
L’accès à ce site Web et l’utilisation de son contenu sont assujettis aux conditions présentées dans le site LISEZ CES CONDITIONS ATTENTIVEMENT AVANT D’UTILISER CE SITE WEB.
7th Canadian Marine Hydromechanics and Structures Conference
[Proceedings], 2005
READ THESE TERMS AND CONDITIONS CAREFULLY BEFORE USING THIS WEBSITE.
https://nrc-publications.canada.ca/eng/copyright
NRC Publications Archive Record / Notice des Archives des publications du CNRC :
https://nrc-publications.canada.ca/eng/view/object/?id=3a49f260-0dc3-43c4-995c-7ea13db0930b
https://publications-cnrc.canada.ca/fra/voir/objet/?id=3a49f260-0dc3-43c4-995c-7ea13db0930b
NRC Publications Archive
Archives des publications du CNRC
This publication could be one of several versions: author’s original, accepted manuscript or the publisher’s version. / La version de cette publication peut être l’une des suivantes : la version prépublication de l’auteur, la version acceptée du manuscrit ou la version de l’éditeur.
Access and use of this website and the material on it are subject to the Terms and Conditions set forth at
Developing a numerical tool to predict crew safety related parameters
for fishing vessels
Developing a Numerical Tool to Predict Crew Safety
Related Parameters for Fishing Vessels
D. Bass
1, J. Vera
1, D. Cumming
2, and A. Akinturk
21Faculty of Engineering and Applied Science, Memorial University of Newfoundland
St. John’s, NL, A1B 3X5, Canada
2Institute for Ocean Technology, National Research Council Canada
St. John’s, NL, A1B 3T5, Canada
Email: [email protected]
A
BSTRACTIn the last three years, the Institute for Ocean Technology (IOT) and Memorial University of Newfoundland (MUN) have joined together to establish motion profiles of the Newfoundland fishing fleet. Eventually, the objective is to develop and validate a numerical tool, called MOTSIM that will be used to evaluate the number of Motion Induced Interrupts (MIIs), or any other similar parameter, and their impact on crew safety. So far, this involved conducting sea trials of representative vessels of the fleet and corresponding model tests in the wave basin for the smallest of them. In parallel, MOTSIM has been further developed and validated using the full scale and experimental results. This paper discusses numerical challenges encountered in simulating these trials and the model test, and reviews the methods developed to overcome these challenges. Comparisons between the numerical simulations and the full scale trials are presented. The simulations are also compared with the model tests results. Based on the results of this study, the numerical simulations seem to correlate reasonably well with the trials and the experiments. Sample MII values for some fishing vessels are also presented. Keywords: crew comfort, seakeeping trials, fishing vessels, motion simulations
1. I
NTRODUCTIONBeing a part of an umbrella initiative called SafetyNet [1] , whose aim is to understand and mitigate the health and safety risks associated with employment in a marine environment, the aim of this study is to develop and validate a numerical ship motions prediction tool with the eventual intention of
using it to assess the physical stress levels associated with the vessel motions on board of fishing vessels. Fishing is the most dangerous occupation in Newfoundland and Labrador and is increasingly so: over the past decades, the rates of reported injuries and fatalities nearly doubled. These trends have the effect of reducing the sustainability of the fishery, increasing health care and compensation costs, and straining the available search and rescue resources. Hence, the tool developed in this study can help to improve working conditions on board of fishing vessels.
In order to achieve this objective, a number of sea trials have been conducted to establish the motion profiles for the fishing fleet of Newfoundland and Labrador. As a next step, possible correlations between motion levels and the physical/motion stress levels will be investigated based on the Motion Induced Interruptions criteria ([2] ,[3] ,[4] , and [5] ). The final objective is to develop means to reduce critical motions of fishing vessels from a vessel design and operational point of view.
In this paper, the results of the correlation study between MOTSIM (a motion simulation program [13]) and the sea trials are presented.
2. S
EAT
RIALSThe vessels used in the trials and their lengths are: M/V Louis M. Lauzier (39.6m); CCGS Shamook (22.9m); CCGA Miss Jacqueline (19.8m); CCGA Nautical Twilight (13.7m) and CCGA Atlantic Swell (10.7m). The last three were the vessels selected from Canadian Coast Guard Auxiliary Fleet of fishing vessels. M/V Louis M. Lauzier, on the other hand, was the training vessel used by Memorial University of Newfoundland and is included to illustrate that
some of the difficulties encountered in predicting the motions of the fishing vessels may be related to the size of the vessels.
The target sea conditions would typically range from sea state 2 to 4. Sea trials were carried out nominally 10 nm east of St. John’s.
A more detailed description of the vessels and the instrumentation used in their trials are given in [6] through [12].
3. S
IMULATIONS OFM
OTIONSO
BSERVED INS
EAT
RIALSIn this section we describe some of the results of the simulations of motions of the five vessels. In all five sea trials involving these vessels, the seas were complex and multi-directional, making the task of representing the sea states in the numerical simulations particularly difficult. For example
identifying what was head seas proved to be no easy task. For smaller vessels the complexity of the sea state probably has more effect on the motions. The larger vessels effectively filter out some higher frequency or lower amplitude waves and possibly only respond to certain waves in certain directions. Motions simulations were run in MOTSIM, a non-linear time domain code based on a panel method [13]. The code has been modified to output MII values along with the six degrees of freedom motion data.
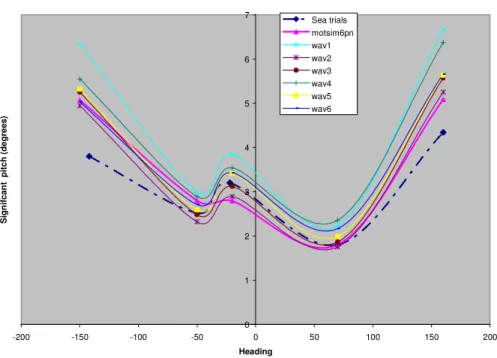
Generally the better predicted motions are pitch and surge acceleration. These are shown below for the 5 vessels. The speed of the vessels was the lower one used in the trials. For the 39.6m vessel it was 6 kt and the rest 4 kt.
Figure 1. Pitch motions for the Lauzier ; Sea Trials, Tank Tests and Simulations.
Pitch for November Trials at 6 kts, Comparisons with Experiments and MOTSIM with Changing Wave Conditions..
0 1 2 3 4 5 6 -40 -20 0 20 40 60 80 100 120 140 160 180 Heading (degrees) Pit ch (d eg re es ) SeaTrial experiment motsim, buoy data 12pm wave 1230pm wave 1300 pm wave 1330 pm wave 1400 pm wave
Figure 2. Surge accelerations for the Lauzier; tank tests, sea trials and simulations
Figure 3. Pitch motions for the Shamook; sea trials and simulations
Surge Acceleration for Lauzier Trials at 6 kts, Comparisons with Experiments and MOTSIM with Changing Wave Conditions
0.000 0.100 0.200 0.300 0.400 0.500 0.600 0.700 0.800 0.900 1.000 -40 -20 0 20 40 60 80 100 120 140 160 180 Heading (degrees) S u rg e a c c e le ra ti o n ( m /s /s ) SeaTrial
motsim, buoy data experiment 12pm wave 1230pm wave 1300 pm wave 1330 pm wave 1400 pm wave
Pitch for the Shamook Trials at 4 kt
0 1 2 3 4 5 6 7 -200 -150 -100 -50 0 50 100 150 200 Heading S ig n if c a n t p it c h ( d e g re e s ) Sea trials motsim6pn wav1 wav2 wav3 wav4 wav5 wav6
Figure 4. Surge Accelerations for the Shamook, Sea Trials and Simulations.
Figure 5. Pitch Motions for Miss Jacqueline; Sea Trials and Simulations.
Pitch for Miss Jacqueline at 4 Knots (Neptune Data)
0 0.5 1 1.5 2 2.5 3 3.5 4 4.5 -200 -150 -100 -50 0 50 100 150 Heading (degrees) S ig n if ic a n t P it c h ( d e g re e s ) sea trial motsim motsimdw motsim 730 motsim 800 motsim 830 motsim 900 motsim 930 motsim 1000 Surge Acceleration for the Shamook Trials at 4 kt
0 0.1 0.2 0.3 0.4 0.5 0.6 -200 -150 -100 -50 0 50 100 150 200 Heading S ig n if c a n t s u rg e a c c e le ra ti o n ( m /s /s ) Sea trials motsim6pn wav1 wav2 wav3 wav4 wav5 wav6
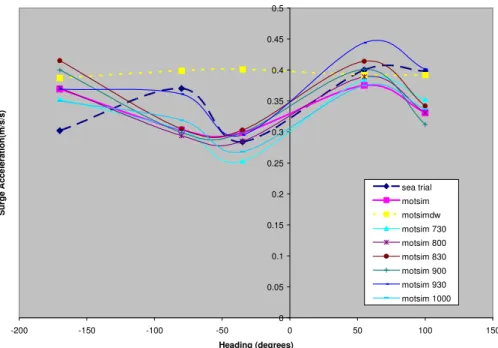
Figure 6. Surge Acceleration for Miss Jacqueline; Sea Trials and Simulations.
Figure 7. Pitch Motions for Nautical Twilight; Sea Trials and Simulations.
Surge Acceleration for Miss Jacqueline at 4 Knots (Neptune Data)
0 0.05 0.1 0.15 0.2 0.25 0.3 0.35 0.4 0.45 0.5 -200 -150 -100 -50 0 50 100 150 Heading (degrees) S u rg e A c c e le ra ti o n (m /s /s ) sea trial motsim motsimdw motsim 730 motsim 800 motsim 830 motsim 900 motsim 930 motsim 1000
Pitch for Nautical Twilight at 4 Knots (Neptune Wave Data)
0 1 2 3 4 5 6 7 8 9 -200 -150 -100 -50 0 50 100 150 Heading (degrees) S ig n if ic a n t P it c h ( d e g re e s ) sea trial motsim motsim dw motsim 900 motsim 1100 motsim 1200
Figure 8. Surge Acceleration for Nautical Twilight; Sea Trials and Simulations.
Figure 9. Pitch Motions for Atlantic Swell; Sea Trials, Tank Tests and Simulations.
Surge Acceleration for Nautical Twilight at 4 Knots (Neptune Wave Data)
0 0.1 0.2 0.3 0.4 0.5 0.6 0.7 0.8 -200 -150 -100 -50 0 50 100 150 Heading (degrees) S u rg e A c c e le ra ti o n (m /s /s ) sea trial motsim motsim dw motsim 900 motsim 1100 motsim 1200
Pitch for Atlantic Swell at 4 kt
0 1 2 3 4 5 6 7 -200 -150 -100 -50 0 50 100 150 200 heading (degrees) s ig n if ic a n t p it c h (d e g re e s ) sea trial motsim 830 800 900 730 930 1000 hrs experiment
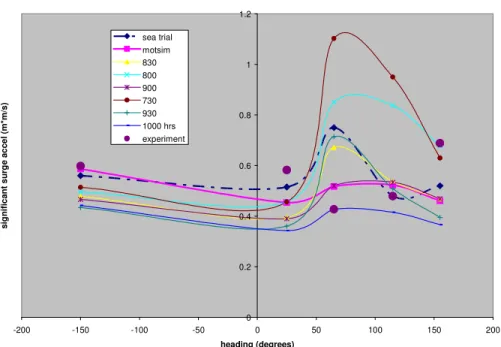
Figure 10. Surge Acceleration for Atlantic Swell; Sea Trials, Tank Tests and Simulations.
The above figures show the results of the simulations using the wave data recorded at the time of the particular sea trial (approximately). These are labeled ‘motsim’ in the legends. Other simulations were carried using one set of wave data for all the headings. The idea is to show the possible variation in results due to variations in the wave field representation. In fact in some cases it is clear that the wave field was also changing over the course of the sea trials (e.g. for the CCGA Atlantic Swell trials). There is a noticeable decrease in prediction accuracy as the vessels decrease in length. The significant wave heights ranged from around 3 m for the Lauzier to around 1.5 m for the Atlantic Swell, with the others somewhere between.
In two of the sea trials shown in this paper (CCGA Miss Jacqueline IV and CCGA Nautical Twilight.), wave data was collected from two different wave buoys – a small Neptune wave buoy [14] (30 kg) and a larger Datawell buoy (75 kg). In most of the simulations the Neptune data is shown. However there are simulations shown (labeled motsimdw) where the Datawell buoy data has been used. In some cases the results are very similar to the Neptune data and in others there are some clear differences. In general, the Neptune data based simulations appeared to give better agreement with the sea trial data. The reason for that is not clear.
The worst agreement of simulations with sea trial data came from yaw motions. These are shown below.
Surge Acceleration for Atlantic Swell at 4 kt
0 0.2 0.4 0.6 0.8 1 1.2 -200 -150 -100 -50 0 50 100 150 200 heading (degrees) s ig n if ic a n t s u rg e a c c e l (m *m /s ) sea trial motsim 830 800 900 730 930 1000 hrs experiment
Figure 11. Yaw Motions for Lauzier, Sea Trials, Tank Tests and Simulations
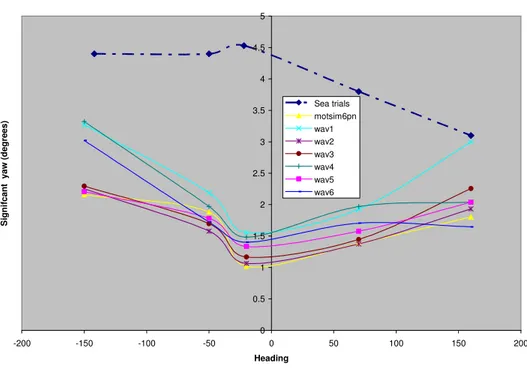
Figure 12. Yaw Motions for the Shamook; Sea Trials and Simulations (Datawell)
Yaw for November Trials at 6 kts, Comparisons with Experiments and MOTSIM with Changing Wave Conditions. 0 1 2 3 4 5 6 7 8 -40 -20 0 20 40 60 80 100 120 140 160 180 Heading (degrees) Y a w ( d e g re e s ) SeaTrial experiment motsim, buoy data 12pm wave 1230pm wave 1300 pm wave 1330 pm wave 1400 pm wave
Yaw for the Shamook Trials at 4 kt
0 0.5 1 1.5 2 2.5 3 3.5 4 4.5 5 -200 -150 -100 -50 0 50 100 150 200 Heading S ig n if c a n t y a w ( d e g re e s ) Sea trials motsim6pn wav1 wav2 wav3 wav4 wav5 wav6
Figure 13. Yaw Motions for Miss Jacqueline; Sea Trials and Simulations.
Figure 14. Yaw Motions for Nautical Twilight; Sea Trials and Simulations.
Yaw for Miss Jacqueline at 4 Knots (Neptune Data)
0 1 2 3 4 5 6 7 8 9 10 -200 -150 -100 -50 0 50 100 150 Heading (degrees) S ig n if ic a n t Y a w ( d e g re e s ) sea trial motsim motsimdw motsim 730 motsim 800 motsim 830 motsim 900 motsim 930 motsim 1000
Yaw for Nautical Twilight at 4 Knots (Neptune Wave Data)
0 1 2 3 4 5 6 7 8 9 -200 -150 -100 -50 0 50 100 150 Heading (degrees) S ig n if ic a n t Y a w ( d e g re e s ) sea trial motsim motsim dw motsim 900 motsim 1100 motsim 1200
Figure 15. Yaw Motions for Atlantic Swell; Sea Trials and Simulations.
Again there is a decrease in accuracy with decrease in boat length except in the case of the CCGS Shamook. The yaw motions here are not at all well predicted. This may be related to the fact that only the Datawell buoy data was available for these trials. The Datawell data gave worst yaw predictions in both the Miss J and Nautical T cases (Figures 13 and 14), although the differences are not really significant in the case of the Nautical T. It is also possible that the yaw motions of the Shamook are somewhat unusual due to the fact that the vessel was originally 65 feet and extended at the stern to give a 75 foot vessel. It should also be noted that the smallest of these vessels (Atlantic Swell) had no auto-pilot and the course set by the skipper seems to have been somewhat erratic. Possibly he was avoiding what he thought of as hazardous wave conditions.
4. D
ISCUSSIONIt is apparent from the above results that motions are not always well predicted especially for the smaller vessels. Space does not permit showing all the results. It is apparent however from the above
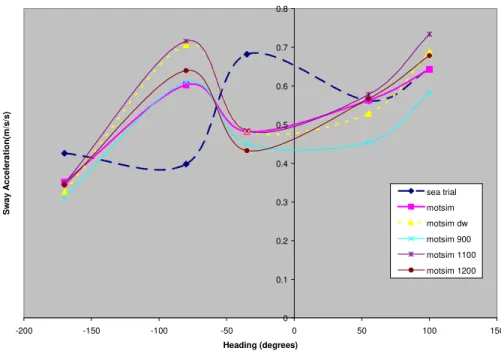
results and from those not shown that generally the correct range of values for each rotation or linear acceleration is predicted over the range of headings in the sea trials. For example in the case of surge acceleration for the Nautical Twilight (Figure 8), the range of surge acceleration in the sea trials is 0.4 to 0.7 m/s/s which is also the overall range of values predicted by MOTSIM in the simulations even though heading for heading the results appear quite poor. It’s worth pointing out that at the two headings which give poor agreement for surge acceleration, a similar poor agreement exists for both sway and heave acceleration (see Figure 16), although the simulated values again fall into the same range as those of the sea trials. It should be emphasized that there are some uncertainties over whether the data from the wave buoy(s) and its derived representation as a second order 2 parameter Fourier series represents the sea surface sufficiently well. It is possible that the representation does not sufficiently resolve the changing sea state in the time domain even though it may be adequately resolved in the frequency domain (from a statistical perspective).
Yaw for Atlantic Swell at 4 kt
0 10 20 30 40 50 60 -200 -150 -100 -50 0 50 100 150 200 heading (degrees) s ig n if ic a n t y a w ( d e g re e s ) sea trial motsim 830 800 900 730 930 1000 hrs
Figure 16. Sway Acceleration Nautical Twilight
The motivation for the study was related to the possible assessment of the hazards associated with motions (calibrated from MII’s) of fishing vessels using MOTSIM simulations. The question then arises as to whether the above results would give credibility to MII predictions. First it is unlikely that such complex sea states as encountered at the sea trial site (10 nm from St. John’s) would persist as the vessels move further off shore. For more unidirectional seas the results (heading for heading) are likely to be better. The Atlantic Swell will probably remain in complex seas and will likely be the most difficult to predict MII’s for. Nevertheless it may be fairly claimed that the motion predictions for all these vessels are in the ‘right ball park’ and that MII’s are likely to be at times over-predicted and at others under-predicted,
resulting in a generally fair assessment of their magnitudes on average.
An example from a recent study illustrates the usefulness of the predictions in assessing motion stress profiles on vessels of varying lengths and displacements.
Figure 17 shows MII/minute averaged over 5 locations within 5 m of amidships for 4 vessels of varying lengths but similar designs. The parent hull form is a 65 footer (Chidley). The 80 foot and 100 foot Chidley boats are stretched versions of the parent hull. There is also an 80 foot vessel (designed by TriNav) that is of a similar design but of a deeper draft. The high MII/minute for the Chidley 65 footer are for the vessel at a light displacement (shrimp condition). When the vessel is at a deeper displacement, the comfort level of the
vessel increases considerably.
Sway Acceleration for Nautical Twilight at 4 Knots (Neptune Wave Data)
0 0.1 0.2 0.3 0.4 0.5 0.6 0.7 0.8 -200 -150 -100 -50 0 50 100 150 Heading (degrees) S w a y A c c e le ra ti o n (m /s /s ) sea trial motsim motsim dw motsim 900 motsim 1100 motsim 1200
Motion Induced Interupts/Minute at Fn=0.2, Head Seas, Wave Height 2.5 m 0 0.5 1 1.5 2 2.5 0.5 0.6 0.7 0.8 0.9 1 1.1 1.2 1.3 1.4 1.5
Wave Frequency (rad/s)
M II/ m in u te Chidley 65' Chidley 80' TriNav 80' Chidley 100' Chidley 65' (200t)
Figure 17. MII for various fishing vessels in Head Seas.
5. C
ONCLUSIONSIn this paper, some of the results of the correlation study between a time domain numerical code – MOTSIM, and sea trials are presented.
Overall, it seems that the ranges on the motions obtained by MOTSIM match well with the observed ones from the sea trials. Heading for heading the results, on the other hand, appear not so well predicted. Among the reasons suspected for this are
Doubts on the accuracy of the representations of the measured sea conditions by the wave buoys. Though these representations of the sea states may be adequately resolved in the frequency domain, their time domain representations may not be sufficiently well resolved.
It appears that the larger the vessel size is, the better the predictions are.
Issues related to whether an autopilot was in use during the trials or not. Simulating the response of a human skipper has rather been proven to be very difficult.
In conclusion, the predictions of the present version of MOTSIM are suitable for larger size vessels, while motion predictions for smaller vessels remain a further challenge.
A
CKNOWLEDGEMENTSThis project is collaborative project between Memorial University of Newfoundland, National Research Council of Canada – Institute for Ocean Technology, and Canadian Coast Guard. The authors would like to thank the crew of the all the fishing vessels used in the sea trials, for their enthusiastic and professional support, the CCG for the loan of survival equipment and permission to use their berth facility at the Coast Guard Base (St. John’s), Jack Foley of MUN Oceanography for assistance designing the wave buoy mooring and deploying the wave buoy, Mr. Reg Fitzgerald of Oceans Ltd. for their wave buoy support and IOT technical staff for their efforts throughout the planning and execution of the trial. Support from Oceanic Consulting Corporation for transport support and the Offshore Safety and Survival Centre (OSSC) for Marine Emergency Duty (MED) survival training for IOT staff was much appreciated. Funding support from the Search & Rescue (SAR) New Initiatives Fund (NIF) and the Canadian Institutes of Health and Research (CIHR) is gratefully acknowledged.
R
EFERENCES[1] “SafetyNet – a Community Research Alliance on Health and Safety in Marine and Coastal Work”, www.SafetyNet.MUN.ca, September 2003.
[2] Stevens, S.C., Parsons, M.G., “Effects of Motion at Sea on Crew Performance: A Survey”, SNAME Publication Marine Technology, Vol. 39, No. 1, January 2002, pp. 29 – 47.
[3] Boccadamo, G., Cassella, P., Scamardella, A., “Stability, Operability and Working Conditions Onboard Fishing Vessels”, 7th International Conference on Stability of Ships and Ocean Vehicles, Launceston, Tasmania, Australia, February 7-11, 2000.
[4] Crossland, P., Rich, K.J.N.C., “A Method for Deriving MII Criteria”, Conference on Human Factors in Ship Design and Operation, London, UK, September 27 – 29, 2000. [5] Graham, R., “Motion-Induced Interruptions as
Ship Operability Criteria”, Naval Engineers Journal, March 1990.
[6] Cumming, D., and Fleming, T. “Practical Considerations Related to Carrying out Seakeeping Trials on Small Fishing Vessels”. In the Proceedings of the 7th Canadian Marine Hydromechanics and Structures Conference, Halifax, September 21-22, 2005 (in CD). [7] Cumming, D., Hopkins, D., Williams, J., and
Janes, G. “Description of Manoeuvring, Propulsion and Seakeeping Trials Carried out on the M/V Louis M. Lauzier July – November 2001” Technical Report, National Research Council Canada, Institute for Ocean Technology, TR-2003-13, 2003.
[8] Barrett, J., D. Cumming, and D. Hopkins, ”Description of Seakeeping Trials Carried Out on CCGA Atlantic Swell – October 2003”, IOT Trials Report TR-2003-28, December 2003.
[9] Cumming, D., Hopkins, D., and Barrett, J. “Description of Seakeeping Trial Carried Out on CCGS Shamook - December 2003” IOT Trials Report TR-2004-1, December 2004. [10] Fleming, T. and D. Cumming, ”Description of
Seakeeping Trial Carried Out on CCGA Nautical Twilight – November 1, 2004”, IOT Trials Report TR-2004-13, December 2004. [11] Cumming, D. and T. Fleming, ”Description of
Seakeeping Trial Carried Out on CCGA Miss
Jacqueline IV – October 2004”, IOT Trials Report TR-2004-15, December 2004.
[12] Janes, G. and D. Cumming, ”Fishing Vessel Sea Trial Stand-Alone Data Logging System”, IOT Lab Memo LM-2003-27, September 2003.
[13] Pawlowski, J.S. and D.W. Bass, ”A Theoretical and Numerical Study of Ship Motions in Heavy Seas”, SNAME Trans., Vol. 99, 1991, pp. 319-352.
[14] Sentry Wave Buoy Operation Manual, Neptune Sciences, Inc., Slidell, Louisiana, USA.