HAL Id: hal-03066115
https://hal.archives-ouvertes.fr/hal-03066115
Submitted on 15 Dec 2020HAL is a multi-disciplinary open access
archive for the deposit and dissemination of sci-entific research documents, whether they are pub-lished or not. The documents may come from teaching and research institutions in France or abroad, or from public or private research centers.
L’archive ouverte pluridisciplinaire HAL, est destinée au dépôt et à la diffusion de documents scientifiques de niveau recherche, publiés ou non, émanant des établissements d’enseignement et de recherche français ou étrangers, des laboratoires publics ou privés.
Vicente Pérez-Díaz, Alfonso Pérez-Escudero, Sandra Sanz-Ballesteros,
Guadalupe Rodríguez-Portela, Susana Valenciano-Martínez, Sofía
Palomo-Aparicio, Esther Hernández-García, Luisa Sánchez-García, Raquel
Gordillo-Martín, Hortensia Marcos-Sánchez
To cite this version:
Vicente Pérez-Díaz, Alfonso Pérez-Escudero, Sandra Sanz-Ballesteros, Guadalupe Rodríguez-Portela, Susana Valenciano-Martínez, et al.. A New Method to Increase Ultrafiltration in Peritoneal Dialysis: Steady Concentration Peritoneal Dialysis. Peritoneal Dialysis International, Multimed Inc.; 1999, 2016, 36 (5), pp.555-561. �10.3747/pdi.2016.00007�. �hal-03066115�
Vicente Pérez-Díaz, Alfonso Pérez-Escudero, Sandra Sanz-Ballesteros, Guadalupe Rodríguez-Portela, Susana Valenciano-Martínez, Sofía Palomo-Aparicio, Esther Hernández-García, Luisa Sánchez-García, Raquel Gordillo-Martín, Hortensia Marcos-Sánchez. A new method to increase ultrafiltration in peritoneal dialysis: Steady Concentration Peritoneal Dialysis. Perit Dial Int 2016; 36(5):555-561. https://doi.org/10.3747/pdi.2016.00007
A new method to increase ultrafiltration in peritoneal
dialysis: Steady Concentration Peritoneal Dialysis.
Authors: Vicente Pérez-Díaz (MD, PhD)1,2, Alfonso Pérez-Escudero (PhD)3,
Sandra Sanz-Ballesteros (MD, PhD)1, Guadalupe Rodríguez-Portela (MD)1,
Susana Valenciano-Martínez (MD)1, Sofía Palomo-Aparicio (MD)1, Esther
Hernández-García (MD)4, Luisa Sánchez-García (MD)5, Raquel Gordillo-Martín
(MD)1, Hortensia Marcos-Sánchez (MD)6.
Affiliations:
1Department of Nephrology, Hospital Clínico Universitario de Valladolid, Spain 2Department of Medicine, Dermatology and Toxicology, Facultad de Medicina,
Universidad de Valladolid, Spain
3Department of Physics, Massachusetts Institute of Technology, Cambridge (MA),
USA)
4Department of Nephrology, Complejo Asistencial de Palencia, Spain
5Department of Nephrology, Hospital Universitario Rio Hortega de Valladolid,
Spain
6Department of Clinical Analysis, Hospital Clínico Universitario de Valladolid, Spain
Correspondence and requests for materials should be addressed to:
Vicente Pérez-Díaz. Servicio de Nefrología. Hospital Clínico Universitario de Valladolid. Avenida Ramón y Cajal 3. 47003 Valladolid. Spain. Phone: +34 983 420003 ext 86121. Fax: +34 983 257 511. E-mail: [email protected].
ABSTRACT
Background: Peritoneal dialysis has limited power for liquid extraction (ultrafiltration), so fluid overload remains a major cause for treatment failure.
Methods: We present Steady Concentration Peritonal Dialysis (SCPD), which increases ultrafiltration of peritoneal dialysis exchanges by maintaining a constant peritoneal glucose concentration. This is achieved by infusing 50% glucose solution at a constant rate (typically 40 mL/h) during the 4-hour dwell of a 2L 1.36% glucose exchange. We treated 21 fluid overload episodes on 6 peritoneal dialysis patients with high or average-high peritoneal transport characteristics who refused hemodialysis as an alternative. Each treatment consisted of a single session with 1 to 4 SCPD exchanges (as needed).
Results: Ultrafiltration averaged 653±363 mL/4h—twice the ultrafiltration of the Peritoneal Equilibrium Test (300±251 mL/4h, p<0.001) and sixfold the daily ultrafiltration (100±123 mL/4h, p<0.001). Serum and peritoneal glucose stability and dialysis efficacy were excellent (glycemia 126±25 mg/dL, peritoneal glucose 1830±365 mg/dL, D/P creatinine 0.77±0.08). The treatment reversed all episodes of fluid overload, avoiding transfer to hemodialysis. Ultrafiltration was proportional to fluid overload (p<0.01) and inversely proportional to final peritoneal glucose concentration (p<0.05).
Conclusion: This preliminary clinical experience confirms the potential of Steady Concentration Peritoneal Dialysis to safely and effectively increase ultrafiltration of peritoneal dialysis exchanges. It also shows peritoneal transport in a new dynamic context, enhancing the influence of factors unrelated to the osmotic gradient. Keywords: Ultrafiltration. Glucose concentration. Fluid overload. Technique failure. Fluid transport kinetics. Osmotic gradient. Intraperitoneal pressure. Hydrostatic pressure.
A new method to increase ultrafiltration in peritoneal dialysis: Steady Concentration Peritoneal Dialysis.
INTRODUCTION
Peritoneal dialysis (PD) has a limited capacity to produce ultrafiltration; insufficient ultrafiltration increases morbimortality and is one of the main causes of treatment failure (1-4). To achieve ultrafiltration, PD uses hypertonic dialysis solutions. This method is, in principle, powerful: even the solutions with lowest osmolarity (such as 1.36% glucose) initially induce great ultrafiltration fluxes of 2.7 to 7 mL/min (5-7)—if maintained indefinitely, this would represent between 4 and 10 liters in 24 hours. But peritoneal absorption quickly lowers the osmolarity of the dialysis solution, reducing the ultrafiltration flux. Net ultrafiltration after a few hours is therefore small, sometimes even negative. It can be increased by shortening the exchanges, using dialysis solutions with higher osmolarity, and/or substituting glucose for icodextrin (which is absorbed more slowly) in long exchanges. But these methods have limited efficacy, and alternatives—such as non-commercial icodextrin mixtures with glucose or amino acids (8,9) and Continuous Flow Peritoneal Dialysis (10-13)—are complicated and expensive. As a result, PD fails to deliver enough ultrafiltration for some patients (especially those with anuria or high peritoneal transport characteristics), forcing them to transfer to hemodialysis either occasionally (14,15) or permanently, at great loss of life quality.
We present a simple, safe and powerful method to increase ultrafiltration in peritoneal dialysis: Steady Concentration Peritoneal Dialysis (SCPD). Our method maintains intraperitoneal glucose concentration steady near its initial value during the whole exchange, keeping a high ultrafiltration flux during the whole period. Here we present the method and apply it in a preliminary clinical application to demonstrate its efficacy and potential.
Our method uses a technique originally developed to provide parenteral nutrition through the peritoneal membrane (16-19). It consists of filling the peritoneal cavity with 1.36% glucose dialysis solution and then infusing hypertonic solution of
nutrients (glucose and/or amino acids in the original experiments) slowly and constantly through the catheter. Intraperitoneal concentration reaches a steady state 2-4 hours after starting the infusion and remains constant for at least 6 hours (16,17). These studies found that hypertonic infusion rate does not need to be adjusted for each patient: the same infusion rate led to a narrow range of steady concentrations across patients (1177±228 mg/dL, mean ± standard deviation) (18,19). These concentrations are low enough to be safe and high enough to induce significant ultrafiltration.
MATERIALS AND METHODS Patients
We treated 6 PD patients with high or average-high peritoneal transport characteristics (Table 1). They suffered symptomatic fluid overload (edema, hypertension and/or orthopnea), which did not reverse after modifying diet and PD scheme (including higher osmolarities and icodextrin; Table 1). The patients refused the temporary or permanent transfer to hemodialysis. After treating the first episode of each patient we relaxed the inclusion criteria for their subsequent episodes, applying SCPD as preemptive measure before fluid overload produced severe symptoms. In total, we treated 21 episodes in the 6 patients.
Treatment protocol complied with the Declaration of Helsinki and was conducted in accordance with the laws about off-label use of medications with the approval of the Ethics Committee of Clinical Investigation of Area de Salud Valladolid-Este (CEIC-VA-ESTE-HCUV) (PI 14-179 CINV 14-67) and the Investigation Committee of the Hospital Clínico Universitario de Valladolid, Spain. Patients provided their written informed consent before being treated.
Treatment
All treatments took place in our PD unit in ambulatory regimen. Each treatment consisted of a single session of 1 to 4 Steady Concentration Peritoneal Dialysis (SCPD) exchanges (as needed to revert the fluid overload episode). We performed a total of 41 exchanges in the 21 treatments to the 6 patients. The typical SCPD
exchange was as follows (see next paragraphs for exceptions). We used the Baxter PD system with Luer connection (or adapted a non-Baxter one as described in the supplement). For each SCPD exchange, first we filled the peritoneal cavity with 2 L of 1.36% glucose dialysis solution (Physioneal 1.36, Baxter). Then we connected the catheter to an infusion pump via a Luer connection and infused standard parenteral 50% glucose solution (Braun perfusion solution) at a constant rate of 40 mL/h during the whole dwell time. We limited dwell time to 4 hours to avoid excessive peritoneal volume. Then we interrupted the 50% glucose infusion, disconnected the pump from the catheter, connected a new PD bag, and drained the peritoneal content. We administered as many consecutive SCPD exchanges (up to 4, see Table 1) as necessary to reverse symptoms and/or to obtain enough ultrafiltration so that remaining overweight over dry weight could be handled by the patient. Then, patients went back to their usual PD scheme.
The last 22 exchanges followed the procedure described. We performed the first 19 exchanges using a standard automatic cycler (Home Choice Pro, Baxter), programmed for 4-hours 2 liter 1.36% glucose exchanges. We added a Luer 3-port valve between the cycler and the patient’s catheter, with the infusion pump connected to the third port. During the procedure we manipulated the 3-port valve to allow peritoneal infusion of 50% glucose only during dwell periods. Because of the great ultrafiltration volumes, the automatic cycler sometimes finished the drain phase before a complete drain, leading to an underestimation of ultrafiltered volume. Because of this software problem we switched to the manual procedure described above. These issues were most severe in the 4 first exchanges of patient 1; we have removed them from the analysis of ultrafiltration (Figures 1, 2, 3), but we have kept them in the analysis of peritoneal and serum tolerance (Tables 2. 3).
In the last six exchanges of patient 3 the infusion rate was 50 mL/h or 60 mL/h. We have excluded these exchanges from Figures 2 and 3, which rely on procedures having the same infusion rate.
We took a blood sample before and after each treatment. Every 2 hours we measured capillary glucose (Free Style Optium, Abbott). When we used a cycler, volumes of infusion and drainage were measured automatically; in the manual procedures volumes were measured by weighting. We took samples from all effluents at the mid part of the drain to prevent contamination from 50% glucose solution that could remain in the catheter and around its intraperitoneal tip. In the days after each treatment we recorded by phone the clinical course and dialysis parameters of the patients.
From the blood and peritoneal fluid samples we measured urea, creatinine, glucose, total proteins sodium and dialysate osmolarity by usual laboratory methods. Plasma osmolarity was calculated as Osmolarity=2*[Sodium in mEq/L]+[Glucose in mg/dL]/18+[Urea in mg/dL]/6, where [ ] denotes concentration. For each exchange we calculated ultrafiltration as the weight of the effluent minus the weight of the virgin dialysis solution, and minus 160 g (to account for the 160 mL of infused 50% glucose solution; we assumed a density of 1 g/mL).
RESULTS Ultrafiltration
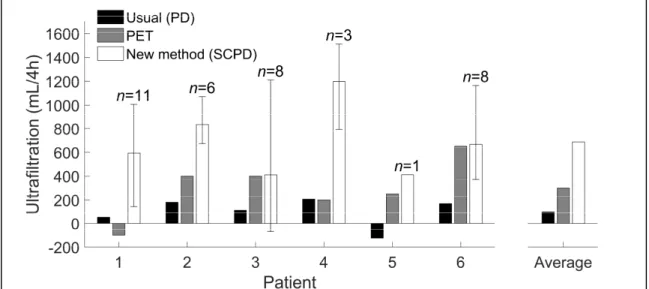
SCPD succeeded in increasing ultrafiltration for all patients (Figure 1). Average ultrafiltration per SCPD exchange was 653±363 mL/4h (mean ± standard deviation; range -70 to 1512 mL/4h). This is more than twice the ultrafiltration obtained in their last peritoneal equilibrium test (PET) (300±251 mL/4h, range -100 to 650 mL/4h; p<0.001, Wilcoxon signed-rank test), and more than six times higher than the ultrafiltration of their usual peritoneal dialysis scheme (100±123 mL/4h, range -125 to 207 mL/4h; p<0.001, Wilcoxon signed-rank test).
Four exchanges of patient 1 were removed from this analysis because of inaccurate measurement of ultrafiltration volume. Adding these 4 exchanges would not change our conclusions: the average ultrafiltration of patient 1 would decrease
to 445±469 mL/h, still higher than his ultrafiltration for PD and PET, and all differences would remain statistically significant.
Clinical outcome
All episodes of fluid overload reversed with SCPD exchanges. In some cases, 1 exchange produced enough ultrafiltration to revert the episode, while other cases required up to 4 consecutive exchanges (Table 1). Some patients recurred with new episodes after the first treatment (from 1 week to 6 months, mean 58 days between successive treatments). SCPD was as effective with these recurring episodes as it had been with the first one, so no patient had to leave peritoneal dialysis because of ultrafiltration failure. Patient 6 suffered from arterial hypertension, needing 4 antihypertensive drugs at high doses. After the first treatment with SCPD we could withdraw all the antihypertensive drugs, and she has not needed them again (this patient has experienced 5 treatments in 5 months, Table 1). We did not find any adverse side effects or experience any complications during the treatment and successive days. In particular, no cases of contamination took place.
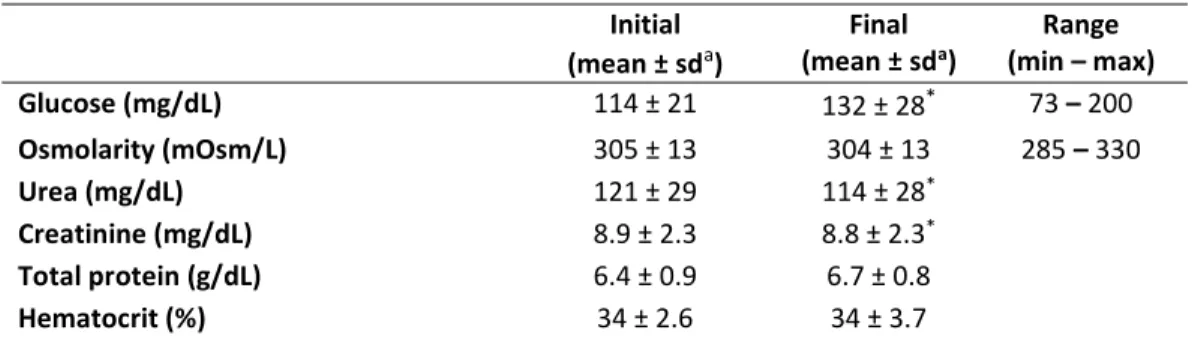
Serum tolerance
We found excellent serum tolerance. Serum glucose rose only slightly during the treatment (from 110±21 mg/dL to 126±25 mg/dL; p<0.01, Wilcoxon signed-rank test). We monitored serum glucose every 2 hours during the treatment, and found no excessive deviations at any point (range 73–200 mg/dL). Serum osmolarity remained constant during the treatment (p=0.4, Wilcoxon signed-rank test), also without excessive deviations (range 285–330 mOsm/L; Table 2).
Peritoneal Tolerance
Peritoneal glucose concentration and osmolarity remained in all cases at safe levels. Initial glucose concentration was always around 1360 mg/dL (nominal value of Physioneal 1.36, which may be slightly modified by mixture with the residual volume), and final concentration after each exchange was 1885±420 mg/dL (range 874 to 2711 mg/dL; p<0.01, Wilcoxon signed-rank test). Likewise,
osmolarity rose from 345 mOsm/L to 380±20 mOsm/L (range 333 to 422 mOsm/L; p<0.01, Wilcoxon signed-rank test). The highest values of these ranges correspond to the 6 SCPD exchanges when infusion rate for 50% glucose was 50 mL/h or higher. For the 35 exchanges with infusion rate 40 mL/h, glucose concentration was 1830±365 mg/dl, ranging from 874 to 2462 mg/dL and exceeding 2270 mg/dL (2.27%) in only 2 cases (Table 3).
Figure 1.- Steady Concentration Peritoneal Dialysis (SCPD) increases ultrafiltration for all patients. Black: Estimated ultrafiltration of a 4-hour exchange in the daily peritoneal dialysis scheme for each patient, calculated with slight excess as daily ultrafiltration divided by 5 (to account for the infusion and drain times). Gray: Ultrafiltration in the last Peritoneal Equilibrium Test (PET). PET was done with 2.27% glucose for patients 1, 2 and 4, and with 3.86% glucose for patients 3, 5 and 6. White: Ultrafiltration per exchange of SCPD (average across all exchanges; error bars limit the full range of measurements; 4 measurements for patient 1 were excluded because ultrafiltration could not be measured accurately, see Materials & Methods). The group of bars on the right-hand side shows the average values across all patients.
Depurative effect of SCPD exchanges
SCPD depuration efficacy was comparable to that of standard PD (Table 3). Serum levels of urea and creatinine decreased slightly during each treatment (urea from 121±29 mg/dL to 115±28 mg/dL, and creatinine from 8.9±2.3 mg/dL to 8.8±2.3 mg/dL; mean ± standard deviation; p<0.01 in both cases, Wilcoxon signed-rank tests). Dialysate-plasma ratio (D/P) at the end of SCPD exchanges was 0.91±0.07 for urea and 0.77±0.08 for creatinine; these values are comparable to those in the
PET for the same patients: D/P urea 0.92±0.04, D/P creatinine 0.80±0.12 (p>0.3 for both, Wilcoxon signed-rank test. Table 1).
The origin of variability in ultrafiltration: correlation with final glucose concentration
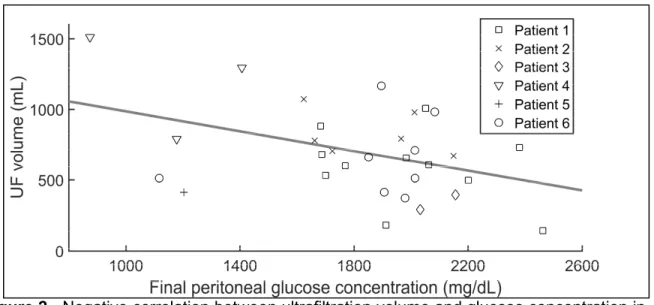
Both ultrafiltration and final peritoneal glucose concentration varied widely, even across identical SCPD exchanges performed on the same patient. And instead of the usual positive correlation between glucose concentration and ultrafiltration, we found a negative one: exchanges that produced lower ultrafiltration had a higher final concentration of peritoneal glucose and vice versa (Figure 2; r=-0.4, p=0.02). This analysis only uses the exchanges with infusion rate 40 mL/h. Our conclusions would not be affected if we included the 6 exchanges with infusion rates of 50 or 60 mL/h (in fact the correlation in Figure 2 would become stronger, r =-0.5, p=.002).
Figure 2.- Negative correlation between ultrafiltration volume and glucose concentration in the effluent of Steady Concentration Peritoneal Dialysis (SCPD) exchanges. Symbols: Experimental data for the 31 exchanges where infusion rate was 40 mL/h and ultrafiltration was measured accurately. Line: Linear fit. r=-0.4, p=0.02. PD = Peritoneal dialysis; UF = Ultrafiltration.
This correlation mixes both intra-patient and inter-patient variability. In order to remove the effect of inter-patient variability, we fitted the data with a linear mixed model, adding a random factor to remove the effect of differences across patients.
This model still finds a significant negative correlation between ultrafiltration and final peritoneal glucose concentration (r=-0.37, p=0.02).
The origin of variability in ultrafiltration: correlation with fluid overload
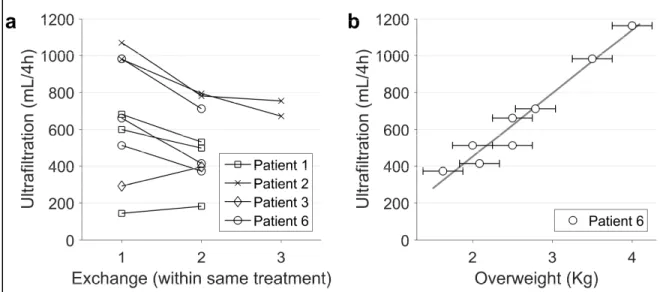
In treatments involving several successive SCPD exchanges, ultrafiltration was lower in each subsequent exchange than in the previous one (Figure 3a; p<0.01, Wilcoxon signed-rank test). This trend is consistent with ultrafiltration being proportional to fluid overload, which is reduced by each successive exchange.
Figure 3.- Ultrafiltration correlates with fluid overload. a) Successive ultrafiltration volumes in treatments with more than one consecutive SCPD exchange. The patients did not eat nor drink during treatment, so each exchange reduces fluid overload by the amount of ultrafiltered volume. b) Circles: Ultrafiltration per SCPD exchange vs. estimated overweight over the patient’s dry weight for patient 6. Overweight was estimated from clinical data (complemented in 2 cases by vectorial bioimpedance) with an estimated accuracy of about ±0.25 Kg, as indicated by the error bars. In treatments with a second SCPD exchange, overweight for the second exchange was calculated as overweight at the beginning of the treatment minus ultrafiltration of the first exchange. Line: linear fit (r = 0.98, p<0.0001).
Further evidence of the relation between ultrafiltration and fluid overload comes from the data of patient 6, whose degree of fluid overload covered a wide range during the study: this patient underwent 5 treatments with a total of 8 SCPD exchanges over 5 months, and her estimated overweight (over her dry weight) at the beginning of each treatment decreased from 4 to 2 liters. For this patient, ultrafiltration obtained by SCPD was proportional to the degree of fluid overload
(Figure 3b; p<10-4, linear correlation). Patient 6 is an exception in her wide range of
fluid overload at the beginning of each treatment (all other patients started every treatment with a more similar degree of fluid overload).
DISCUSSION
Steady Concentration Peritoneal Dialysis (SCPD) achieves high ultrafiltration in a short period, even in patients with impaired ultrafiltration: in our six patients, who had high peritoneal transport characteristics, it extracted on average 653 mL in 4 hours—more than twice the ultrafiltration achieved by the Peritoneal Equilibrium Test (PET) and more than six times the ultrafiltration obtained in their regular dialysis regime.
This enhanced ultrafiltration is clinically significant. SCPD succeeded where our usual methods to control fluid overload had failed (these methods included dialysates up to 2.27% glucose and icodextrin). SCPD reverted all episodes of fluid overload and could be repeated when necessary to treat new episodes, allowing all patients to remain in peritoneal dialysis technique for as long as was needed. SCPD is simpler, more accessible and cheaper than alternative resources, such as non-commercial icodextrin mixtures (8,9) or Continuous Flow Peritoneal Dialysis (10-13); it is simple enough to be implemented in any small PD unit such as our own, thus having the potential to save many patients from the disadvantages of being transferred to hemodialysis, either occasionally (14,15) or permanently. We found no side effects beyond hemodynamic adaptation to rapid ultrafiltration, including the occasional need to decrease antihypertensive medication. Likewise, we found no complications; in particular, in spite of using Luer connectors not specific of PD and increasing the number of connection and disconnection maneuvers, we did not have any case of contamination. Contamination risk will be further reduced in the future, with procedures and instrumentation tailored for SCDP. These procedures must also ensure that 50% glucose can never be infused before filling the peritoneum with dialysis solution, because this might produce serious complications.
Plasmatic tolerance to the infused hypertonic glucose solution was excellent: plasma glucose and osmolarity remained close to basal levels during all treatments, which lasted between 5 and 21 hours. Longer or more aggressive treatments are unlikely to be needed, because our patients were high transporters in extreme clinical situation; lower infusion rates and/or shorter times will suffice for most patients. Peritoneal tolerance was also good: peritoneal glucose concentration and osmolarity remained well below the level of 3.86% peritoneal solutions used in the PET, ensuring short-term peritoneal membrane safety. The highest peritoneal glucose concentrations (between 2462 and 2711 mg/dL) correspond to exchanges with infusion rate of 50 to 60 mL/h (Table 2). Therefore, infusion rates up to 40 mL/h are advisable to ensure low peritoneal glucose concentration. SCPD will probably achieve enough ultrafiltration with even lower peritoneal concentrations, closer to the initial 1360 mg/dL, which would be preferable to ensure peritoneal long-term safety. Further research should improve the technique to achieve a narrower range of concentrations around the desired value. Modifications of the infusion rate seem the obvious option, but modifications of other parameters, such as exchange duration or filling volume, may suffice (see below).
SCPD has excellent dialysis properties. D/P for creatinine and urea were similar to those measured in the same patients’ PET, and serum urea and creatinine decreased slightly but significantly during the treatment (probably due to the increased convection caused by the additional ultrafiltration). These good dialysis properties are irrelevant for an occasional use of this technique, but open the possibility of including regular SCPD exchanges in the PD scheme of some patients.
Besides its therapeutic potential, SCPD provides a tool to study peritoneal fluid transport in a different dynamical context than that of PD. A full analysis is beyond the scope of this paper and beyond the quality and quantity of our experimental data, originally recorded to evaluate the efficacy and safety of the treatment. But we cannot fail to notice the wide variability in ultrafiltration and final peritoneal
glucose concentration, the seemingly paradoxical negative correlation between them (Figure 2), and the positive correlation between ultrafiltration and fluid overload (Figure 3). This positive correlation has already been observed in other studies (20-22) and can be explained by the Starling forces: fluid overload increases capillary hydrostatic pressure and reduces capillary colloid osmotic pressure, facilitating ultrafiltration (23,24). The negative correlation between ultrafiltration and final glucose concentration can be explained as follows: the same amount of infused glucose will be more concentrated in a smaller volume (when ultrafiltration is low) than in a larger one (when ultrafiltration is high). But we still need to explain why identical procedures give such variable outcomes. For different patients, the variability is probably dominated by differences in their peritoneal characteristics (such as the osmotic conductance). But we also find high variability within the same patient, and the negative correlation between glucose concentration and ultrafiltration holds when we remove the effect of differences across patients. A possible source of intra-patient variability is measurement error due to residual volumes. We took especial care to achieve complete drainages and do not believe that these errors can explain all of the observed variability, but we have no way to check this with certainty. Another factor that may play a role is intraperitoneal pressure, which opposes net ultrafiltration (25-33) either by opposing the flow of water outwards the capillaries, by increasing lymphatic absorption rate or by increasing the flow of the intraperitoneal fluid to the surrounding tissues (29-38). While the role of intraperitoneal hydrostatic pressure is unclear (38), clinical experience suggests that smaller fill volumes increase ultrafiltration in some cases (20,29,39-40).
This small pilot study has several limitations. The increase of ultrafiltration is evident in our sample, but when generalizing our conclusions we must take into account that we only treated 6 patients, all of whom are high or average-high transporters. Also, we have not compared SCPD with an acute treatment with 3.86% glucose exchanges.
Besides its use in the hospital, SCPD could be performed by the patients at home, once adequate procedures and materials are developed (perhaps including a portable pump if diurnal exchanges are needed). This ambulatory SCPD would help diminish the number of patients suffering from the increased morbimortality associated with chronic fluid overload (4,41). It may be also an excellent resource for pediatric PD patients, who need high ultrafiltration and also nutrition that could be provided by SCPD, which glucose and amino acid solutions (18,19). Also, the low glucose concentrations achieved by SCPD would preserve peritoneal function in the long term, perhaps even improving it in the same way as peritoneal rest (42), but without the need of discontinuing PD.
Each SCPD exchange results in absorption of almost 59 g of glucose on average. This is more than three times the amount absorbed in the same period of time in a regular PD exchange (17 g on average). This increased glucose load is not a problem for acute treatments with SCPD, but must be taken into account when using it regularly.
Further study is needed to establish the optimum duration of the exchange and intraperitoneal volume, the best composition of the infused hypertonic solution (glucose, amino acids, mixtures, etc.), and the most adequate speed of infusion. In conclusion, SCPD may provide an effective and safe tool to manage ultrafiltration in PD, opening new therapeutic possibilities to optimize and increase the flexibility of PD treatments, and providing a new tool to study peritoneal transport. This newborn method is at an early stage, with a great potential of improvement as future research refines its methodology.
Acknowledgments
Presented in part in: LI Reunión de la Sociedad Castellano Astur Leonesa de Nefrología SCALN, Burgos 24-25 Octubre 2014, 15th Congress of the International Society for Peritoneal Dialysis ISPD. 7th to 10th September 2014, Madrid, XLV
Congreso Nacional de la Sociedad Española de Nefrología. Valencia 3-6 Octubre 2015, and IX Reunión Nacional de Diálisis Peritoneal 2016. Cáceres, 28-30 Enero 2016, Spain.
Funding: A.P.-E. acknowledges funding from an EMBO fellowship (ALTF818-214) and a Human Frontier Science Program fellowship (LT000537/2015).
The authors thank Lucila Fernández-Arroyo and all others CAPD nurses of Hospital Clínico de Valladolid for their assistance in the performance of the treatments.
Disclosures
The authors have no conflicts of interest to declare
REFERENCES
1. Liberek T, Renke M, Skonieczny B, Kotewicz K, Kowalewska J, Chmielewski M, et al. Therapy outcome in peritoneal dialysis patients transferred from haemodialysis. Nephrol Dial Transplant 2009; 24: 2889-2894.
2. Shen JI, Mitani AA, Saxena AB, Goldstein BA, Winkelmayer WC. Determinants of peritoneal dialysis technique failure in incident US Patients. Perit Dial Int 2013; 33: 155-166.
3. Tietelbaum I. Ultrafiltration failure in peritoneal dialysis. A Pathophysiologic approach. Blood Purif. 2015; 39: 70-73.
4. Guo Q, Lin J, Li J, Yi C, Mao H, Yang X, et al. The effect of fluid overload on clinical outcome in southern chinese patients undergoing continuous ambulatory peritoneal dialysis. Perit Dial Int 2015; 35: 1–12.
5. Pyle WK: Mass Transfer in Peritoneal Dialysis. Ph D Disertation. Univ of Texas. 1981. Cited by Popovich RP, Moncrief JW. 5. Transport kinetics pp 122-158. In Nolph KD, ed. Peritoneal Dialysis. Second edition. 1985 Martinus Nijhoff Publishers, Dordrecht. 6. Heimbürger O, Waniewski J, Werynski A, Lindholm B. A quantitative description of solute and fluid transport during peritoneal dialysis. Kidney Int 1992; 41: 1320–1332. 7. Krediet RT. The physiology of peritoneal solute, water, and lymphatic transport, In Nolph and Gokal’s Textbook of Peritoneal Dialysis, eds. Khanna R, Krediet RT. Springer Science + Business Media, LLC 2009. pp 137-172.
8. Faller B, Shockley T, Genestier S, Martis L. Polyglucose and amino acids: preliminary results. Perit Dial Int 1997; 17 (Suppl 2): S63–S67.
9. Freida P, Issad B, Dratwa M, Lobbedez T, Wu L, Leypoldt JK., et al. A combined crystalloid and colloid PD solution as a glucose-sparing strategy for volume control in high-transport APD patients: A prospective multicenter study. Perit Dial Int 2009; 29: 433-42. 10. Freida P, Issad B. Continuous flow peritoneal dialysis: Assessment of fluid and solute removal in a high-flow model of “fresh dialysate single-pass”. Perit Dial Int 2003; 23: 348-355.
11. Diaz-Buxo JA. Access and continuous flow peritoneal dialysis. Perit Dial Int 2005; 25(Suppl 3): S102-S104.
12. Ronco C, Amerling R. Continuous flow peritoneal dialysis: Current state-of-the-art and obstacles to further development. Contrib Nephrol 2006; 150: 310-20.
13. Amerling R, Winchester JF, Ronco C. Continuous flow peritoneal dialysis: Update 2012. Contrib Nephrol 2012; 178: 205-15.
14. Kawanishi H, Moriishi M, Katsutani S, Sakikubo E., Tsuchiya S. Hemodialysis together with peritoneal dialysis is one of the simplest ways to maintain adequacy in continuous ambulatory peritoneal dialysis. Adv Perit Dial 1999; 15: 127-31.
15. Kawanishi H, Moriishi M, Tsuchiya S. Five years experience of combination therapy: Peritoneal dialysis with hemodialysis. Adv Perit Dial 2002; 18: 62-67.
16. Jimeno A, De Alvaro F, Pérez Díaz V, Ibañez E, Largo E, Martín del Río R, et al. Absorción peritoneal de glucosa utilizando un nuevo modelo cinético. Nefrología 1987; 7: 125-130.
17. De Alvaro F, Jimeno A, Pérez Díaz V, Largo E, Ibañes E, Martín del Río R, et al. Parenteral nutrition via the peritoneum with dextrose and aminoacids. Nephron 1987; 46: 49-56.
18. De Alvaro F, Pérez Díaz V, Jimeno A, Largo E, Martín del Río R, Latorre A, et al. Nutrición peritoneal continua en pacientes en DPAC. Nefrología 1988; 8 (Suppl 3): 75-80. 19. Pelaz Salomón A. Administración intraperitoneal de nutrientes. Nuevo método de nutrición parenteral en humanos. Tesis doctoral. Universidad de Valladolid 1991. Available from https://sites.google.com/site/nutricionperitoneal/bibliografia
20. Kuriyama S, Otsuka Y, Iida R, Matsumoto K, Hosoya T. Icodextrin with small and short dwell enhances ultrafiltration in peritoneal dialysis patients with severe overhydratation. Perit Dial Int 2006; 26: 508-509.
21. Koning CJ, Kooman JP, Schonck M, Gladziwa U, Wirtz J, Van den Wall, Blake AW, et al. Effect on icodextrin on volume status, blood pressure and echocardiographic parameters: a ranomized study. Kidney Int 2003; 63: 1556-1563.
22. Davies SJ, Garcia Lopez E, Woodrow G, Donovan K, Plum J, Williams P, et al. Longitudinal relationships between fluid status, inflammation, urine volume and plasma metabolites of icodextrin in patients randomized to glucose or icodextrin for the long exchnage. Nephrol Dial Transplant 2008; 23: 2982-2988.
23. Venturoli D, Jeloka TK, Ersoy FF, Rippe B, Oreopoulos DG The variability in ultrafiltration achieved with icodextrin, possibly explained. Perit Dial Int 2009; 29: 415–421. 24. Lambie M, Stompor T, Davies S. Understanding the variability in ultrafiltration obtained with icodextrin. Perit Dial Int 2009; 29: 407-411.
25. Durand FY, Chanliau J, Gamberoni J, Hestin D, Kessler M. Intraperitoneal hydrostatic pressure and ultrafiltration volume in CAPD. Adv Perit Dial 1993; 9: 46-48. 26. Fischbach M, Desprez Ph, Donnars F, Geisert J. Hydrostatic intraperitoneal pressure in children on peritoneal dialysis: Practical implications. An 18 month clinical experience. Adv Perit Dial. 1994; 10: 294-296
27. Rusthoven E, Van der Vlugt ME, Van Lingen-van Bueren LJ, Van Schaijk TCJG, Willems HL, Monnens LAH, et al. Evaluation of intraperitoneal pressure and the effect of different osmotic agents on intraperitoneal pressure in children. Perit Dial Int 2005; 25: 352-356.
28. Blake PG, Daugirdas JT. Physiology of Peritoneal Dialysis, in Handbook of Dialysis (fifth edition), eds. Daugirdas JT, Blake PG, Ing TS. Wolters Kluwer, Lippincott, Williams & Wilkins. Philadelpia (PA), 2015, pp 392-407
29. Flessner MF. Peritoneal ultrafiltration: Physiology and failure. Contrib Nephrol 2009; 163: 7-14
30. Zink J, Greenway C.V. Control of ascites absorption in anaesthetized cats. Effect of intraperitoneal pressure, protein and frusemide diuresis. Gastroenterology. 1977; 73: 1119-1124.
31. Mactier RA, Khanna R, Twardowski ZJ, Moore H, Nolph KD. Contribution of lymphatic absorption to loss of ultrafiltration and solute clearances in continuous ambulatory peritoneal dialysis. J.Clin Invest. 1987; 80: 1311-1316.
32. Abensur H, Egidio Romiio JJr, Brandiio de Almeida Prado E, Kakehashi E, Sabbaga E, Marcondes M. Influence of the hydrostatic intraperitoneal pressure and the cardiac function on the lymphatic absorption rate of the peritoneal cavity in CAPD. Adv Perit Dial 1993; 9: 41-45.
33. Wang T, Heimburger O, Gheng H-H, Waniewski J, Bergström J, Lindholm B. Effect of increase dialysate fill volume on peritoneal fluid and solute transport. Kidney Int 1997; 52: 1068-1076.
34. Henriksen JH, Lassen NH, Parving H-H, Winkler K. Filtration as the main transport mechanism of protein exchange between plasma and the peritoneal cavity in hepatic cirrhosis. Scand J Clin Lab Invest. 1980; 40: 503-513.
35. Nolph KD, Mactier R, Khanna R, Twardowski ZJ, Moore H, McGary T. The kinetics of ultrafiltration during peritoneal dialysis: The role of lymphatics. Kidney Int. 1987; 32: 219-226.
36. Krediet RT, Boeschoten EW, Struijk DG, Arisz L. Differences in the peritoneal transport of water, solutes and proteins between dialysis with two- and with tree-litre exchanges. Nephrol Dial Transplant. 1988; 2: 198-204.
37. Shockley TR, Ofsthun NJ. Pathways for fluid loss from the peritoneal cavity. Blood Purif. 1992; 10: 115–121.
38. Rippe B. Is intraperitoneal pressure important? Perit Dial Int 2006; 26: 317-319. 39. Freida Ph, Potier J, Perte d’ultrafiltration due à une elevation acquise de la pression intrapéritonéale au cours d’une ataxie-télangiectasie. (Abstract) Le Bulletin de la Dialyse Péritonéale. 1995; 5(Suppl 1): S5.
40. Fischbach M, Issad B, Dubois V, Taamma R. The beneficial influence on the effectiveness of automated peritoneal dialysis of varying the dwell time (short/long) and fill volume (small/large): a randomized controlled trial. Perit Dial Int 2011; 31: 450-458.
41. Davies SJ. What are the Consequences of Volume Expansion in Chronic Dialysis Patients? Semin Dial 2015; 28: 239–242.
42. De Sousa E, Del Peso G, Alvarez L, Ros S, Mateus A, Aguilar A, et al. Peritoneal resting with heparinized lavage reverses peritoneal type I membrane failure. A comparative study of the resting effects on normal membranes. Perit Dial Int 2014; 34: 698-705.
TABLE 1
Table 1.- Patients in the study
Patient 1 Patient 2 Patient 3 Patient 4 Patient 5 Patient 6 Sexa/age (years) M/86 F/72 F/66 M/62 F/49 F/51
Months in PDb 17 12 84 27 4 42
Reasonc Overload Overload Overload Anasarca Overload Overload
Week Kt/V 2.18 1.87 2.31 1.79 2.44 2.15
D/P Urea/Creat.d 0.94/0.83 0.89/0.77 0.90/0.82 0.91/0.75 0.98/1.00 0.87/0.64 Concentratione 2.27% + I 1.72% + I 2.12% 2.27%+ Dry 1.82% 2.27% + I
Diuresis (mL/day) 550 0 0 900 2750 0
PETf Highk
Average-Highk
Highl Highk Highl Average-
Highl UF PET (mL/4h)g -100k 400k 400l 200k 250l 650l Daily UF (mL/day)h 270 905 569 1037 -624 850 SCPD Exchangesi 4A-1M-2M- 1M-1M-1M-2M-2A-1M 3A-3A 4A-4A 1M-1M-1M 1M 1M-2M-1M-2M-2M Infusion ratej (mL/h) 40 40 40,40,50,60 50,60,50,50 40 40 40 a M = Male; F = Female.
b Months in treatment with PD before the first treatment with SCPD.
c Reason why the treatment with SCPD was necessary. Overload = fluid overload.
d Dialysate-plasma ratio for urea and creatinine obtained in the last Peritoneal Equilibrium Test (PET).
e Mean concentration of glucose of dialysis solutions used in the patient’s daily PD in the month prior to treatment. I =
Icodextrin 7.5%. Dry=dry day.
f Transport state in the last PET.
g Ultrafiltration obtained in the last PET (4 hours).
h Mean daily ultrafiltration during the month previous to the first treatment.
i Number and type of SCPD exchanges per treatment. A=automatic; M=manual. For example, 3A-3A means that the
patient underwent two treatments, each of them composed of 3 automatic SCPD exchanges.
j Rate of infusion of 50% glucose during SCPD. All patients except patient 3 had the same rate in all exchanges. k PET was performed with 2.27% dialysis solution.
Table 2.- Serum levels before and after each treatment
Initial
(mean ± sda) (mean ± sdFinal a) (min – max) Range
Glucose (mg/dL) 114 ± 21 132 ± 28* 73 – 200 Osmolarity (mOsm/L) 305 ± 13 304 ± 13 285 – 330 Urea (mg/dL) 121 ± 29 114 ± 28* Creatinine (mg/dL) 8.9 ± 2.3 8.8 ± 2.3* Total protein (g/dL) 6.4 ± 0.9 6.7 ± 0.8 Hematocrit (%) 34 ± 2.6 34 ± 3.7 a sd = standard deviation
* Statistically significant differences between initial and final values, Wilcoxon signed-rank test (p<0.01).
Lack of asterisk means p>0.05.
TABLE 3
Table 3.- Levels in dialysis solution before and after each exchange
Initiala Final
(mean ± sdb) (min – max) Range
Glucose (mg/dL) Infusion at 40 mL/h (n = 35) 1360 1788 ± 367** 874 – 2462 Infusion at ≥ 50 mL/h (n = 6) 1360 2452 ± 211** 2218 – 2711 Osmolarity (mOsm/L) Infusion at 40 mL/h (n = 35) 345 375 ± 17** 333 – 405 Infusion at ≥ 50 mL/h (n = 6) 345 411 ± 9** 398 – 422 Urea (mg/dL) 0 106 ± 27** 60 – 158 Creatinine (mg/dL) 0 6.74 ± 1.64** 4.7 – 9.7 D/P Urea 0 0.91 ± 0.07** 0.78 – 1.05 D/P Creatinine 0 0.77 ± 0.08** 0.60 – 1.03 a Nominal values for Physioneal 1.36
b sd = standard deviation
Vicente Pérez-Díaz, Alfonso Pérez-Escudero, Sandra Sanz-Ballesteros, Guadalupe Rodríguez-Portela, Susana Valenciano-Martínez, Sofía Palomo-Aparicio, Esther Hernández-García, Luisa Sánchez-García, Raquel Gordillo-Martín, Hortensia Marcos-Sánchez
SUPPLEMENTARY INFORMATION
Switching to Baxter Luer connector
To insert a Baxter connector in a non-Baxter system without damaging the peritoneal catheter, we adapted a catheter extension set with the following procedure, performed in a sterile environment and with sterile materials (see figure with initial and f final situation an material necessary). First, we clamped the tube of the extension set near its proximal end (the side that connects to the patient’s catheter). Then we sterilized for 2 minutes the middle part of the tubing with povidone, and cut it through the middle with a scalpel. We discarded the distal half of the extension set and submerged for 10 minutes the cut end of the proximal half into povidone to ensure sterility. Then we inserted a titanium adaptor in the cut end and
connected it to a Baxter extension set with its Luer connector. For all other manipulations and connections we used standard PD procedures.